by Contributed | Oct 26, 2020 | Technology
This article is contributed. See the original author and article here.
Previewing data in a table:
Previewing the data in a table is one of the best ways to instantly understand it’s content and data structure.
Since it’s introduction, a large amount of our users have used our new ‘preview’ popup window to gain instant insight into the content of a table – and continued to use the ‘load to query editor’ button to load the preview query as a starting point for more complex insights.
Double click to preview:
Today we introduce a small but important enhancement to this feature.
Double clicking a table item will now immediately run the preview query in the query editor:
 This is a small yet powerful enhancement designed to further shorten your way to insight.
Settings:
Use our settings to choose if you prefer double clicking a table to run the preview query or add the table’s name to the query editor:

Feedback:
We value your feedback! please leave your comments and let us know if you like this new enhancement.
by Contributed | Oct 26, 2020 | Technology
This article is contributed. See the original author and article here.
Mutual TLS Authentication between Azure Kubernetes Service and API Management
By (alphabetically): Akinlolu Akindele, Dan Balma, Maarten Van De Bospoort, Erin Corson, Nick Drouin, Heba Elayoty, Andrei Ermilov, David Giard, Michael Green, Alfredo Chavez Hernandez, Hao Luo, Maggie Marxen, Siva Mullapudi, Nsikan Udoyen, William Zhang
Introduction
We have two goals in this doc:
- How to set up AKS cluster for mutual TLS (mTLS) authentication between Azure Kubernetes Service (AKS) NGINX ingress controller and a client app such as curl? If you are not using a gateway for your microservices or using a gateway other than Azure API Management (APIM), this portion is what might interests you.
- How to set up APIM for mTLS between AKS and APIM? This covers the case in which APIM is used as the API gateway for REST services hosted in AKS cluster.
This is a sister doc to Use MITREid Connect for OAuth2 Authorization in API Management: one covers securing AKS via mTLS between AKS and APIM while the other covers securing APIM via OAuth2 and OpenID Connect across APIM, Identity Provider and clients.
Our goal is for AKS (as a service) to authenticate APIM (as a client) so that only calls from APIM with a valid client cert with private key can get thru. Therefore what we need is not TLS between APIM and AKS which is for client (APIM in our case) to authenticate server (AKS in our case). What we need is mutual TLS.
As a reference and also for context, this and this documents provide mTLS authentication between APIM and Azure App Service.
The steps:
- HTTPS calls from APIM is intercepted by frontend load balancer of App Service
- App Service frontend load balancer injects an X-ARR-ClientCert request header with the client certificate (base64 string) as the header value, before forwarding the request to application code.
- Application code retrieves the cert string such as headers[“X-ARR-ClientCert”] and converts it to an X.509 cert.
- Application code parses the cert and verifies the attributes and claims as client authentication.
As you can see, the approach for mTLS between APIM and App Service is not as good as we wish:
- The HTTP header X-ARR-ClientCert seems to be Microsoft-specific, instead of any open spec (maybe there is no such spec?) What is the story for AKS? While APIM is Microsoft, AKS is internally Kubernetes.
- The client cert authentication happens inside application code. This defeats the purpose of using APIM as API gateway.
Our goal is to achieve mTLS between APIM and AKS without custom security code in applications in AKS pods. Rather we hope to rely on AKS NGINX ingress controller and ingress resources to perform client cert authentication at infrastructure level.
Prerequisites
kubectl. Minimum version required is v 1.18. To find your kubectl client version:
kubectl version –client
openssl for preparing certificates. Or if you prefer, you can use other tools for creating self-signed certs.
helm . (Windows 10 users can just put the unzipped folder anywhere and add the corresponding PATH variable.)
Prepare DNS
Since our plan is not to use VNET to enclose both AKS and APIM, we need to have a DNS-resolvable domain name. This domain name will be mapped to AKS NGINX ingress controller load balancer static IP. For this we need to first register a domain. As an example, aksingress.com is registered and its subdomain dev.aksingress.com will be used in this document.
Prepare X.509 Certificates
Self-signed certs can be used for dev/test. OpenSSL can be used for creating self-signed certs.
We need the following three certs in certain file formats:
Name |
Purpose |
Environment |
Private Key Required |
Required Formats |
|---|
CA |
Certificate Authority |
Kubernetes Secrets |
No |
.crt, .cer |
Server |
Server Certificate |
Kubernetes Secrets |
Yes |
.crt, .key |
Client |
Client Certificate |
APIM, test client |
Yes |
.crt, .key, .pfx |
NOTES:
- Relying on legacy Common Name for cert validation will be deprecated in Kubernetes. It is recommended to use Subject Alternate Names (SANs) instead.
- For TLS, the server cert SAN must match the FQDN of server backend, which, in our case, is the AKS ingress resource host name. This host name will pair with the static IP of AKS NGINX ingress controller we will create later on.
- The private key of CA is NOT installed anywhere: either in Kubernetes secret or API Management.
First let’s create configuration files for both client and server certs:
File: server_dev.cnf
[ req ]

default_bits = 4096

prompt = no

encrypt_key = no

default_md = sha256

distinguished_name = dn

req_extensions = req_ext
[ dn ]

CN = dev.aksingress.com

emailAddress = acp@microsoft.com

O = Microsoft

OU = CSE

L = Redmond

ST = WA

C = US
[ req_ext ]

subjectAltName = @alt_names

[alt_names]

DNS.1   = dev.aksingress.com
File: client_dev.cmf
[ req ]

default_bits = 4096

prompt = no

encrypt_key = no

default_md = sha256

distinguished_name = dn

req_extensions = req_ext
[ dn ]

CN = gateway.com

emailAddress = acp@microsoft.com

O = Microsoft

OU = CSE

L = Redmond

ST = WA

C = US
[ req_ext ]

subjectAltName = @alt_names

[alt_names]

DNS.1   = gateway.com
Below we assume the existence of a subfolder .mTLS under openssl command.
Openssl commands:
# Create CA

openssl req -x509 -sha256 -newkey rsa:4096 -keyout mTLSca.key -out mTLSca.crt -days 3650 -nodes -subj “/CN=My Cert Authority”
# Generate the Server Key, and Certificate and Sign with the CA Certificate

openssl req -out mTLSserver_dev.csr -newkey rsa:4096 -nodes -keyout mTLSserver_dev.key -config mTLSserver_dev.cnf

openssl x509 -req -sha256 -days 3650 -in mTLSserver_dev.csr -CA mTLSca.crt -CAkey mTLSca.key -set_serial 01 -out mTLSserver_dev.crt
# Generate the Client Key, and Certificate and Sign with the CA Certificate

openssl req -out mTLSclient_dev.csr -newkey rsa:4096 -nodes -keyout mTLSclient_dev.key -config mTLSclient_dev.cnf

openssl x509 -req -sha256 -days 3650 -in mTLSclient_dev.csr -CA mTLSca.crt -CAkey mTLSca.key -set_serial 02 -out mTLSclient_dev.crt
# to verify CSR and show SAN

openssl req -text -in mTLSserver_dev.csr -noout -verify

openssl req -text -in mTLSclient_dev.csr -noout -verify
Since APIM expects certs in Microsoft format such as .pfx and .cer, and Kubernetes expects certs in .crt and .key format, we need the following conversion.
# Convert .crt + .key to .pfx

openssl pkcs12 -export -out mTLSca.pfx -inkey mTLSca.key -in mTLSca.crt

openssl pkcs12 -export -out mTLSclient_dev.pfx -inkey mTLSclient_dev.key -in mTLSclient_dev.crt

openssl pkcs12 -export -out mTLSserver_dev.pfx -inkey mTLSserver_dev.key -in mTLSserver_dev.crt
Create AKS Cluster
To leverage the AKS-managed Azure Active Directory integration feature, we can use the following CLI to create an AKS cluster with AKS-managed AAD integration.
# parameters used for creating AKS

tenant_id=”1aaaabcc-73b2-483c-a2c7-b9146631c677″

aks_admin_group_name=”aks-admin-group”

aks_api_group_name=”aks-api-group”

resource_group_name=”rg-aks”

aks_cluster_name=”aks-cluster-04″
echo “display current AAD groups”

az ad group list -o table

# echo “Create a group for AKS cluster admins”

# az ad group create –display-name $aks_admin_group_name –mail-nickname myalias
# echo “Create resource group $resource_group_name”

# az group create –name $resource_group_name –location centralus
echo “get aks-admin-group object ID for $aks_admin_group_name:”

aks_admin_group_object_id=$(az ad group show –group $aks_admin_group_name –query objectId -o tsv)

echo $aks_admin_group_object_id

echo “get aks-api-group object ID for $aks_api_group_name:”

aks_api_group_object_id=$(az ad group show –group $aks_api_group_name –query objectId -o tsv)

echo $aks_api_group_object_id
echo “Create an AAD-managed AKS cluster”

az aks create –resource-group $resource_group_name

            –name $aks_cluster_name

            –node-count 1

            –enable-aad

            –aad-admin-group-object-ids $aks_admin_group_object_id

            –aad-tenant-id $tenant_id

            #–generate-ssh-keys
Creating Kubernetes Secrets
First make sure we are working with the correct AKS cluster context.
echo “Ensure you have the right credential. It will update C:Users[userid].kubeconfig with the new cluster context.”

az aks get-credentials -g rg-aks -n aks-cluster-04
echo “Display the current AKS cluster context”

kubectl config current-context
Assume the ca.crt, server_dev.crt and server_dev.key files are in a sub-folder named mTLS.
# Add server.crt, server.key and ca.crt into Kubernetes secret named ingress-secret

kubectl create secret generic ingress-secret-dev –from-file=tls.crt=”mTLSserver_dev.crt” –from-file=tls.key=”mTLSserver_dev.key” –from-file=ca.crt=”mTLSca.crt”
# Display the secret

kubectl get secret ingress-secret-dev

# List all secrets in the cluster

kubectl get secrets
Creating an NGINX Ingress Controller
An ingress controller is required to work with Kubernetes ingress resources. We will define client authentication and TLS configurations in an ingress resource.
We can put ingress controller either in the default namespace or a custom namespace.
    # Create a Helm repo

    helm repo add ingress-nginx https://kubernetes.github.io/ingress-nginx

    # To see the Helm repo

    helm repo list

    # Use Helm to deploy an NGINX ingress controller

    helm install nginx-ingress ingress-nginx/ingress-nginx

        –namespace default

        –set controller.replicaCount=1

        –set controller.nodeSelector.”beta.kubernetes.io/os”=linux

        –set defaultBackend.nodeSelector.”beta.kubernetes.io/os”=linux
Details can be found in this doc .
Have a Test App and Add its Container to ACR
This is beyond the scope of this document.
Ideally for better test result, the REST API app should have the following:
- At least three methodts: get, post, delete. This would allow us to test RBAC, such as only a specific role can delete while anyone can do get/create. RBAC is out of the scope of this document.
- The get method should return the full request headers as part of the response so that we can see the headers received by the application code. As a request goes through OAuth2 and then mTLS, some additional headers will be added and are available to application code.
Deploy the Container to AKS Pods
Create a YAML file and save it with the name “tinyrest_container.yml.
apiVersion: apps/v1

kind: Deployment

metadata:

name: tinyrest

labels:

    app: tinyrest

spec:

replicas: 1

selector:

    matchLabels:

    app: tinyrest

template:

    metadata:

    labels:

        app: tinyrest

    spec:

    containers:

    – name: tinyrest

        image: myacr.azurecr.io/tinyrest:latest

        ports:

        – containerPort: 3000
Authenticate with Azure Container Registry from Azure Kubernetes Service by running a command like below:
echo “ACR integration with AKS”

az aks update –name aks-cluster-04 –resource-group rg-aks –attach-acr myacr
Deploy the container by running the following kubectl commands:
echo “Deploy container from ACR to AKS”

kubectl apply -f ./aks_bash/tinyrest_container.yml

kubectl get deploy

kubectl get pods
Deploy a Service to Expose the Pods
Create a YAML for service:
apiVersion: v1

kind: Service

metadata:

name: tinyrest-svc

spec:

ports:

– port: 8080

    targetPort: 3000

    protocol: TCP

    name: http

selector:

    app: tinyrest
Deploy the service by running the following kubectl commands:
echo “Deploy AKS service”

kubectl apply -f ./aks_bash/tinyrest_service.yml

kubectl get svc
The second command should show the NGINX ingress controller as a LoadBalancer in addition to the service you just added.
Deploy an Ingress Resource with Security Configurations
Create a YAML file for an ingress resource:
apiVersion: networking.k8s.io/v1beta1

kind: Ingress

metadata:

    annotations:

        nginx.ingress.kubernetes.io/auth-tls-verify-client: “on”

        nginx.ingress.kubernetes.io/auth-tls-secret: “default/ingress-secret-dev”

    name: tinyrest-ingress-dev

    namespace: default

spec:

    rules:

    – host: dev.aksingress.com

        http:

        paths:

        – backend:

            serviceName: tinyrest-svc

            servicePort: 8080

            path: /

    tls:

    – hosts:

        – dev.aksingress.com

        secretName: ingress-secret-dev
In this ingress resource, we have specified the following for mTLS authentication:
- The ingress must verify a client cert (server authenticating client);
- Use the Kubernetes secret (named ingress-secret-dev) as the source for server cert, server key and CA cert.
- The hostname specified (dev.aksingress.com in our example) must match the SAN in server cert.
Deploy the ingress resource with rules via the following kubectl commands:
echo “Deploy ingress resource with rules”

kubectl apply -f ./aks_bash/tinyrest_ingress_rules.yml

kubectl get ingress

kubectl describe ingress tinyrest-ingress-dev
Make sure you see a static external IP address after deploying the ingress service. There might be a short delay after running the deploy command before the static IP shows up.
Add A Record to DNS
Now the static IP of the AKS ingress controller is available. You can map it to the domain (dev.aksingress.com ) in your DNS setup.
Testing AKS Configuration for mTLS Authentication
With client cert authentication and CA cert configured in AKS ingress resource, we can test it using curl client.
If you call the ingress without supplying the client cert or client key, you will get the following error
$ curl https://dev.aksingress.com/resource -k
<html> <head><title>400 No required SSL certificate was sent</title></head> <body>
400 Bad Request
No required SSL certificate was sent
nginx/1.19.2</body> </html>
Mutual TLS authentication between AKS and curl client can be achieved by supplying client cert, client key and CA cert, as shown below.
curl –verbose https://dev.aksingress.com/resource –cert “mTLSclient_dev.crt” –key “mTLSclient_dev.key” –cacert “mTLSca.crt”
If our test application returns the incoming headers, it looks like below:
 “request_header”: {

     “host”: “dev.aksingress.com”,

     “ssl-client-verify”: “SUCCESS”,

     “ssl-client-subject-dn”: “C=US,ST=IL,L=Libertyville,OU=CSE,O=Microsoft,emailAddress=acp@microsoft.com,CN=gateway.com”,

     “ssl-client-issuer-dn”: “CN=My Cert Authority”,

     “x-request-id”: “556a994d6f9949eef44189a18294080e”,

     “x-real-ip”: “10.244.0.1”,

     “x-forwarded-for”: “10.244.0.1”,

     “x-forwarded-proto”: “https”,

     “x-forwarded-host”: “dev.aksingress.com”,

     “x-forwarded-port”: “443”,

     “x-scheme”: “https”,

     “user-agent”: “curl/7.68.0”,

     “accept”: “*/*”

 }
In its response, in addition to the correct response from the AKS pods, the following verbose section indicates client authentication of server cert is successful.
 * Server certificate:

 *  subject: CN=dev.aksingress.com; emailAddress=acp@microsoft.com; O=Microsoft; OU=CSE; L=Libertyville; ST=IL; C=US

 *  start date: Sep 29 13:10:18 2020 GMT

 *  expire date: Sep 27 13:10:18 2030 GMT

 *  common name: dev.aksingress.com (matched)

 *  issuer: CN=My Cert Authority

 *  SSL certificate verify ok.
Configuring mTLS in APIM
Details can be found in How to secure back-end services using client certificate authentication in Azure API Management .
End-to-End Test
To perform end-to-end test, we also need to follow the other document to configure OAuth2.
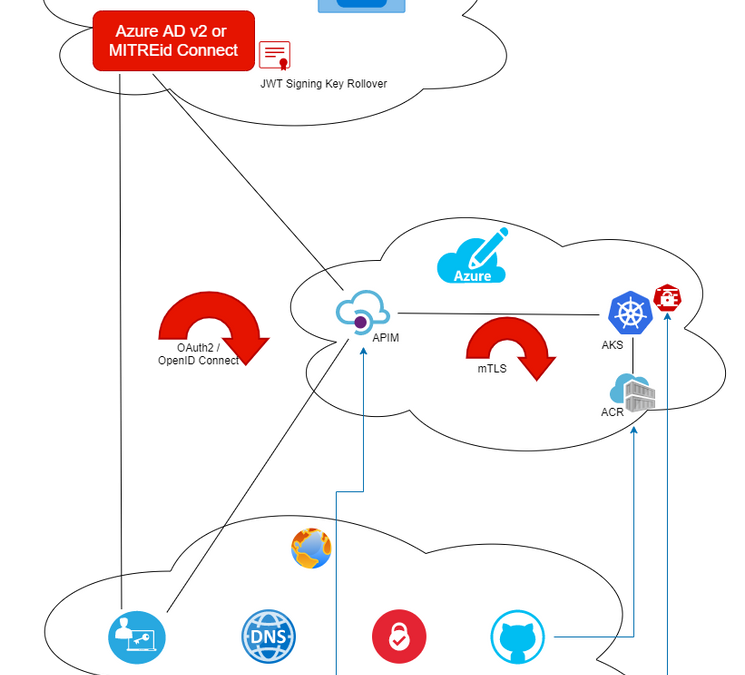
The end-to-end test covers two security loops:
OAuth2, which covers
- client app (either public or private client)
- Identity Provider (any OAuthe2-compliant Identity Provider such as Azure AD or MITREid Connect)
- API gateway (APIM)
mTLS, which covers
- Client (APIM) authenticating server (AKS)
- Server (AKS) authenticating client (APIM)
The end-to-end security can be illustrated by the diagram below.

The OAuth2 Test Tool (http://aka.ms/ott ) can be used for the test.
If your REST API used for test returns the incoming HTTP headers in its response body, the headers in its response should look like below:
“request_header”: {

        “host”: “aksingress.com”,

        “ssl-client-verify”: “SUCCESS”,

        “ssl-client-subject-dn”: “CN=gateway.com”,

        “ssl-client-issuer-dn”: “CN=My Cert Authority”,

        “x-request-id”: “a1e62e86b490b1afc29f5fd3fbfa802c”,

        “x-real-ip”: “10.244.0.1”,

        “x-forwarded-for”: “10.244.0.1”,

        “x-forwarded-proto”: “https”,

        “x-forwarded-host”: “aksingress.com”,

        “x-forwarded-port”: “443”,

        “x-scheme”: “https”,

        “x-original-forwarded-for”: “67.186.69.18”,

        “x-correlation-id”: “23a8237a-d16b-4471-8c19-058717c982cf”,

        “origin”: “https://npmwebapp.azurewebsites.net”,

        “sec-fetch-site”: “cross-site”,

        “sec-fetch-mode”: “cors”,

        “sec-fetch-dest”: “empty”,

        “content-type”: “application/json”,

        “accept”: “*/*”,

        “accept-encoding”: “gzip,deflate,br”,

        “accept-language”: “en-US,en;q=0.9”,

        “authorization”: “Bearer [token]”,

        “referer”: “https://npmwebapp.azurewebsites.net/”,

        “user-agent”: “Mozilla/5.0 (Windows NT 10.0; Win64; x64) AppleWebKit/537.36 (KHTML, like Gecko) Chrome/85.0.4183.121 Safari/537.36”

    }
The first half indicates client (APIM) has successfully authenticated the server (AKS) cert and forwarded the request to the server (aksingress.com ), which performs its own authentication of the client. The second half shows the JWT used for OAuth2 authorization. The sec-fetch-* headers indicate this is a CORS call and preflight is required (client domain: npmwebapp.azurewebsites.net , API gateway domain: [apim-svc-name].azure-api.net). The client cert CN (in our case aksingress.com) is different from APIM FQDN.
Troubleshooting
Log of NGINX Ingress Controller
Reading the log of the NGINX ingress controller is an effective way to troubleshoot. You can retrieve the ingress controller log via the following kubectl commands:
# get the name of NGINX ingress controller

kubectl get pods -n default | grep nginx-ingress

# get the log for the NGINX ingress controller

kubectl logs -n default nginx-ingress-ingress-nginx-controller-7cb87487f5-jg8xw
Below is a sample error entry in such log:
W0923 16:30:28.571719 6 controller.go:1146] Unexpected error validating SSL certificate “default/ingress-secret” for server “aksingress.com”: x509: certificate relies on legacy Common Name field, use SANs or temporarily enable Common Name matching with GODEBUG=x509ignoreCN=0
while a successful request can look like below:
10.244.0.1 – – [23/Sep/2020:22:30:38 +0000] “GET /resource HTTP/2.0” 200 459 “-” “curl/7.68.0” 38 0.002 [default-tinyrest-svc-8080] [] 10.244.0.13:3000 459 0.000

200 69ad615ba1e85defdaba5a0ba57529df
Ingress Resource Setup
Another thing to check is the ingress resource setup:
$ kubectl describe ingress tinyrest-ingress-dev

Name:             tinyrest-ingress-dev

Namespace:        default

Address:          52.154.41.113

Default backend:  default-http-backend:80 (<error: endpoints “default-http-backend” not found>)

TLS:

ingress-secret-dev terminates dev.aksingress.com

Rules:

Host                Path  Backends

—-                —-  ——–

dev.aksingress.com

                    /   tinyrest-svc:8080 (10.244.0.13:3000)

Annotations:          nginx.ingress.kubernetes.io/auth-tls-secret: default/ingress-secret-dev

                    nginx.ingress.kubernetes.io/auth-tls-verify-client: on

Events:               <none>
Notice that since we have configured nginx.ingress.kubernetes.io/auth-tls-verify-client: on, the error endpoints “default-http-backend” not found is expected.
Missing Client Cert for Server Authentication of Client
If error indicates missing client cert, please check the API inbound policy in APIM. In order for APIM to supply client cert to AKS ingress resource for authenticating the client, the inbound processing policy must contain the following node
<authentication-certificate thumbprint=”05F6B958079A4FC88978946FB3DA65B37F0F9E4E” />
Make sure the thumbprint matches with the thumbprint of the client cert you installed on APIM.
Ingress Secret Cannot be Found
Check the YAML file for the ingress resource to make sure the secret name and namespace are correct. You can use kubectl to describe the Kubernetes secret and should see the following three certs/key:
$ kubectl describe secret ingress-secret-dev

Name:         ingress-secret

Namespace:    default

Labels:       <none>

Annotations:  <none>
Type:  Opaque
Data

====

tls.crt:  1675 bytes

tls.key:  3272 bytes

ca.crt:   1809 bytes
by Contributed | Oct 26, 2020 | Technology
This article is contributed. See the original author and article here.
Initial Update: Monday, 26 October 2020 14:02 UTC
We are aware of issues within Log Analytics and are actively investigating. Some customers may experience data access issues in azure portal and also issues with missed or delayed Log Search alerts in East US2 region.
- Work Around: None
- Next Update: Before 10/26 16:30 UTC
We are working hard to resolve this issue and apologize for any inconvenience.
-Vamshi
by Contributed | Oct 26, 2020 | Technology
This article is contributed. See the original author and article here.
A common question we get from organizations that use Microsoft Information Protection is, how can we receive a single pane of glass across not only DLP and other information protection events but correlate with the entire IT estate? How can I effectively use the richness of data for incident management and reporting?
In this post we will focus on how this can be achieved with Azure Sentinel, by utilizing a custom Azure Function for ingestion. Let’s start with a few teasers.
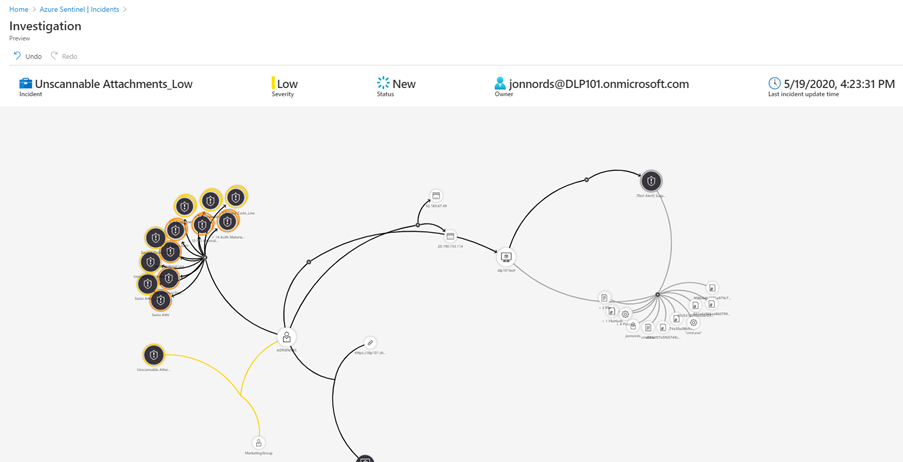
Below is a sample where an Office DLP incident is connected with other incidents as well as the Microsoft Defender for Endpoint alerts from the device. Over time this native Azure Sentinel feature will evolve to support more entities for automated correlation.

This is a Workbook sample of reporting of DLP incidents across departments and geography.

In this GRAPH sample using an Workbook, we have selected a document node (Darkness), which expands a table with SharePoint DLP alerts as well as SharePoint Activity for that document to instantly go deeper in the investigation.

The code and instructions for ingestion of Endpoint and Office DLP events can be found here, https://github.com/OfficeDev/O365-ActivityFeed-AzureFunction/tree/master/Sentinel/EndPointDLP_preview (Although the naming is endpoint it includes both Office and Endpoint data). Please note that the code for endpoint will change as soon as the endpoint DLP events are included in dlp.all.
- Register a new application in Azure AD https://docs.microsoft.com/en-us/azure/active-directory/develop/quickstart-register-app
- Microsoft GRAPH (Application permissions)
- Group.Read.All
- User.Read.All
- Office 365 Management APIs (Application permissions)
- ActivityFeed.Read
- ActivityFeed.ReadDlp (Needed for detailed DLP events)

- Collect the identity and secret for the new App created in step 1. For production, store the secret in Azure Key vault https://docs.microsoft.com/en-us/azure/app-service/app-service-key-vault-references, generate the keys now delegate access to the function in step 7.
- clientID
- clientSecret
- TenantGuid
- exuser (User account to allow for mapping to sensitive info types, it should only have the permissions to run Get-DlpSensitiveInformationType)
- Azure Sentinel Workspace Name
- Get the WorkSpace ID and Workspace Key for your Sentinel Workspace.
- Select the workspace from the Log Analytics workspaces menu in the Azure portal. Then select Agents management in the Settings section.

- Click deploy to Azure in the repo https://github.com/OfficeDev/O365-ActivityFeed-AzureFunction/tree/master/Sentinel/EndPointDLP_preview

- Provide the parameters needed for the function.
- SPUS is only used if you are going to deploy ingestion of emails to SharePoint to be able to retrieve a full copy of the emails from the incidents.

- Click Review and create
- Click Create, if all parameters passed
- The Deployment will start

- On completion it is likely that several of the functions will have an error. The actual function code is deployed in the next step so the errors are expected.

- Go to the Resource Group where you deployed the app, you will see the core services deployed. Click the Function App, we will come back here in a moment

- To enable the app to automatically synch DLP policies to Sentinel run the following commands it will allow the APP to fully manage Sentinel. You need to define the RG where the Log Analytics database is hosted for Sentinel.
- Start Powershell and ensure that the Az module is installed.
- $id = (Get-AzADServicePrincipal -DisplayNameBeginsWith YourAPP).id
- New-AzRoleAssignment -ResourceGroupName YOURRGWITHSENTINEL -RoleDefinitionName “Azure Sentinel Contributor” -ObjectId $id
- You can use the UI as well under Identity of the function, this process can also be used granting access to your key vault on completion of the setup of the function.

- Deploy the code used for the functions.
- Download the deployment zip (endpointdlpservice.zip )
- Start Powershell and ensure that the Az module is installed.
- Connect-AzAccount
- Run Publish-AzWebApp -ResourceGroupName REPLACEWITHYOURRG -Name REPLACEWITHYOURAPPNAME -ArchivePath C:pathenpointdlpservice.zip

- To initialize the variables in the app
- Navigate to the Enablement function in your Function App

- open the function under functions, open “Code + Test” , click Test/Run, click Run

- Note if there are any errors generated in this run, you will see it in the logging window. If there is a typo or similar in your configuration files. Go back to the main window for the App and click Configuration to update the parameter

- Note, the Analytic Rules functions will not be successful until you have ingested both SharePoint, Exchange events and in the case of Endpoint you need Endpoint events.
- The API actively refuses queries that are in-valid.
- If the Log Analytic rules that corresponds to DLP Policies aren’t created after data ingestion, run the Enablement function again. It will reset the time scope of the functions.
- If you want to ingest original email content to SharePoint please see https://github.com/OfficeDev/O365-ActivityFeed-AzureFunction/tree/master/Sentinel/logicapp.
- To setup the reporting please follow
- If you want to try out ingestion of documents from endpoints look at this https://github.com/OfficeDev/O365-ActivityFeed-AzureFunction/tree/master/Sentinel/EndPointDLP_preview/DocumentCopy
- In the repo see the “Important Additional Customization”
Summary
This is just a starting point to get DLP incident data in to Azure Sentinel. There is enrichment code to add details from Microsoft GRAPH that can be customized. You can customize the code to send events to different Azure Sentinel Workspaces based on geography and other details. In Azure Sentinel you can start to create automated actions using Playbooks, you can create your own Kusto queries to receive new insights. More on that in a later post. And yes, we are investigating the option to provide native integration with Azure Sentinel as well.
by Contributed | Oct 26, 2020 | Technology
This article is contributed. See the original author and article here.
Again quick post about error and mitigation.
So as it is publicly documented ( today, Oct – 2020) managed identities are not currently supported on the SQL Pools under Synapse workspace. I mentioned the date, because this may change. But so far that is the current scenario.
So suppose you are using the ADF pipeline ( in or out Synapse workspace) but you are connecting to a SQL Pool under synapse workspace.
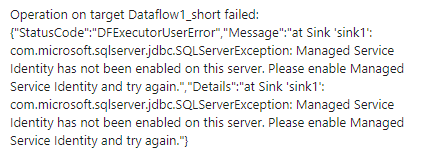
You may hit this issue:
Managed Service Identity has not been enabled on this server.
Or full error message:

This limitation is documented under the following links:
https://docs.microsoft.com/en-us/answers/questions/58750/data-flow-error-in-azure-synapse-analytics-workspa.html
Are there any limitations with COPY using Synapse workspaces (preview)?
Authenticating using Managed Identity (MSI) is not supported with the COPY statement or PolyBase (including when used in pipelines). You may run into a similiar error message:
com.microsoft.sqlserver.jdbc.SQLServerException: Managed Service Identity has not been enabled on this server. Please enable Managed Service Identity and try again.
https://docs.microsoft.com/en-us/sql/t-sql/statements/copy-into-transact-sql?view=azure-sqldw-latest
So here is your scenario: You configured SQL Server user to connect to the database trying to avoid the managed identity problem but still if you enable sink stagging it hits this problem. If you do not enable the sinking stage as you have a large number of rows to load it will take a long time to run because the insert will be executed row by row.
Here is the reason:
Staged copy by using PolyBase: To use this feature, create an Azure Blob Storage linked service or Azure Data Lake Storage Gen2 linked service with account key or managed identity authentication that refers to the Azure storage account as the interim storage.
https://docs.microsoft.com/en-us/azure/data-factory/connector-azure-sql-data-warehouse
Workaround:
- Change the authentication method of the staging store linked service to key or service principal auth. The point is avoiding the managed identities but still enable the sinking stage.
Step by Step:
Success Scenario
This the storage account configuration with the account key. Further, I will enable the Sink stage using this storage account which is also the source of my data.


And………. it Worked:

Failure configuration :
Here the storage account is using managed identity authentication.

Once I try to run it failed as it follows:

Thanks to the case collaboration of ADF team Yassine Mzoughi, Darius Ciubotariu and Synapse team Jackie Huang and Olga Guzheva.
That is it!
Liliam C Leme
UK engineer.
by Contributed | Oct 26, 2020 | Technology
This article is contributed. See the original author and article here.
Tom McElroy, Pete Bryan – Microsoft Threat Intelligence Center
Pete Bryan posted a blog in March detailing how to protect Microsoft Teams with Azure Sentinel. Since then a new Teams connector has entered public preview, this allows Teams data to be accessed without the need for a custom log. Using the official connector means you will be able to take advantage of new Teams log events as they become available. More information on setting the connector up can he found here. Teams logs are provided by the Office 365 connector as part of Office Activity logging so will not incur additional costs to ingest if Office Activity logs are already being ingested.
This blog post will cover how Teams logs can be expanded to provide deeper security insight by mapping additional data from other tables available in Azure Sentinel, the topics covered are:
- Extracting Teams file sharing information
- Mapping Teams logs to Teams call records
- Merging Teams logs with sign in activity to detect anomalous actions
Exploring Teams File Sharing
Teams allows users to share files in conversations, this feature is commonly used to share meeting notes, agendas or documents when collaborating on a piece of work.
When sharing a file on Teams it uses underlying Office technology to upload the file to the users OneDrive, it then shares the file using existing SharePoint operations. While file sharing information is not available in the local Teams Log, it can be extracted from the Office Activity log.
Teams file uploads are recorded in the Office activity log as SharePoint file operations. To distinguish Teams file uploads from other services the column “SourceRelativeURL” is populated with the entry “Microsoft Teams Chat Files”. The query below will extract Teams file uploads from the Office Activity log.
OfficeActivity
| where RecordType =~ "SharePointFileOperation"
| where UserId !~ "app@sharepoint"
| where SourceRelativeUrl has "Microsoft Teams Chat Files"
| where Operation =~ "FileUploaded"
| project TimeGenerated, UserId, ClientIP, Site_Url, OfficeObjectId, SourceFileName, SourceFileExtension
The query can now be expanded to find suspiciously named files. Either a list of potentially suspicious filenames can be provided, or an external data source can be used. In the below query, matching is being performed to detect users sharing passwords or files containing a confidential term. A list of terms can be passed in using a list, in the example below the list is called “suspiciousFilenames”.
let suspiciousFilenames = dynamic(['password', 'admin', 'confidential_term']);
OfficeActivity
| where RecordType =~ "SharePointFileOperation"
| where UserId !~ "app@sharepoint"
| where SourceRelativeUrl has "Microsoft Teams Chat Files"
| where Operation =~ "FileUploaded"
| project TimeGenerated, UserId, ClientIP, Site_Url, OfficeObjectId, SourceFileName, SourceFileExtension
| where SourceFileName has_any(suspiciousFilenames)
This query can be modified to search for suspicious file extensions instead, the query below will show common Windows executable files being shared through Teams.
let suspiciousExtensions = dynamic(['exe', 'msi', 'bin', 'dll']);
OfficeActivity
| where RecordType =~ "SharePointFileOperation"
| where UserId !~ "app@sharepoint"
| where SourceRelativeUrl has "Microsoft Teams Chat Files"
| where Operation =~ "FileUploaded"
| project TimeGenerated, UserId, ClientIP, Site_Url, OfficeObjectId, SourceFileName, SourceFileExtension
| where SourceFileExtension has_any(suspiciousExtensions)
Joining either of the above queries back to the Office activity log allows the query to extract how many users received the file and how many users opened the file, with counts for each. In the below example the suspicious file name query has been expanded to collect the additional user information.
let suspiciousFilenames = dynamic(['password', 'admin', 'confidential_term']);
OfficeActivity
//Get teams files where the file is being uploaded, teams uses SharePoint and OneDrive for file sharing
| where RecordType =~ "SharePointFileOperation"
| where SourceRelativeUrl contains "Microsoft Teams Chat Files"
| where Operation =~ "FileUploaded"
//Check for a suspicious file name, comment out to see all files
| where SourceFileName has suspiciousFilenames
| summarize by TimeGenerated, OfficeObjectId, UserId, ClientIP, SourceFileName
//Count how many users it was shared to, we can't get who it was shared to here
| join kind=leftouter (
OfficeActivity
//When sending a file in teams a new sharepoint sharing operation event is generated, teams shares the file with all the users in a chat
| where RecordType =~ "SharePointSharingOperation"
| where Operation =~ "SharingSet"
| where SourceRelativeUrl has "Microsoft Teams Chat Files"
| where UserId !~ "app@sharepoint"
//OfficeId is a unique GUID for office operations, counting this provides the number of share events teams generated
| summarize dcount(OfficeId), SentTo=make_list(UserId) by OfficeObjectId
) on OfficeObjectId
| project-away OfficeObjectId1
//Join data that shows who accessed the file
| join kind=leftouter (
OfficeActivity
//Again, teams generated sharepoint events for users downloading or accessing the file
| where RecordType =~ "SharePointFileOperation"
| where Operation =~ "FileDownloaded" or Operation == "FileAccessed"
| where UserId !~ "app@sharepoint"
| extend userBag = pack(tostring(TimeGenerated), UserId)
| summarize make_bag(userBag), dcount(UserId) by OfficeObjectId
) on OfficeObjectId
| project TimeGenerated, SourceFileName, Uploader=UserId, UploaderIP=ClientIP, UsersSentCount=dcount_OfficeId, UsersOpenedCount=dcount_UserId, AccessedBy=bag_userBag, SentTo, OfficeObjectId
While the above examples use a fixed list of suspicious filenames for matching, the Kusto external data operator can be used to import a list of known-bad filenames.
Matching malicious filenames is often unreliable as attackers will name files to blend in with their target environment, however, this query could be used situationally in a response scenario to search of malicious documents that may have been passed between users. While uncommon, attacker spear phishing lures can prove so interesting that users share the lure beyond the initial recipient.
Mapping Teams log to Teams Call Records
As well as providing key administrative and user activity logs via the new Teams connector we can also access specific call record logs. These logs provide details about calls and meetings made via Teams, and provide details about who organized them, who participated, and what technologies were used. These logs need to be collected separately from the main Teams logs collected by the connector, for more details about how to enable collection of these events, please refer to this blog.
Once we have the call logs available to us, we can use our existing Teams queries to pivot from a user and identify what calls they have been present in. Below is an example of taking one of the suspicious file upload queries above and pivoting to see the call attendance of the user who originally shared the file. This is a good way to identify the scope of an incident and other impacted users.
let suspiciousFilenames = dynamic(['password', 'admin', 'confidential_term']);
OfficeActivity
//Get teams files where the file is being uploaded, teams uses SharePoint and OneDrive for file sharing
| where RecordType =~ "SharePointFileOperation"
| where SourceRelativeUrl contains "Microsoft Teams Chat Files"
| where Operation =~ "FileUploaded"
//Check for a suspicious file name, comment out to see all files
| where SourceFileName contains suspiciousFilenames
| summarize by TimeGenerated, OfficeObjectId, UserId, ClientIP, SourceFileName
//Count how many users it was shared to, we can't get who it was shared to here
| join kind=leftouter (
OfficeActivity
//When sending a file in teams a new sharepoint sharing operation event is generated, teams shares the file with all the users in a chat
| where RecordType =~ "SharePointSharingOperation"
| where Operation =~ "SharingSet"
| where SourceRelativeUrl contains "Microsoft Teams Chat Files"
| where UserId !~ "app@sharepoint"
//OfficeId is a unique GUID for office operations, counting this provides the number of share events teams generated
| summarize dcount(OfficeId), SentTo=make_list(UserId) by OfficeObjectId
) on OfficeObjectId
| project-away OfficeObjectId1
//Join data that shows who accessed the file
| join kind=leftouter (
OfficeActivity
//Again, teams generated sharepoint events for users downloading or accessing the file
| where RecordType =~ "SharePointFileOperation"
| where Operation =~ "FileDownloaded" or Operation == "FileAccessed"
| where UserId !~ "app@sharepoint"
| extend userBag = pack(tostring(TimeGenerated), UserId)
| summarize make_bag(userBag), dcount(UserId) by OfficeObjectId
) on OfficeObjectId
| project TimeGenerated, SourceFileName, Uploader=UserId, UploaderIP=ClientIP, UsersSentCount=dcount_OfficeId, UsersOpenedCount=dcount_UserId, AccessedBy=bag_userBag, SentTo, OfficeObjectId
// We need to join these logs to AAD SigninEvents to get the AADUserID we need to the Teams call logs
| join (SigninLogs
| project UserPrincipalName, AADUserId = UserId)
on $left.Uploader =~ $right.UserPrincipalName
//We can now join this to our Teams call logs to get details of all the calls that the user who uploaded the file has participated in
| join (TeamsCallLogs_CL
| mv-expand todynamic(participants_s)
| extend AADUserId = tostring(participants_s.user.id))
on AADUserId
// To make the ouput a bit cleaner we can pack our meeting events into a single object.
| extend Meetings = pack("MeetingId", id_g, "Type", type_s, "Participants", participants_s, "StartTime", startDateTime_t, "EndTime", endDateTime_t, "Organizer", organizer_user_displayName_s)
| summarize make_list(Meetings) by SourceFileName, UsersOpenedCount, Uploader
| extend meeting_count=array_length(list_Meetings)
Note: In the query above we are presuming that the custom table name used to ingest the Teams call logs is “TeamsCallLogs_CL”. If your configuration is different you will need to edit the query above to reflect that.
Finding Anomalous Teams Logins
Common techniques to identify anomalous sign in activity include analysing the login locations for suspicious countries, searching for IP subnets that are not used commonly, and looking for multiple failed accesses followed by a successful login to detect brute force activity. These techniques are effective at identifying potentially suspicious activity but can generate high false positive rates. With more users working from home, some of these techniques have become impractical given the network diversity when users connect from home offices.
With additional information from other log sources it is possible to improve confidence in the detections. Anomalous login techniques can be corelated with log data from applications to determine if an administrative action was performed during a time window after a successful anomalous login has occurred. The new Teams connector provides logging of Teams events, including administrative events, which can be used to detect potentially suspicious Teams activity taking place.
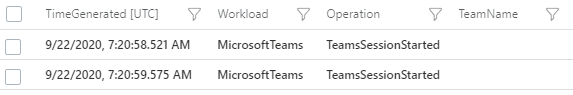
Certain actions in Teams will result in a log entry, this ranges from a Teams session starting to administrative actions e.g. deleting a team. This information is logged to the “Operation” column of the Teams log. As seen in the image below the most common event “TeamsSessionStarted” is shown.

There are a number of operations within the Teams log that can be considered administrative, and a subset of those have potential application in a threat actors campaign, in this example the following actions will be used as indicators of of potentially suspicious activity:
OfficeActivity
| where OfficeWorkload =~ "MicrosoftTeams"
| where Operation in~ ("TeamsAdminAction", "MemberAdded", "MemberRemoved", "MemberRoleChanged", "AppInstalled", "BotAddedToTeam")
A TeamsAdminAction operation is logged when a team administrative action is performed, this covers a wide range of administrative actions that can be performed by an account with an administrator role, a full list of action can be found here. Many of these actions would be useful to an attacker, allowing management of meetings, call policies, viewing user profiles and accessing monitoring and reporting from Teams.
MemberAdded and MemberRemoved operations can be performed by any Teams user that is an administrator of a Team. These events are generated when a member is added to or removed from a Team. After compromising a legitimate account, a malicious actor may attempt to add their own account to meetings that they wish to eavesdrop on, the actor may remove that same member after data has been collected from the Team. Generally, these events are quite common, but when following an anomalous login, they should be treated as suspicious.
The AppInstalled and BotAddedToTeam log events are generated when an app or bot is installed into Teams. An attacker could use this to install malicious Teams addons or bots using the custom app upload feature. Apps and bots are installed on a per-user basis, but can be added to a Team by a user.
Now that potentially suspicious operations within Teams are identified, a query can be constructed that enriches the sign in log data with Teams data to find anomalous logins that were followed by an administrative action.
The query below first collects successful logins to Teams from sign in logs, it then calculates the delta for each user of the IP addresses used to login. Calculating the delta between the least used IP and the most used IP for each user will find accounts where an IP has been used to login only a handful of times vs. the user’s normal login activity. As no fixed values are used this also means that the detection will scale based on the user’s activity level. It will also adapt to activity where the user is roaming on a home connection. Even on internet service providers with dynamic IP addresses, the lease time will be long enough to evenly spread IP usage.
The example below shows a standalone calculation of the delta between IP’s used to login to accounts in sign in logs, followed by the output from Azure Sentinel.
let timeRange = 30d;
//The delta (%) between the largest in-use IP and the smallest [default: 90]
let deltaThreshold = 95;
//Get Teams successful signins globally
SigninLogs
| where TimeGenerated >= ago(timeRange)
| where AppDisplayName has "Teams"
| where ConditionalAccessStatus =~ "success"
| extend country = tostring(LocationDetails['countryOrRegion'])
| where isnotempty(country) and isnotempty(IPAddress)
//Count logins for each IP address used by each user, take one example of geolocation
| summarize count(), country=any(country), make_list(TimeGenerated) by IPAddress, UserPrincipalName
//Pack IP and count then summarize all IP events for each user
| extend p = pack(IPAddress, count_)
| summarize max(count_), min(count_), make_bag(p) by UserPrincipalName
//Calculate delta and convert to percentage
| extend delta = toreal(max_count_ - min_count_) / max_count_ * 100
| where delta >= deltaThreshold;

The delta calculation alone may still produce false positives but can be further improved upon. The next two checks will use country-based analytics, they are optional and will need customisation based on environment. With all queries a point is reached where additional checks may begin to increase the false negative rate, so customization on a per-environment basis is often needed. In this instance the objective is a low noise detection quality query.
First, the number of distinct countries each user has logged in from is calculated, a threshold called “minimumCountries” is set to 2 by default meaning the user must have logged in from two distinct countries. Once users that have accessed their account for at least 2 countries have been identified the prevalence of each country used to login is calculated, only countries that appear less than 10% in sign in logs are identified.
The query below expands the original delta query to include the country checks.
//The bigger the window the better the data sample size, as we use IP prevalence, more sample data is better
let timeRange = 30d;
//The minimum number of countries that the account has been accessed from [default: 2]
let minimumCountries = 2;
//The delta (%) between the largest in-use IP and the smallest [default: 90]
let deltaThreshold = 95;
//The maximum (%) threshold that the country appears in login data [default: 10]
let countryPrevalenceThreshold = 10;
//The time to project forward after the last login activity [default: 60min]
let projectedEndTime = 60min;
//Get Teams successful signins globally
let signinData =
  SigninLogs
  | where TimeGenerated >= ago(timeRange)
  | where AppDisplayName has "Teams"
  | where ConditionalAccessStatus =~ "success"
  | extend country = tostring(LocationDetails['countryOrRegion'])
  | where isnotempty(country) and isnotempty(IPAddress);
// Collect successful signins to teams
let loginEvents =
  signinData
  | summarize count(), country=any(country), make_list(TimeGenerated) by IPAddress, UserPrincipalName;
//Calcualte delta between logins
let loginDelta =
  loginEvents
  | summarize max(count_), min(count_) by UserPrincipalName
  | extend delta = toreal(max_count_ - min_count_) / max_count_ * 100
  | where delta >= deltaThreshold;
//Count number of countries used to sign in
let countryCount =
  loginEvents
  | summarize Countries = dcount(country) by UserPrincipalName;
//Join delta and sign in counts to successful logins
loginDelta
| join kind=rightouter  (
  loginEvents
) on UserPrincipalName
//Join the count of countries to the login records
| join kind=rightouter (
  countryCount
) on UserPrincipalName
//Check where the record meets the minimum required countries as an early defeat
| where Countries >= minimumCountries
//Join the count of each country
| join kind=leftouter (
      signinData
      | summarize count() by country
      //Now get the total number of logins from any country and join it to the previous count in a single table
      | join (
          signinData
          | summarize count() by country
          | summarize sum(count_), make_list(country)
          | mv-expand list_country
          | extend country = tostring(list_country)
      ) on country
      | summarize by country, count_, sum_count_
      //Now calculate each countries prevalence within login events
      | extend prevalence = toreal(count_) / toreal(sum_count_) * 100
      | project-away sum_count_
      | order by prevalence
) on country
//The % that suspicious country is prevalent in data, this can be configured, less than 10% is uncommon
| where prevalence < countryPrevalenceThreshold
| where min_count_ =~ count_
| project UserPrincipalName, SuspiciousIP = IPAddress, UserIPDelta = delta, SuspiciousLoginCountry = country, SuspiciousCountryPrevalence = prevalence, EventTimes = list_TimeGenerated
Executing the above query will provide a list of accounts where a suspicious login has occurred, it will also provide the times those suspicious logins occurred. At this point the above query can be used as a hunting query to identify suspicious activity, but it may produce false positives.

Now candidate suspicious logins have been identified, a join can be performed on the Teams log data using the users email address. A time window join allows the query to determine if a Teams admin action was performed within a specified window. In the default query this will detect admin actions up to 1 hour after the successful login. The below query will perform the final join.
//Teams join to collect operations the user account has performed within the given time range
| join kind=inner(
  OfficeActivity
  | where OfficeWorkload =~ "MicrosoftTeams"
  | where TimeGenerated >= ago(timeRange)
  | where Operation in~ ("TeamsAdminAction", "MemberAdded", "MemberRemoved", "MemberRoleChanged", "AppInstalled", "BotAddedToTeam")
  | project Operation, UserId=tolower(UserId), OperationTime=TimeGenerated
) on $left.UserPrincipalName =~ $right.UserId
| mv-expand StartTime = EventTimes
| extend StartTime = make_datetime(StartTime)
//The end time is projected 60 minutes forward, in case actions took place within the last hour of the final login for the suspicious IP
| extend ProjectedEndTime = make_datetime(StartTime + projectedEndTime)
//Limit to operations carried out by the user account in the timeframe the IP was active
| where OperationTime between (StartTime .. ProjectedEndTime)
| project UserPrincipalName, SuspiciousIP, StartTime, ProjectedEndTime, OperationTime, Operation, SuspiciousLoginCountry, SuspiciousCountryPrevalence
//Filter on suspicious actions
| extend activitySummary = pack(tostring(StartTime), pack("Operation",tostring(Operation), "OperationTime", OperationTime))
| summarize make_bag(activitySummary) by UserPrincipalName, SuspiciousIP, SuspiciousLoginCountry, SuspiciousCountryPrevalence
| extend IPCustomEntity = SuspiciousIP, AccountCustomEntity = UserPrincipalName
With the above queries combined the false positive rate will be reduced significantly allowing this query to be used as a detection. This detection is already published to the Azure Sentinel GitHub and can be found here.
While this example uses Teams data, it is possible to apply the same logic to any sign in anomaly query where the application or service provides logging of administrative activity.
In Conclusion
The blog has shown how to use additional data sources to enhance threat hunting in Azure Sentinel for threats within Microsoft Teams.
Extracting additional information from OfficeActivity logs allowed identification of potentially suspicious files being shared on Teams. The blog also showed how call records can be extracted and used to further expand visibility of Teams activity. Knowledge of where file sharing and call records are stored provides a starting point to developing queries to answer specific questions about user account activity.
As an example of how merging multiple data sources can lead to higher quality detections in Teams, the blog looked at how merging signing logs data with Teams activity enables the creation of a high-quality, low false positive detections. These principles can be applied in other scenarios where a high false-positive anomaly query can be combined with a suspicious behaviour.
If you’d like to know more about the Teams schema in Azure Sentinel this blog post contains information on the types of Teams operations you may see.
If you have questions or specific scenarios you would like to share, please leave a comment or reach out.
by Contributed | Oct 26, 2020 | Technology
This article is contributed. See the original author and article here.
How do you monitor when a resource is unavailable? There are many tools and products that will do this, often with integrations into ticketing systems or alerting methods. Let’s look at virtual machines and get the to post a message into Microsoft Teams.
Instead of us having to define what a resource looks like when it is unavailable (what metrics, log events or network responses would occur), we’re going to use Azure Resource Health.
Azure Resource Health captures events whether they are related to the platform (such as a problem with VMs in an affected region of an Azure incident) or if they are user initiated (like a shut down request being initiated by a person, even if that’s from inside the virtual machine’s operating system and not via any action through the Azure Resource Manager).
It relies on signals from different Azure services to assess whether a resource is healthy (available) or not. The exact checks and signals depend on what the resource type is and not all resource types are supported. For a full list including the checks, visit Resource health types and checks.
So, if Resource Health is going to fire an event if a virtual machine is down, let’s capture that and post the details into a message in a Microsoft Teams channel.
In essence, we’re generating a monitoring alert from a Resource Health event, then sending that to an action group which calls a Logic App. The Logic App receives the alert as an http message, and posts the relevant data as a Teams message.
Step 1: Create the Logic App
Hold up, I thought we were going to create a monitoring alert? Well we are, but setting up the logic app first makes the rest of the process a little easier.
– In Logic Apps via the Azure Portal, create a new Logic App and choose a resource group to put it in and give the Logic App a name.
– Select the location as Region and choose your region to store it. You can keep Log Analytics off.
– Once it has been created, go to the new logic app resource – you should be presented with the Logic Apps Designer.
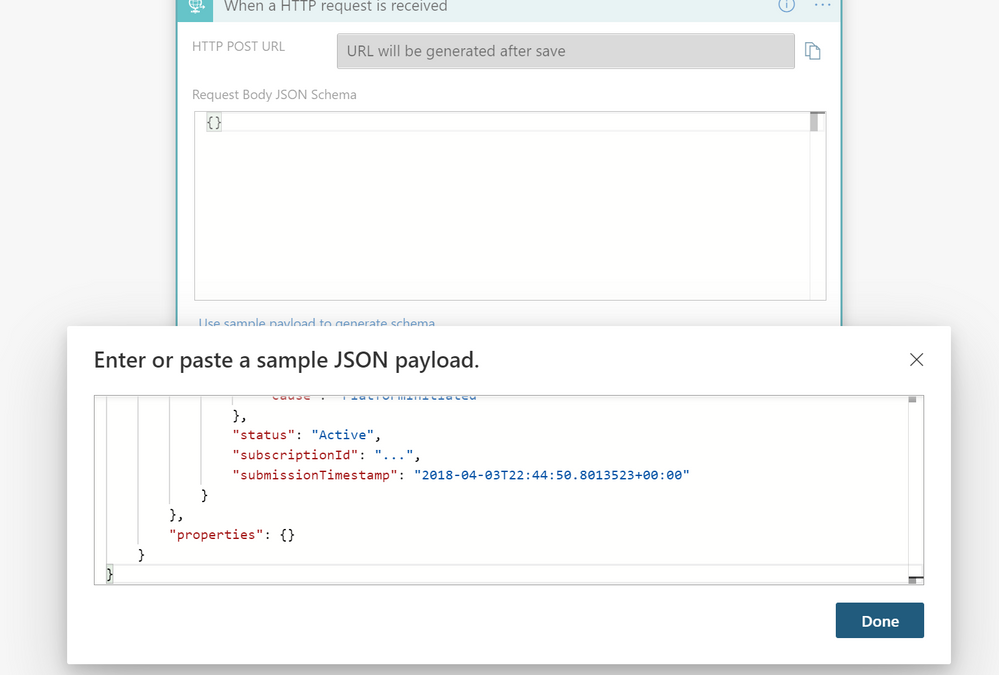
– We want to select the trigger “When a HTTP request is received”
– Now we’ll provide a sample of what data is in a resource health alert. Click Use sample payload to generate schema, paste the following JSON, then click Done:
{
    "schemaId": "Microsoft.Insights/activityLogs",
    "data": {
        "status": "Activated",
        "context": {
            "activityLog": {
                "channels": "Admin",
                "correlationId": "7055f77b-bf9a-4c10-8985-12db6d9a3ddc",
                "description": "…",
                "eventSource": "ResourceHealth",
                "eventTimestamp": "2018-04-03T22:44:43.7467716+00:00",
                "eventDataId": "fedb3ebe-b6af-4920-adb7-10d43514db0f",
                "level": "Critical",
                "operationName": "Microsoft.Resourcehealth/healthevent/Activated/action",
                "operationId": "e416ed3c-8874-4ec8-bc6b-54e3c92a24d4",
                "properties": {
                    "title": "...",
                    "details": "...",
                    "currentHealthStatus": "Degraded",
                    "previousHealthStatus": "Available",
                    "type": "Downtime",
                    "cause": "PlatformInitiated"
                },
                "status": "Active",
                "subscriptionId": "...",
                "submissionTimestamp": "2018-04-03T22:44:50.8013523+00:00"
            }
        },
        "properties": {}
    }
}

– Logic Apps will remind you that you need a Content-Type header set to application/json in your request. You can select tick Got it, as the Resource Health alert includes this.
– Then we can add the “post to Teams” step. Click + New step and type Microsoft Teams in the search bar, then click the Microsoft Teams icon. Scroll down in the Actions tab and select Post a message (V3) (preview):

Note: As this article ages and the products update, that exact action name may differ, but you’re still going to want to look for a Microsoft Teams action that posts a message.
– Click into the Team and Channel fields respectively to choose the Team and Channel you want to post to.
– Then click in the Message field. Here we can play with the “dynamic content” so each posted message contains details about the event that fired it.
Dynamic content picks up the parameters in the sample data we provided, that the alert would generate. My sample message looks like this:
ALERT: ‘eventSource’
The resource ‘resourceId’.
is currently ‘currentHealthStatus’
This was ’cause’
Event timestamp: ‘eventTimestamp’
You need to use the Dynamic content picker and search to find and select each of the elements above in the ‘ ‘ marks, so it looks more like this:

And when it posts, the resulting Teams message looks like this:
ALERT: ResourceHealth
The resource /subscriptions/redactednumber/resourceGroups/rgname/providers/Microsoft.Compute/virtualMachines/VMname.
is currently Unavailable
This was UserInitiated
Event timestamp: 2020-10-26T06:47:36.6975752+00:00
With the Expressions in logic app, you could get a little fancier by shrinking the resource name to just the VM name, or changing the event timestamp to display in your preferred timezone.
– Click Save and your logic app is done!
Step 2: Create the Resource Health alert
You’ll find Resource health in the Service health blade of the Azure portal, or in the Support + troubleshooting section of a supported resource. Note: this one is a little tricky as you don’t go to Azure Monitor to create it.

– Click + Add resource health alert.
If I access this from a virtual machine’s resource page, the alert rule will automatically populate the subscription, resource type, resource group and resource name, based on the VM that was your entry point.
TIP: You can adjust any of these to include groups of resources and even resources of different types, and you can set it to automatically apply to any newly-created resources.
– Set the alert condition:
Event status: select Active, In Progress and Updated
Current resource status: select Degraded, Unavailable and Unknown
Previous resource status: select all
Reason type: select Platform Initiated and User Initiated
That’s how I configured my example, but this is where your monitoring logic needs come in. Maybe you only want this to alert on platform initiated events, so you can triage Azure service issues differently from human generated ones?
– Set the action group by clicking select action group and then + Create action group to make a new one.
– Choose a subscription and resource group, give it a name and a display name (only used for email & SMS notifications but still a required field – these names can be the same as each other).
– Select the Actions tab (ignore Notifications as we’re not using that) and set the Action type to be Logic App.
That will give you the Add or edit a Logic App action window, and you can browse to your subscription, resource group and logic app you already created in step 1 (see, I told you that first step would make this easier).
The trigger name should default to manual and you can leave the common alert schema off.
– Click ok, add any tags (hint: Owner plus your name is always a good idea if you have no other tagging standards) then click Review + create, then Create.
– Add the alert rule details by entering an alert rule name and choosing the resource group to save the alert rule to, then click Create alert rule.
All done!
Now, remember how I said you don’t go to Azure Monitor to create the resource health alert? Surprise! You do go to Azure Monitor alerts and choose Manage alert rules to now find this and any other resource health alerts you have already created. They’ll also show up in the Azure monitor alert statistics.
Learn more:
Azure Resource Health is free service. For information on Logic Apps pricing, visit Pricing model for Azure Logic Apps and Logic Apps pricing.
Interested in capturing a Service Health alert or a metric alert instead? Or maybe posting to a different application or messaging platform? Check out the other examples at How to trigger complex actions with Azure Monitor alerts.
Want more information on monitoring virtual machines? Visit Monitoring Azure virtual machines with Azure Monitor.
You can even create resource health alerts using a template. Visit Configure resource health alerts using Resource Manager templates.

by Contributed | Oct 26, 2020 | Technology
This article is contributed. See the original author and article here.
We are planning to extend the python() plugin features and capabilities to better fit ML and Data Science workloads. We want to better understand your use cases, required features, existing blockers.
Please take less than 5 minutes (really ) and fill this survey, it will help us to prioritize and build our ML roadmap.
Go to ADX python() plugin survey
This is your chance to influence, and your contribution is highly appreciated!
by Contributed | Oct 26, 2020 | Technology
This article is contributed. See the original author and article here.
Introduction
Hello everyone, this is Andrew Coughlin again and I am a Customer Engineer at Microsoft. A question I get asked is can you use Distribute File System Namespaces (DFS-N) with an Azure File Share. In this blog I will explain how to do this by focusing on how to integrate DFS-N with Azure File Shares with AD DS Authentication over SMB. On June 11, 2020 Active Directory Domain Services (AD DS) authentication over SMB for Azure file shares was released.
Enabling AD DS authentication for your Azure Files Shares allows you to use your on-premises credentials. This does require the synchronization of on-premises users into Azure Active Directory, and gives the ability to control share level access via Azure Active Directory while controlling the file system permissions with Active Directory Domain Services.
Using Active Directory authentication for Azure Files over SMB gives the ability to use Azure Files as a replacement for traditional file servers. This gives customers the ability to shift their file services to Azure and retire their on-premises file servers.
Prerequisites
- Connectivity from your on-premises locations to Azure.
- Ensure these steps have been completed before setting up the storage account.
- Create a storage account as documented here, then create a Azure File Share as documented here.
- Storage account that has Active Directory Domain Services Enabled.
- DFS Namespace created as documented here.
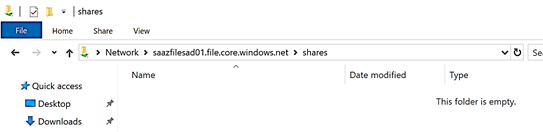
Verify Azure File Share
First, we want to confirm permissions are setup correctly and the share does exist. To do this we will do the following:
- Launch Windows Explorer.
- Type the storage account service endpoint with the share, example: storageaccountname.file.core.windows.netsharename

Create DFS Namespace
- Click Start > Click Server Manager.
- In Server Manager, click Tools > DFS Management.
- Right click on Namespaces and click Add Namespaces to Display…

- Select the Namespace you are going to add the Azure File share to.

- Right click the name space once added, then click New Folder.

- Provide the name of the new folder and click Add.

- Type the storage account service endpoint, then click OK.

NOTE: You should not click Browse as in doing so will generate an error message when trying to enumerate shares on the server. Since the storage account is not windows server, we won’t be able to enumerate the shares on the storage account as of writing this article.
- Click OK, on the New folder window.


With the above steps we just setup a new dfs namespace share that your end users can navigate to.
Verify DFS Namespace Share
- Next, we want to verify the DFS Namespace folder we just created.
- Launch File Explorer.
- Type the DFS Namespace and share name, example: dfsnamespace.localpublic

- Select the folder we just created in the above steps.

Conclusion
In this post I have covered how to integrate DFS-N with Azure File Shares with Active Directory Domain Services authentication over SMB.. I hope you have found this article helpful and thank you for taking the time to read this post.
by Contributed | Oct 25, 2020 | Technology
This article is contributed. See the original author and article here.
Introduction
This article is the third installment of a series on SAP BAPI transactions in BizTalk.
In SAP BAPI Transactions Walkthrough, an orchestration receives a number of BAPI transaction requests one at a time. In the second post, Debatching SAP BAPI Transactions, the same orchestration is modified to accommodate messages containing a potentially large number of BAPI transaction requests; these messages are debatched by using an in-orchestration receive pipeline to create the BAPI transaction messages sent to the SAP server.
A common point between these two previous setups is that the BAPI transactions are sent serially, and the responses from the SAP server are received in the same order. The next variation, presented here, corresponds to a situation where neither constraint is required: BAPI transactions can processed concurrently, and responses do not need a specific order. To this end, we implement the Scatter-Gather pattern. In the new design, a parent orchestration starts a separate child orchestration instance for each BAPI transaction, and a self-correlating port is used for getting the responses back. The child orchestration implements a variation of the Content-Based Router pattern whereby message content determines subsequent BAPI actions and connection states.
Background
As explained in Run BAPI Transactions in SAP using BizTalk Server, the message context property Microsoft.Adapters.SAP.BiztalkPropertySchema.ConnectionState is used to map a BAPI transaction to a Logical Unit of Work (LUW) on the SAP server side. So, the first transaction has this property set to “OPEN”, subsequent transactions then use “REUSE”, and the last transactions have either “CLOSE” or “ABORT”.
To delve a little into the BizTalk internals at a high-level, a series of transaction messages (i.e. OPEN-REUSE-REUSE-…-CLOSE) requires the same connection for outbound communication with the SAP server, and this connection is mapped to an LUW on the SAP server side by interchange id and send port id. In our current scenario, debatched messages share the same interchange ids which get propagated throughout the process, and the created BAPI transactions are sent from the same send port, so they can be grouped in the same LUW. In layman’s term, for BAPI transactions to be in the same LUW, (from OPEN to CLOSE/ABORT) they need to come from the same “place” (the interchange id) and to be sent out to the same “destination” (the send port) with the same route (the “session”).
The use of interchange id + send port id is compatible with the “session” paradigm provided by the SAP Connector for Microsoft .NET (NCo) to expose the BAPI Transaction Model documented by SAP. Note that the latter mentions some restrictions on combining BAPIs in the same LUW. For instance, it is not possible to make two write accesses on the same instance within one LUW. However, it is possible to create several instances of the same object type within an LUW, as is the case in our scenario. Of particular interest here, BizTalk allows asynchronous and parallel processing of BAPIs, which can be an attractive proposition for instance for communication with an external server and associated latency.
As a side-note, it is the opportunity to mention that:
|
Implementing the Scatter-Gather Pattern
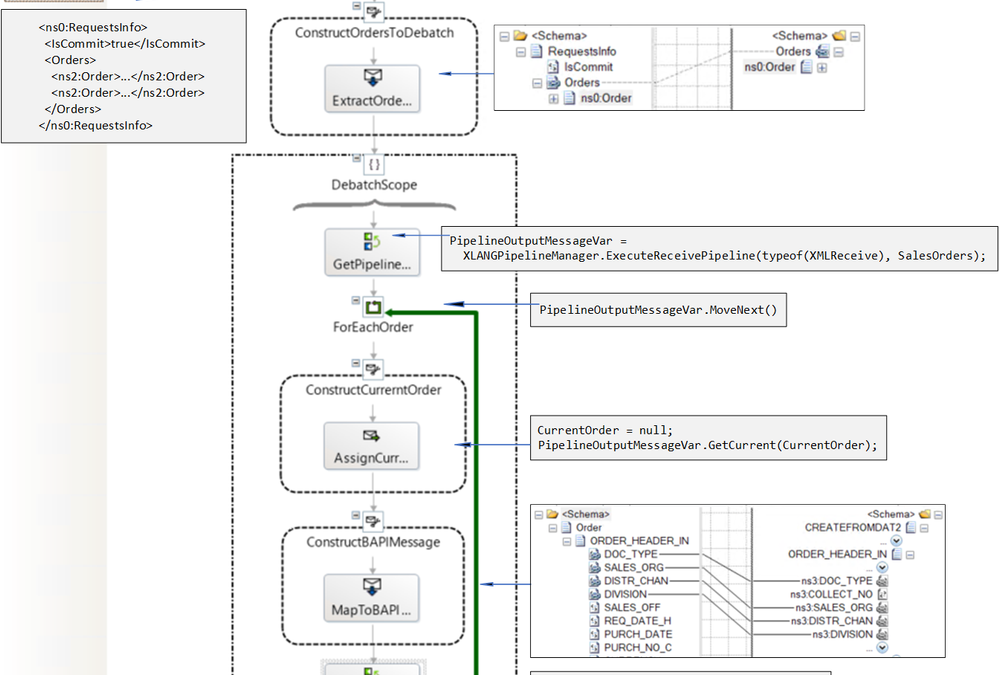
Let’s start with the main orchestration. The first stage is the debatching pipeline explained in detail in the previous post Debatching SAP BAPI Transactions.
Orchestration receives
|
Debatching pipeline produces
|
<ns0:RequestsInfo xmlns:ns0="…">
  <IsCommit>true</IsCommit>
  <Orders>
    <ns2:Order xmlns:ns2="">
      <ORDER_HEADER_IN>
        <DOC_TYPE>TA</DOC_TYPE>
        <SALES_ORG>1000</SALES_ORG>
        <DISTR_CHAN>12</DISTR_CHAN>
      </ORDER_HEADER_IN>
      <ORDER_ITEMS_IN>
          <MATERIAL>DPC1020</MATERIAL>
      </ORDER_ITEMS_IN>
      <ORDER_PARTNERS>
         <PARTN_ROLE>AG</PARTN_ROLE>
        <PARTN_NUMB>0001012</PARTN_NUMB>
      </ORDER_PARTNERS>
    </ns2:Order>
  </Orders>
</ns0:RequestsInfo>
|
<ns0:CREATEFROMDAT2 xmlns:ns0="" xmlns:ns3="">
    <ns0:ORDER_HEADER_IN>
        <ns3:DOC_TYPE>TA</ns3:DOC_TYPE>
        <ns3:SALES_ORG>1000</ns3:SALES_ORG>
        <ns3:DISTR_CHAN>12</ns3:DISTR_CHAN>
        <ns3:DIVISION></ns3:DIVISION>
    </ns0:ORDER_HEADER_IN>
    <ns0:ORDER_ITEMS_IN>
        <ns3:BAPISDITM>
            ...
        </ns3:BAPISDITM>
    </ns0:ORDER_ITEMS_IN>
    <ns0:ORDER_PARTNERS>
       ...
    </ns0:ORDER_PARTNERS>
</ns0:CREATEFROMDAT2>
----------------------------------------------
<ns0:CREATEFROMDAT2 xmlns:ns0="" xmlns:ns3="">
    <ns0:ORDER_HEADER_IN>
        <ns3:DOC_TYPE>TA</ns3:DOC_TYPE>
        <ns3:SALES_ORG>1000</ns3:SALES_ORG>
        <ns3:DISTR_CHAN>12</ns3:DISTR_CHAN>
        <ns3:DIVISION></ns3:DIVISION>
    </ns0:ORDER_HEADER_IN>
    <ns0:ORDER_ITEMS_IN>
        <ns3:BAPISDITM>
            ...
        </ns3:BAPISDITM>
    </ns0:ORDER_ITEMS_IN>
    <ns0:ORDER_PARTNERS>
       ...
    </ns0:ORDER_PARTNERS>
</ns0:CREATEFROMDAT2>
|
After pipeline processing, a variable named “BAPIOrders” contains a list of BUS2032.CREATEDAT2 objects. This is summarized below.

In the subsequent orchestration stage, instead of sending the BAPI transactions directly to the LOB send-receive port as was previously done, single BAPI transaction messages BUS2032.CREATEFROMDAT2 are passed as parameter to a Start Orchestration shape. This pattern is referred to as “scatter” since the messages are scattered out to child orchestrations, where the send-receive exchanges with the SAP server happen.
Note: The Start Orchestration shape allows true parallelism. This is not the case for instance with the Parallel shape, which does not make guarantees on “multi-threaded-like” execution . More info is available in a previous blog article and in How the Parallel Actions shape works.
Parallelism is also not the case with the Call Orchestration shape, which is synchronous.
|
In the main (parent) orchestration, the LOB send-receive port that was used for communicating with the SAP server in previous implementations is now replaced by a self-correlating direct bound port, which gathers data from the child orchestration instances asynchronously. The exact steps on how to implement the Start Orchestration shape and the self-correlating direct bound port are presented in detail in How to Use Self-Correlating Direct Bound Ports.
In our case, the child orchestration ChildBAPIOrchestration has 4 parameters:
SelfCorrelatingSP |
The self-correlating port used for sending SAP responses back to the main orchestration. It is a standard parameter in the Scatter-Gather pattern.
|
ConnectionState |
The connection state (OPEN/REUSE) in the child orchestration for the BAPI transaction messages sent to the SAP server. |
XmlMessage |
A message of type XmlDocument corresponding to the BAPI transaction message (i.e. CREATEFROMDAT2, BAPI_COMMIT_MESSAGE etc.) debatched from the pipeline. |
MessageType |
The type of the message in the child orchestration to decide which operation to use in the LOB send port (explained in the next section). |
Parameters for the BUS2032.CREATEDAT2 messages are set as follows (note the assignment of typed BAPIMessage to XmlMessage, and the use of the BTS.MessageType property):
BAPIConnectionState = "OPEN"; // if this is the first message, "REUSE" otherwise
BAPIMessage = BAPIOrders.Get(BAPIOrdersCount); // BAPIOrdersCount is the loop index
XmlMessage = BAPIMessage;
MessageType = BAPIMessage(BTS.MessageType);

Parameter Processing in the Child Orchestration
The child orchestration uses the MessageType parameter to route messages to the proper send port operation. This is done in a Decide shape with the following condition:
MessageType == "http://Microsoft.LobServices.Sap/2007/03/Bapi/BUS2032/#CREATEFROMDAT2"
Note that the message type has the format <namespace>#<root node name>.
The BAPI transaction message is then constructed with:
BAPICreateFromData = XmlMessage;
BAPICreateFromData(Microsoft.Adapters.SAP.BiztalkPropertySchema.ConnectionState) = ConnectionState;
The transaction message BAPICreateFromData is processed in the WCF-SAP send-receive port, SAPSendReceivePort. The response from the SAP server, which contains the newly-created document id, is forwarded back to the parent orchestration via the self-correlating send port SelfCorrelatingSP.

As explained in SAP BAPI Transactions Tutorial, the parent orchestration extracts the document ids from the SAP server’s responses and saves them for latter reuse with BUS2032.GETSTATUS messages in the last stage.
Child Orchestration Design
The previous section showed what happens for the BUS2032.CREATEFROMDAT2 method. We reuse the same orchestration design for BAPI_TRANSACTION_COMMIT, BAPI_TRANSACTION_ROLLBACK, GETSTATUS: The same child orchestration handles all message types with a Decide shape to dispatch received XmlMessages to the corresponding execution path based on the value of the MessageType parameter. This is similar to the Content-Based Router pattern.


Main Orchestration
Child orchestration instances are started in multiple stages:
- Stage 2: when the BAPI transaction messages are retrieved from the local list;
- Stage 3: to execute (1) BAPI_TRANSACTION_COMMIT or (2) BAPI_TRANSACTION_ROLLBACK actions;
- Stage 4: to execute the GETSTATUS action based on the document ids received back from the child orchestration instances in Stage 2.
Putting together all stages of our main orchestration, now version 3.0:


It is important to note that while there is no guarantee on the execution order of the child orchestration instances, the parent orchestration will not proceed to the commit/rollback stage until all responses have been received on the self-correlating port. This prevents channels from closing too early, thereby avoiding the “Inner Channel” errors mentioned for instance in Problems Handling SAP-Transactions.
Concluding Remarks
If the Start Orchestration shapes are replaced by Call Orchestration, the main orchestration will process everything in the same thread, and responses from the SAP server will be received in chronological order. If it is the desired behavior, it is an easy way to make the current orchestration equivalent to the one previously presented in Debatching SAP BAPI Transactions.
Besides sequencing, another factor to consider in the choice of a Call or Start Orchestration shape is performance, as has been discussed elsewhere. For instance, the gain from parallel processing could be lessened by the latency induced by the Start shape as messages go through the message box.
Last, the rollback path would be well-suited in the catch exception block of a scope shape. An interesting way to extend the topic presented here could be to see how error handling is affected by debatching and asynchronous processing.
Sample Code
All code used in this article is attached.
References
SAP BAPI Transactions Walkthrough
Debatching SAP BAPI Transactions
Scatter-Gather pattern
How to Use Self-Correlating Direct Bound Ports
BAPI Transaction Model documented by SAP
Content-Based Router pattern
For more general info on the SAP Adapter:
Operations on BAPIs in SAP
Run BAPI Transactions in SAP using BizTalk Server
Message Schemas for BAPI Operations
SAP Adapter documentation
Registry setting to enable BAPI transactions

Recent Comments