This article is contributed. See the original author and article here.
How do you monitor when a resource is unavailable? There are many tools and products that will do this, often with integrations into ticketing systems or alerting methods. Let’s look at virtual machines and get the to post a message into Microsoft Teams.
Instead of us having to define what a resource looks like when it is unavailable (what metrics, log events or network responses would occur), we’re going to use Azure Resource Health.
Azure Resource Health captures events whether they are related to the platform (such as a problem with VMs in an affected region of an Azure incident) or if they are user initiated (like a shut down request being initiated by a person, even if that’s from inside the virtual machine’s operating system and not via any action through the Azure Resource Manager).
It relies on signals from different Azure services to assess whether a resource is healthy (available) or not. The exact checks and signals depend on what the resource type is and not all resource types are supported. For a full list including the checks, visit Resource health types and checks.
So, if Resource Health is going to fire an event if a virtual machine is down, let’s capture that and post the details into a message in a Microsoft Teams channel.
In essence, we’re generating a monitoring alert from a Resource Health event, then sending that to an action group which calls a Logic App. The Logic App receives the alert as an http message, and posts the relevant data as a Teams message.
Step 1: Create the Logic App
Hold up, I thought we were going to create a monitoring alert? Well we are, but setting up the logic app first makes the rest of the process a little easier.
– In Logic Apps via the Azure Portal, create a new Logic App and choose a resource group to put it in and give the Logic App a name.
– Select the location as Region and choose your region to store it. You can keep Log Analytics off.
– Once it has been created, go to the new logic app resource – you should be presented with the Logic Apps Designer.
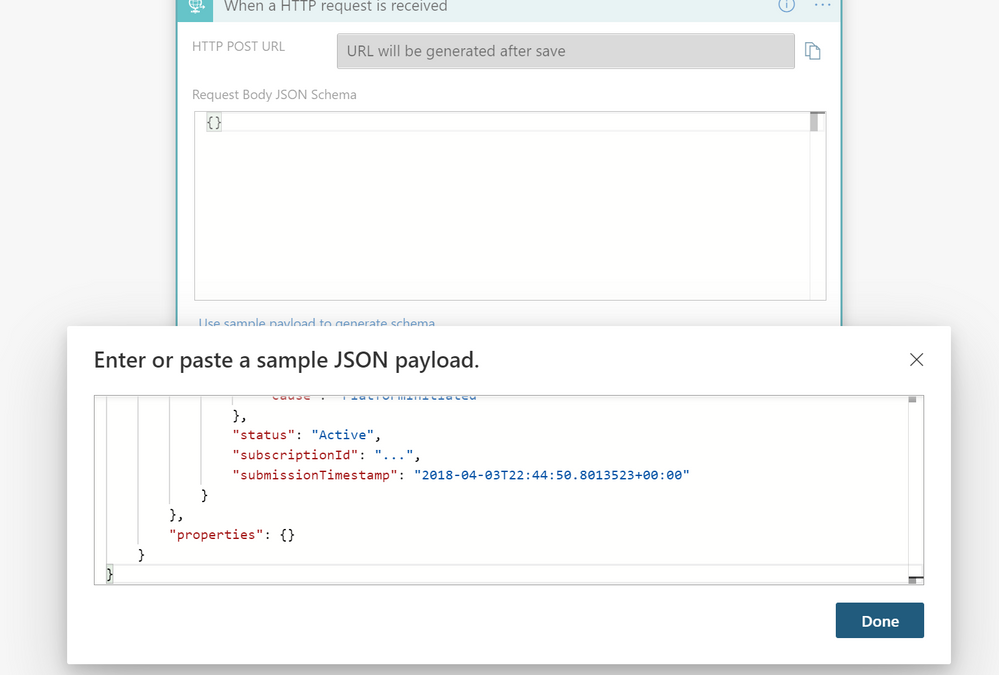
– We want to select the trigger “When a HTTP request is received”
– Now we’ll provide a sample of what data is in a resource health alert. Click Use sample payload to generate schema, paste the following JSON, then click Done:
{
    "schemaId": "Microsoft.Insights/activityLogs",
    "data": {
        "status": "Activated",
        "context": {
            "activityLog": {
                "channels": "Admin",
                "correlationId": "7055f77b-bf9a-4c10-8985-12db6d9a3ddc",
                "description": "…",
                "eventSource": "ResourceHealth",
                "eventTimestamp": "2018-04-03T22:44:43.7467716+00:00",
                "eventDataId": "fedb3ebe-b6af-4920-adb7-10d43514db0f",
                "level": "Critical",
                "operationName": "Microsoft.Resourcehealth/healthevent/Activated/action",
                "operationId": "e416ed3c-8874-4ec8-bc6b-54e3c92a24d4",
                "properties": {
                    "title": "...",
                    "details": "...",
                    "currentHealthStatus": "Degraded",
                    "previousHealthStatus": "Available",
                    "type": "Downtime",
                    "cause": "PlatformInitiated"
                },
                "status": "Active",
                "subscriptionId": "...",
                "submissionTimestamp": "2018-04-03T22:44:50.8013523+00:00"
            }
        },
        "properties": {}
    }
}

– Logic Apps will remind you that you need a Content-Type header set to application/json in your request. You can select tick Got it, as the Resource Health alert includes this.
– Then we can add the “post to Teams” step. Click + New step and type Microsoft Teams in the search bar, then click the Microsoft Teams icon. Scroll down in the Actions tab and select Post a message (V3) (preview):

Note: As this article ages and the products update, that exact action name may differ, but you’re still going to want to look for a Microsoft Teams action that posts a message.
– Click into the Team and Channel fields respectively to choose the Team and Channel you want to post to.
– Then click in the Message field. Here we can play with the “dynamic content” so each posted message contains details about the event that fired it.
Dynamic content picks up the parameters in the sample data we provided, that the alert would generate. My sample message looks like this:
ALERT: ‘eventSource’
The resource ‘resourceId’.
is currently ‘currentHealthStatus’
This was ’cause’
Event timestamp: ‘eventTimestamp’
You need to use the Dynamic content picker and search to find and select each of the elements above in the ‘ ‘ marks, so it looks more like this:

And when it posts, the resulting Teams message looks like this:
ALERT: ResourceHealth
The resource /subscriptions/redactednumber/resourceGroups/rgname/providers/Microsoft.Compute/virtualMachines/VMname.
is currently Unavailable
This was UserInitiated
Event timestamp: 2020-10-26T06:47:36.6975752+00:00
With the Expressions in logic app, you could get a little fancier by shrinking the resource name to just the VM name, or changing the event timestamp to display in your preferred timezone.
– Click Save and your logic app is done!
Step 2: Create the Resource Health alert
You’ll find Resource health in the Service health blade of the Azure portal, or in the Support + troubleshooting section of a supported resource. Note: this one is a little tricky as you don’t go to Azure Monitor to create it.

– Click + Add resource health alert.
If I access this from a virtual machine’s resource page, the alert rule will automatically populate the subscription, resource type, resource group and resource name, based on the VM that was your entry point.
TIP: You can adjust any of these to include groups of resources and even resources of different types, and you can set it to automatically apply to any newly-created resources.
– Set the alert condition:
Event status: select Active, In Progress and Updated
Current resource status: select Degraded, Unavailable and Unknown
Previous resource status: select all
Reason type: select Platform Initiated and User Initiated
That’s how I configured my example, but this is where your monitoring logic needs come in. Maybe you only want this to alert on platform initiated events, so you can triage Azure service issues differently from human generated ones?
– Set the action group by clicking select action group and then + Create action group to make a new one.
– Choose a subscription and resource group, give it a name and a display name (only used for email & SMS notifications but still a required field – these names can be the same as each other).
– Select the Actions tab (ignore Notifications as we’re not using that) and set the Action type to be Logic App.
That will give you the Add or edit a Logic App action window, and you can browse to your subscription, resource group and logic app you already created in step 1 (see, I told you that first step would make this easier).
The trigger name should default to manual and you can leave the common alert schema off.
– Click ok, add any tags (hint: Owner plus your name is always a good idea if you have no other tagging standards) then click Review + create, then Create.
– Add the alert rule details by entering an alert rule name and choosing the resource group to save the alert rule to, then click Create alert rule.
All done!
Now, remember how I said you don’t go to Azure Monitor to create the resource health alert? Surprise! You do go to Azure Monitor alerts and choose Manage alert rules to now find this and any other resource health alerts you have already created. They’ll also show up in the Azure monitor alert statistics.
Learn more:
Azure Resource Health is free service. For information on Logic Apps pricing, visit Pricing model for Azure Logic Apps and Logic Apps pricing.
Interested in capturing a Service Health alert or a metric alert instead? Or maybe posting to a different application or messaging platform? Check out the other examples at How to trigger complex actions with Azure Monitor alerts.
Want more information on monitoring virtual machines? Visit Monitoring Azure virtual machines with Azure Monitor.
You can even create resource health alerts using a template. Visit Configure resource health alerts using Resource Manager templates.
Brought to you by Dr. Ware, Microsoft Office 365 Silver Partner, Charleston SC.

Recent Comments