by Contributed | Dec 17, 2020 | Technology
This article is contributed. See the original author and article here.
When learning something new there are a lot of phrases, terms and theory to learn and when learning Azure the same is true. One of the things you should be aware of within Azure is the difference and use cases of Availability Zones and Availability Sets.
When we are architecting workloads we see availability is making sure the resources or workloads are there when you need them.
Virtual Machines in Azure
Within Azure when you spin up a virtual machine it gives you an availability of either 95%, 99.5% or 99.9% depending on how you configure your disks with that virtual machine. When you think about it in monthly terms a 95% Service Level Agreement (SLA) allows for around one and half days downtime. For a lot of workload cases and organisations these availability numbers will be more than adequate. If you need more then that’s where Availability Zone and Sets can help.
Availability Sets
Availability Sets takes the virtual machine and configures multiple copies of it. Each copy is isolated within a separate physical server, compute rack, storage units and network switches within a single datacentre within an Azure Region.
When you create your virtual machine you can specify the Availability Set, you can’t change it or move it in or out of an Availability Set after creation. If you wanted to make changes you would need to start again and recreate the virtual machine. And Availability Sets only apply to virtual machines, they can’t be used for any other type of resource within Azure.
Using an Availability Set takes your acceptable downtime to around 22minutes a month. Which is a vast improvement over the single virtual machine deployment.
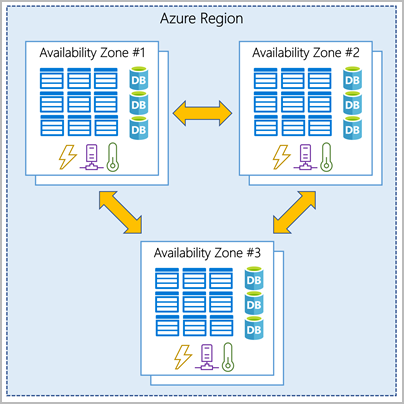
Availability Zone
The next level of availability for your virtual machines within Azure is Availability Zones. With Availability Zones utilised your acceptable downtime a month moves to less than 5 minutes as you’ve got a 99.99% SLA.
Availability Zone
With Availability Zones you are starting to use zone aware services. Your workload will be spread out across the different zones that make up an Azure region. An Azure region is made up of multiple datacentres and each zone is made up of one or more datacentres. Each datacentre is equipped with independent power, cooling and networking.
When do use them?
There can be a few deciding factors around Availability Zones versus Availability Sets, you should be thinking about these questions when designing your workloads in Azure:
- Are Availability Zones available in the region I want to use? You can find out which regions support them and which services are support here.
- What SLA or availability does this workload really need? Make sure you really understand the business needs versus the wants. Each configuration will offer you the following:
- 99.9% = Single VM (with Premium SSD or Ultra Disk)
- 99.95% = Availability Set
- 99.99% = Availability Zones
Never Stop Learning
It can feel daunting trying to learn new terminology or technologies however never stop learning, if you learn something new each day, you’ll find it all adds up. And if you are looking to learn more core Azure architectural components, check out this free Microsoft Learn module.
by Contributed | Dec 17, 2020 | Technology
This article is contributed. See the original author and article here.
Hi Team, it’s Eric Jansen again, and as always, I’m excited to show you guys what I have in store for you. Now, I gave you guys a break in Part 2 of the series and kept that one short, but break time is over, team; I’m going back to a bit of a more in-depth discussion today, so buckle up and get comfortable. In this edition and in some future editions of the series, I’ll be focusing on collecting data from the DNS Analytical Log, based on certain use cases and presenting it in a more concise and useful manner. In order to do this, I’ll share some examples of how you can parse the DNS Analytical Log to find possible items of interest, since just scrolling through literally, what can be millions of lines of events, just doesn’t sound like a fun time to me; Nor is it really feasible. Time is money!
For this scenario, I’ve developed a customized Windows based version of the popular Pi-Hole, just without the pretty GUI. I did this using PowerShell, DNS policy, and some block lists from GitHub. This was implemented on a non-domain joined physical server using Windows Server 2019. At the time of this writing the server has over 550K Query Resolution Policies to deny query attempts to domains listed within those QRPs.
Note: An important side note for those that have a similar configuration to mine – there is a hard limit of how many policies you can ‘Get’, using Get-DNSServerQueryResolutionPolicy. That limit is 500K, however you can have more than 500K policies, and they will still work, but once you hit that threshold, you’ll need some custom code (fear not, I’ve already written it and can share to those that are interested) to get past that limit for collecting information about those policies (though Get-DNSServerQueryResolutionPolicy still works fine if you’re querying for a specific policy). A topic that I may or may not discuss in the future.
In my scenario though, I have one domain per QRP (you aren’t limited to that, that’s just what I did), and those domains include ones that host ads, collect telemetry / tracking data, malware, and other unwanted domains. Also, for those wondering, yes, in the build process, I did enable the DNS Analytical log – I’d have a hard time writing the rest of this blog if I didn’t  . As I’ve alluded to previously, the use of DNS ‘black holes’ or ‘sink holes’ is a pretty common use case for DNS policy; as far as I can tell, it’s second only to support requests for Split Brain configurations.
In a future post, if there’s interest, I’ll detail that build process and discuss the functions that I’ve written to make everything happen. For the time being, however, let’s dig in to see how we can harvest some useful data from the analytic log for this particular scenario.
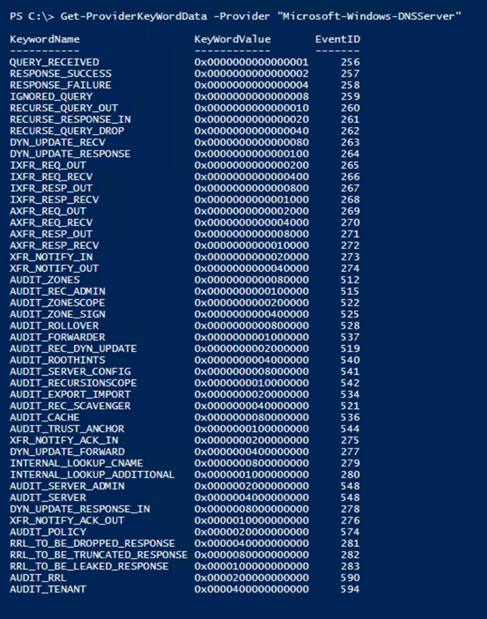
OK, so if we’re going to parse the DNS Analytical Log to harvest any useful data the first thing that we’ll need to know is what events exist to be able to parse, as well as the format for each of those events that we’re interested in parsing. The events themselves are generated based on provider outputs. In Part 1 of the series, I shared the Get-ProviderKeyWordData function with you guys to show the event keywords that the provider would return. Since then, I’ve modified the function to include the event ID’s and message format information, but I’ve only tested its functionality with the “Microsoft-Windows-DNSServer” provider – so no guarantees that it’ll work any others.
The updated code for that is here, and if you’ve been following the series, you may notice a new parameter that I’ve added to the function (–ShowEventStructure), which we’ll use in a minute:
function Get-ProviderKeyWordData ([Parameter(Mandatory=$true)]$Provider, [switch]$ShowEventStructure, [switch]$ShowLevels)
{
$AllProviderData = Get-WinEvent -ListProvider $Provider
$ProviderKeywords = $AllProviderData  | select -ExpandProperty keywords
$Events = $AllProviderData | select -ExpandProperty events

$ConvertedKeywordTable = @()

    Foreach ($Keyword in $ProviderKeywords){
        ForEach($Event in $Events){
           If($Event.keywords.name -eq $Keyword.name){
           $EventID = $Event.ID
           break
           }
        }

    $KWConvertedToHex = "{0:x16}" -f $Keyword.value
    $KWHashTable = [Ordered]@{KeywordName = $Keyword.name;KeyWordValue = $("0x" + $KWConvertedToHex);EventID = $EventID}
    $ConvertedKeywordTable += New-Object psobject -Property $KWHashTable
    }

    If($ShowEventStructure){
        ForEach($ConvertedKeyWord in $ConvertedKeywordTable){
        $ConvertedKeyWord | ft *
        $Events | where ID -eq $ConvertedKeyWord.EventID | fl Template, Description
        }
    }
    Else{$ConvertedKeywordTable}

$LevelData = @()
    IF($ShowLevels){
    $Levels = $AllProviderData | select -ExpandProperty Levels
    foreach($Level in $Levels){$LevelData += New-Object psobject -Property @{DisplayName = $Level.DisplayName ;Level = $("0x" +$Level.Value)} }
    }

$LevelData | ft -AutoSize
}
The new default output now shows the Event ID of the associated Keyword Value that the provider logs to the DNS Analytical Log:
For the purposes of today’s blog, and in following suit with Part 1 of the series, I’m just going to focus on the Parsing of RESPONSE_FAILURE events – output by the provider as Event ID 258. For the most part, what I show you in regard to parsing this event would apply to all of the others. I only say this because I haven’t written a parser for all of the events seen in the list above (not yet anyhow). The reason that I’m interested in the 258 events (specifically those that are triggered as a result of policy) are because these are the responses that are sent back to clients that are getting queries refused as a result of something that they’re trying to query (knowingly or unknowingly) that resides in the DNS block list (which exist as QRPs).
But why is this of value? How can this help my organization? Well, here’s a handful of reasons for both employing a DNS black hole solution and parsing the analytical logs to see what’s happening in your organization. (But please write a comment if you have other great use cases that I’ve missed):
- Additional means for more granular control of internet access
- You have the ability to block specific domains or hosts with DNS.
- Though block lists can be bypassed, there are other measures that can be implemented in conjunction with them to mitigate that.
- Bandwidth savings
- This could be especially useful in environments that are remote where bandwidth is extremely limited / degraded. Any organization that relies on satellite communications, maybe remote teams in Antarctica, or the shipping industry with numerous vessels on the open ocean, or military units operating in remote locations – you name it. But I wouldn’t even limit it to that, why not save bandwidth even in high speed environments?
- The bottom line is that if a machine or device can’t resolve a host or domain, then it can’t connect to it, and there can easily be hundreds of thousands of attempts per day even in small / medium sized environments, depending on the block list and clients trying to get out.
- Ability to find “Indicators of Compromise” or “IOCs”
- By parsing and analyzing the ‘hit data’, and possibly comparing current findings to historic trends, among other ways, you may be able to find compromised devices in your environment.
- Ability to find cross domain violations
- Some customers have air gapped environments that aren’t supposed to communicate with one another. If one machine gets moved from one of those environments (for example Domain B) to the other (Domain A) and tries to connect to something back on its original domain, if that domain (Domain B) is in the block list, then those violations can be identified, and a security investigation started.
- Those queries can be traced back to the originating client and you can do further auditing to get a good idea of who made the violation (If it, in fact, was a violation).
Now that we see a bit of the value proposition, we need to dig in more to figure out how to parse this data. First, I’ll figure out the structure of the event that I’m interested in. To see what that looks like, we have some options, two of those options are to trigger the event in the live log and take a look at the format or use the Get-ProviderKeyWordData function with the –ShowEventStructure parameter; we’re going to do both for comparison. The use of the –ShowEventStructure parameter will show the XML Elements and child elements in the template property, as well as the structure of the message in the Description property. It dumps this info for ALL events for the defined provider, so your screen may get busy if you run the following command:
Get-ProviderKeyWordData -Provider “Microsoft-Windows-DNSServer” –ShowEventStructure.
Note: You can’t see the command that I ran because I just snipped the data that I was interested in from a much larger list. Again, I’m just showing the part that I’m interested in.

So now let’s compare this to an actual event and see what we can do to pick the event apart for harvesting purposes. So, I ran the Show-DNSAnalyticLog function (more on this function can be found here), looking only for 258 events, selecting the first one found, showing all properties in a list format:

The Result:

Note: The way I collected the ‘258 Event’ in the screenshot above is definitely not the best way to go about this, I just happened to have recently cleared the log so there wasn’t much in it; That and I’m just looking for the first one, so it returned data pretty quickly. If you have millions of events however, and maybe the first event is towards the end of the log, you definitely don’t want to send them all through the pipeline for data collection. This was purely for demonstration purposes…but since I’m already going down the rabbit hole, I might as well give you some metrics to look at.
To give you an example of the speed difference, look at the difference between using a hash table (I’m hiding the hash table version of the collection method in the screenshot below, because I’ll be discussing it more, in greater depth, in just a bit . ) to find the ‘258 events’ vs collecting all events and sending them through the pipeline. Keep in mind that a full log could take SIGNIFICANTLY longer, and everyone’s mileage may vary depending upon resources:

Ok, I’m back out of the rabbit hole, and back to the primary discussion. So, yes…I’m mainly interested in the Message property. I’ll split the property on the semi colon since it splits up the child elements of the message property nicely, and see if I can make it more closely resemble the XML template that I showed you guys earlier:

Ok, that’s a lot closer to what we see in the XML template. When parsing and collecting data, now you’d just need to decide what data is of interest to you, and why. For this particular scenario, I decided that I wanted to collect the following data:
- The Event ID, which is actually a property of its own.
- I’d want this because I’d likely parse multiple events in a single parsing cycle, and not just 258 Events – but for this scenario, I’m just parsing 258 Events.
- The Query Source (seen above as the Destination), so that I know where the query originated from.
- Though the element name is ‘Destination’, that is where the server is sending the failure response, which makes it the ‘Query Source’.
- The Query (seen above as the QNAME), so that I know what FQDN was being queried.
- The Query Type (seen above as QTYPE), so that I know if it was queried via IPv4 or IPV6.
- The Policy (seen above as PolicyName), so that I know which policy blocked the query.
- The TimeStamp, which is actually a property of its own, but useful so that I know when the query response took place.
- The XID (also known as the ‘Transaction ID’), so that I can look at client / server transactions.
- The GUID, so that I can follow complete conversations, since that’s not possible with just the XID.
OK, log file defined, event picked, properties of the event decided upon, and even child elements decided upon, so how do we go about collecting all of this? Well, the first thing that we need to do is collect the data from the DNS Analytical log so that we can parse it. The most efficient way that I know of to accomplish this is by using the Get-WinEvent cmdlet with the –FilterHashTable parameter.
Let’s do it! Below is a code sample to demonstrate how I built the hash table filter, and its functionality with Get-WinEvent:
#Define the DNS Analytical Log name.
$EventLogName = 'Microsoft-Windows-DNSServer/Analytical'

#Step 1 for Parse-DNSAnalyticLog.....does the Analytical log even exist on the computer?
If(Get-WinEvent -listlog $EventLogName  -ErrorAction SilentlyContinue){

    $DNSAnalyticalLogData = Get-WinEvent -listlog $EventLogName

    If(($DNSAnalyticalLogData.LogFilePath).split("")[0] -eq '%SystemRoot%'){
    $DNSAnalyticalLogPath = $DNSAnalyticalLogData.LogFilePath.Replace('%SystemRoot%',"$env:Windir")
    }
}

#Define the event or events that you're interested in collecting.
[int[]]$EventIDs = 258

#Build the HashTable for use with Get-WinEvent
$FilterHashTable = @{
Path="$($DNSAnalyticalLogPath)"
ID=$EventIDs
}

$FilterHashTable = @{
Path=$DNSAnalyticalLogPath
ID=$EventIDs
StartTime= $LastIterationLastEventTimeStamp
}

#Validate functionality
Get-WinEvent -FilterHashtable $FilterHashTable -Oldest -ErrorAction SilentlyContinue
Below shows that the filter works, since it is only returning 258 events, and just as an FYI, for this demonstration, I am logging all events from the provider to the Analytical Log. I haven’t limited the output of the provider, as I demonstrated how to do in Part 1 of the series.

Awesome, we‘ve just confirmed that the filter finds the data that we’re interested in, so we can now work on picking it apart to generate more useful statistics. Ok, so how do we do that? There’s a lot of different ways. What I decided to do was create a custom PSObject to build a customized table and then I just used string manipulation to pick out just the pieces that I was interested in, to store into the PSObject. I chose string manipulation because it’s fast and it’s easier to understand for most folks reading this, over regular expressions, for example (where I have to re-learn them every time I use them  ). Here’s a snippet of code with some comments to help anyone that needs it.
Note: For the code below to work, the above code must be run in order to populate the $FilterHashTable variable. Also, I did find one scenario where the message property data was different, so in some scenarios (regardless of what you see in the event template above for event ID 258) you may see an error complaining about writing null data to the pscustomobject. If that’s the case, and for those following along, then you may need to modify the code below. The scenario that I’m aware of would require the following change:
GUID=$Event.Message.Split(“;”)[15].trim(” “).substring(5)
would need to be to be changed to:
GUID=$Event.Message.Split(“;”)[14].trim(” “).substring(5)
This is the case because in some scenarios the “ElapsedTime” field isn’t returned in the 258 event. Once I figure out why, I’ll update the post.
$i = 0  #Counter for the number of events that were parsed in total.
$j = 0  #Counter for the number of 258 events that were parsed in total.
$k = 0  #Counter for the number of 258 events that were a result of a policy match.
$l = 0  #Counter for the number of 258 events that were NOT a result of a policy match.

#Defining the HitData variable as a collection and nullifying the data within.
$HitData = @()

$HitData = foreach ($Event in (Get-WinEvent -FilterHashtable $FilterHashTable -Oldest -ErrorAction SilentlyContinue)){
$i++ #Increment Counter

    #In this case, I took this code snippet from a much larger function that parses multiple Event IDs, so this just picks out the 258 events.
    If($Event.ID -eq 258){
    $j++ #Increment Counter

        #I'm only interested in the 258 events that were a result of a policy hit.
        IF($Event.Message.Split(";")[2].toLower().trim(" ") -eq "reason=policy"){

            #Created a custom PSObject with the eight properties below, using string manipulation to only collect the parts of the element that I needed.
            [pscustomobject]@{

            #Split the message property on the semicolon, choosing the index (15 for example), trim the spaces,
            #and then skip the beginning characters (5 for example), collecting only what remains.

            GUID=$Event.Message.Split(";")[15].trim(" ").substring(5)
            Query=$Event.Message.Split(";")[4].trim(" ").substring(6);
            QuerySource=$Event.Message.Split(";")[3].trim(" ").substring(12);
            QType=$Event.Message.Split(";")[5].trim(" ").substring(6);  #Query Type 1 = IPv4, Query Type 28 = IPv6
            Policy=$Event.Message.Split(";")[11].trim(" ").substring(11);
            XID=$Event.Message.Split(";")[6].trim(" ").substring(4)

            EventID=$Event.Id;
            TimeStamp=$Event.TimeCreated;

            }
        $k++ #Increment Counter
        }
        Else{
        $l++ #Increment Counter
        }
    }
    Else{
    Write-Host "No blackholed domain hole hits were found, and thus, there's nothing that needs to be parsed!" -ForegroundColor Green
    Return
    }
}
Now, we run the code above. So, what does it look like, and did we meet the goal of parsing the event and collecting only the specific data of interest? Well, let’s see:

Boom! We won! It’s so pretty!
Ok, it’s just an array of data in a custom object that contains only the data that I wanted to collect, but I think it’s pretty.. I can hear you guys now though:
“OK, how is this better than just finding the 258 events, which we already know how to do? It looks like we’re just taking the same info that’s in the log and just moving it around a bit on the screen.”
That’s a great question!
Well, now that we have the data in a separate variable, we can do a lot with it. We can build reports, for example. The report could contain the following and more:
- Total 258 Events / Total blocked Queries
- Total 258 Events / Total blocked Queries, that were a result of a policy.
- Unique blocked queries (based on the Transaction IDs).
- A list of unique domains that the clients are trying to get to, that they aren’t allowed to get to.
- The number of unique domains in that list.
- A list of which clients are trying to get to those domains.
- Though if you have a tiered DNS forwarding hierarchy in place this may take a little extra work, depending upon where the QRPs have been deployed.
- Percentage of total queries being blocked during the timeframe of events that were in the log, at the time of the parse operation.
- Percentage of domains being queried and blocked, out of the total list of QRPs / domains that are in the block list.
- Etc.
The next thing that I want to do since I’ve successfully collected the parsed data, is export all of what I’ve deemed useful, so that maybe it can be ingested into SQL for tracking historical data. In addition to that I want to further refine this data to build a more concise report that could potentially be e-mailed or even written to its own event log… But I don’t want to make this post any longer than it already is, so I’ll continue this in the next post... I know, I know, such an abrupt ending – I’m practicing the art of writing cliffhangers. 
Oh yeah, I almost forgot to mention that all of my code comes with the following disclaimer:
The code snippets above are considered sample scripts. Sample scripts are not supported under any Microsoft standard support program or service. The sample scripts are provided AS IS without warranty of any kind. Microsoft further disclaims all implied warranties including, without limitation, any implied warranties of merchantability or of fitness for a particular purpose. The entire risk arising out of the use or performance of the sample scripts and documentation remains with you. In no event shall Microsoft, its authors, or anyone else involved in the creation, production, or delivery of the scripts be liable for any damages whatsoever (including, without limitation, damages for loss of business profits, business interruption, loss of business information, or other pecuniary loss) arising out of the use of or inability to use the sample scripts or documentation, even if Microsoft has been advised of the possibility of such damages.
Until next time!

by Contributed | Dec 16, 2020 | Technology
This article is contributed. See the original author and article here.
SAP Connector
The Logic App SAP Connector is a Generally Available component for Azure which allows easy integration with SAP ECC and S/4 HANA today.

This connector enables:
- RFC based integrations – IDOC/BAPI
- Bi-directional SAP integration
- Advanced capabilities – SNC, stateful sessions
- tRFC for IDOC – Send IDOCs to SAP only once
- Implicit Commit to commit BAPI calls
- Stateful BAPI calls
- SNC with certificate
Additional capabilities are coming soon:
- SNC support for ISE
- Stateful RFC calls
Multi-tenant setup
When using this connector in our multi-tenant offering, customer needs to deploy the On-Premises Data Gateway (OPDG) to bridge from the Azure cloud to the private network containing the SAP instance to connect to. Generally no production SAP system is directly exposed to the Internet. Furthermore the OPDG allows the customer to install the necessary SAP client libraries “SAP .NET Connector” also known as SAP NCo.
The detailed installation instructions are available in the connector’s public documentation, with this subsection specific to multi-tenant environment.
From Logic App to SAP

Logic App SAP Connector (LA) makes calls to the gateway cloud service (CS) which acts as relay to the OPDG. Internally the CS uses Azure Service Bus and the OPDG can be used to connect to a range of other back-end services besides SAP such as SQL, SharePoint, File shares. Full architecture for the gateway service can be learned in this public documentation article.
On the OPDG the SAP adapter creates an RFC Client (RFC-C) via the SAP NCo library which finally talks with the SAP system.
The messages send this way may have a synchronous response. Such is the case when calling a list method on a BAPI business object for instance.
Some other messages are asynchronous by nature, like sending an IDOC, and while there is no response from the SAP system, the transaction Id of the underlying call is returned by the SAP adapter to allow later de-duplication and troubleshooting.
For advanced used it is also possible to transmit payloads larger than the 2.5 MB allowed by the gateway Azure Service Bus relay. This requires uploading the payload to an Azure Storage blob accessible from the private network, and provide the full SAS URL instead of the payload in the call to the LA SAP Connector.
SAP to Logic App

For SAP to initiate calls to Logic App via the SAP Connector Trigger, LA sends an initial registration message when the trigger is first saved and each time it is modified. The SAP Adapter on the OPDG will register an RFC Server (RFC-S) with the SAP system. This RFC Server is identified by a Program Id inside SAP such that RFCs and BAPI methods may be call against it, or IDOC may be send to a Logic System (LS) partner configured for this Program Id. The OPDG SAP adapter will relay the calls from SAP to the RFC Server as HTTP Webhook callbacks to Logic App. The Logic App may further synchronously respond on the Webhook with a response payload for SAP.
The detailed steps to configure sending IDOCs to SAP are part of the public documentation for the connector in this subsection.
by Contributed | Dec 16, 2020 | Technology
This article is contributed. See the original author and article here.
By Richard Diver, Alex Weinert, @Matt Soseman
In this blog, I am going to tell you about a new deployment guide that will help you to apply several advanced security controls for access to AWS environments, using Microsoft Security solutions – this is one of the simplest implementations that can solve a myriad of problems when trying to provision identities and govern access to systems that may be business critical and hold very sensitive information.
Securing Access to AWS Environments
Management of AWS identities can be complex, especially when there are multiple environments to manage. The risk of compromise to administrators and developers is increasing as attackers attempt to gain access to critical resources. There is also a risk of misconfiguration and potential loss of data if the user credentials are not properly monitored for suspicious activity.
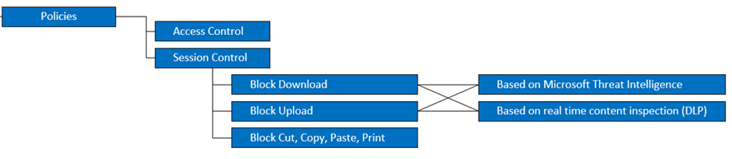
In this blog post for Azure AD (https://aka.ms/AWSIdentity), you can read about the implementation of secure authentication for AWS using Azure AD SSO. When the authentication and single sign-on with Azure AD is setup for AWS, you can implement advanced Conditional Access policies with MCAS to enable Session Control policies: this is the ability to continuously monitor the activities of the AWS user as they interact with resources. The diagram below shows some of the options available today with Microsoft Cloud App Security, when integrate with Azure AD to protect AWS:
For real-time data loss prevention (DLP), MCAS can use both the built-in content inspection or the Data Classification Service (Azure Information Protection) integration to block uploads or downloads.
Note: MCAS session controls apply to browser-based sessions. For thick clients, MCAS can only apply access policies (via Conditional Access App Control).
Implementing Advanced Security Controls
Microsoft Cloud App Security is a key component of securing any cloud application. When used to secure AWS it can also be used to scan the environment and provide recommendations against the CIS Benchmark to ensure the correct configuration and security controls have been implemented. The diagram below explains the layers of security that can be gained by using some of the Microsoft security solutions together:

You can take advantage of this defense in depth approach using integrated solutions you very likely already own! Get the latest version of the deployment guides here and learn more about how to enable this within 30 minutes:
You can also read more about how Microsoft Cloud App Security helps to protect your AWS environment here: https://docs.microsoft.com/en-us/cloud-app-security/protect-aws
To learn more about Microsoft Cloud App Security, check out the resources below:
Best Practices: https://docs.microsoft.com/en-us/cloud-app-security/best-practices
MCAS POC: Aka.ms/mcaspoc
MCAS Podcast: Aka.ms/MCASPodcast
MCAS Ninja Training: Aka.ms/MCASNinja
Thank you!
by Contributed | Dec 16, 2020 | Technology
This article is contributed. See the original author and article here.
We are excited to announce that the Simplified Ribbon is now Generally Available in Excel for the web.
The Simplified Ribbon has a refreshed modern design which makes it easy to use while retaining all the functionality and power of the classic Excel Ribbon. Going forward both the Simplified and Classic ribbon are available, and you can choose your preferred experience with a single click.
Switching to the Simplified Ribbon
You can use the “Simplified Ribbon” toggle button at the top right corner of the app to switch between the Simplified and Classic ribbon.
Using the Simplified Ribbon
The Simplified Ribbon shows the commands in a single line which not only brings a modern interface to Excel for the web but also frees up space to show more rows of data on the grid. However, this means there is less space available and all the buttons from the Classic ribbon might not be visible.
If you do not see a command on the Simplified Ribbon, please try the following:
There are several such groups of related commands across the Simplified Ribbon.
- Depending on the width of your screen some commands may be collapsed into More Options menu represented by ellipses:
 . The ellipses will be available at the end of the ribbon on the right of your screen. Click on the ellipses to see the remaining commands which did not fit on your screen. Here is an example:
-

-
- Type the command you need in the “Tell me what you want to do” box at the top of your screen. Excel will show you the command and help on using it. Here is an example on searching for commands related to indent.
Feedback
If you have any feedback or suggestions go to Help Tab > Feedback, and then select I like something, I don’t like something or I have a suggestion.
by Contributed | Dec 16, 2020 | Technology
This article is contributed. See the original author and article here.
Microsoft recently blogged about the Recent Nation-State Cyber Attacks that has impacted high value targets both across the government and private sector. This attack is also known as Solorigate or Sunburst. This threat actor is believed to be highly sophisticated and motivated. Relevant security data required for hunting and investigating such a complex attack is produced in multiple locations – cloud, on-premises and across multiple security tools and product logs. Being able to analyze all the data from a single point makes it easier to spot trends and attacks. Azure Sentinel has made it easy to collect data from multiple data sources across different environments both on-prem and cloud with the goal of connecting that data together more easily. This blog post contains guidance and generic approaches to hunt for attacker activity (TTPs) in data that is available by default in Azure Sentinel or can be onboarded to Azure Sentinel.
The goal of this article is post-compromise investigation strategies and is focused on TTPs and not focused on specific IOCs. Azure Sentinel customers are encouraged to review advisories and IOC’s shared by Microsoft MSRC and security partners to search on specific IOC’s in their environment using Azure Sentinel. Links to these IOC’s are listed in the reference section at the end.
To make it easier for security teams to visualize and monitor their environments for this attack the MSTIC team has shared a SolarWinds Post Compromise hunting workbook via Azure Sentinel and Azure Sentinel GitHub. There are many things in this workbook that threat hunters would find useful and the workbook is complimentary to the hunting methods shared below. Importantly, if you have recently rotated ADFS key material this workbook can be useful in identifying attacker logon activity if they logon with old key material. Security teams should leverage this hunting workbook as part of their workflow in investigating this attack.
Thanks to the MSTIC and M365 teams for collaborating to deliver this content in a timely manner. This document will be updated as needed.
Please note that since Azure Sentinel and the M365 Advanced Hunting portal share the same query language and share similar data types, all of the referenced queries can be used directly or slightly modified to work in both.
Gaining a foothold
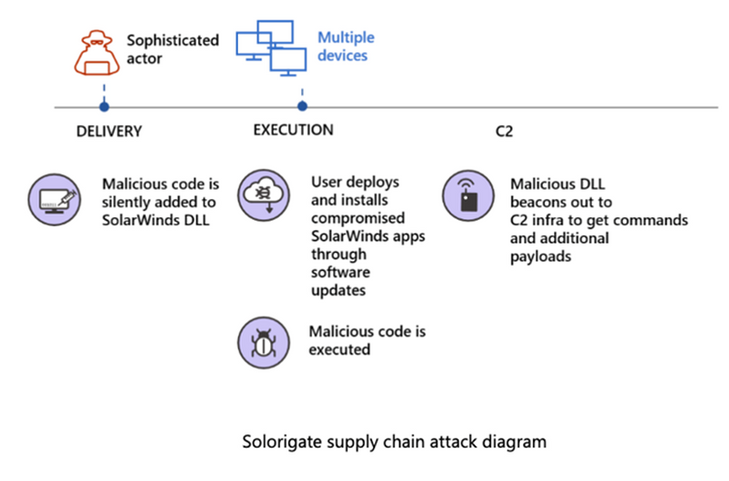
As shared in Microsoft’s technical blog – Customer Guidance on Recent Nation-state Cyber Attacks – attackers might have compromised the internal build systems or the update distribution systems of SolarWinds Orion software then modified a DLL component in the legitimate software and embedded backdoor code that would allow these attackers to remotely perform commands or deliver additional payloads. Below is a representation of various attack stages which you can also see in Microsoft Threat Protection (MTP) portal.
To hunt for similar TTPs used in this attack, a good place to start is to build an inventory of the machines that have SolarWinds Orion components. Organizations might already have a software inventory management system to indicate hosts where the SolarWinds application is installed. Alternatively, Azure Sentinel could be leveraged to run a simple query to gather similar details. Azure Sentinel collects data from multiple different logs that could be used to gather this information. For example, through the recently released Microsoft 365 Defender connector, security teams can now easily ingest Microsoft 365 raw data into Azure Sentinel. Using the ingested data, a simple query like below can be written that will pull the hosts with SolarWinds process running in last 30 days based on Process execution either via host on boarded to Sentinel or on boarded via Microsoft Defender for Endpoints (MDE). The query also leverages the Sysmon logs that a lot of customers are collecting from their environment to surface the machines that have SolarWinds running on them. Similar queries that leverage M365 raw data could also be run from the M365’s Advanced hunting portal.
SolarWindows Inventory check query
Spoiler (Highlight to read)
let timeframe = 30d;
(union isfuzzy=true
(
SecurityEvent
| where TimeGenerated >= ago(timeframe)
| where EventID == ‘4688’
| where tolower(NewProcessName) has ‘solarwinds’
| extend MachineName = Computer , Process = NewProcessName
| summarize StartTime = min(TimeGenerated), EndTime = max(TimeGenerated), MachineCount = dcount(MachineName), AccountCount = dcount(Account), MachineNames = make_set(MachineName), Accounts = make_set(Account) by Process, Type
),
(
DeviceProcessEvents
| where TimeGenerated >= ago(timeframe)
| where tolower(InitiatingProcessFolderPath) has ‘solarwinds’
| extend MachineName = DeviceName , Process = InitiatingProcessFolderPath, Account = AccountName
| summarize StartTime = min(TimeGenerated), EndTime = max(TimeGenerated), MachineCount = dcount(MachineName), AccountCount = dcount(Account), MachineNames = make_set(MachineName), Accounts = make_set(Account) by Process, Type
),
(
Event
| where TimeGenerated >= ago(timeframe)
| where Source == “Microsoft-Windows-Sysmon”
| where EventID == 1
| extend Image = EventDetail.[4].[“#text”]
| where tolower(Image) has ‘solarwinds’
| extend MachineName = Computer , Process = Image, Account = UserName
| summarize StartTime = min(TimeGenerated), EndTime = max(TimeGenerated), MachineCount = dcount(MachineName), AccountCount = dcount(Account), MachineNames = make_set(MachineName), Accounts = make_set(Account) by Process, Type
)
)
Privilege Escalation
Once the adversary acquires an initial foothold on a system thru the SolarWinds process they will have System account level access, the attacker will then attempt to elevate to domain admin level access to the environment. The Microsoft Threat Intelligence Center (MSTIC) team has already delivered multiple queries into Azure Sentinel that identify similar TTPs and many are also available in M365. These methodologies are not specific to just this threat actor or this attack but have been seen in various attack campaigns.
Identifying abnormal logon activities or additions to privileged groups is one way to identify privilege escalation.
Related to this attack, in some environments service account credentials had been granted administrative privileges. The above queries can be modified to remove the condition of focusing “User” accounts by commenting the query to include service accounts in the scope where applicable:
//| where AccountType == “User”
Please see the Azure Sentinel Github for additional queries and hunting ideas related to Accounts under the Detections and Hunting Queries sections for AuditLogs, and SecurityEvents
Microsoft 365 Defender team has also shared quite a few sample queries for use in their advanced hunting portal that could be leveraged to detect this part of the attack. Additionally, the logic for many of the Azure Sentinel queries can also be transformed to equivalent queries for Microsoft 365 Defender, that could be run in their Advanced Hunting Portal.
Microsoft 365 Defender has an upcoming complimentary blog that will be updated here once available.
Certificate Export
The next step in the attack was stealing the certificate that signs SAML tokens from the federation server (ADFS) called a Token Signing Cert (TSC). SAML Tokens are basically XML representations of claims. You can read more about ADFS in What is federation with Azure AD? | Microsoft Docs and SAML at Azure Single Sign On SAML Protocol – Microsoft identity platform | Microsoft Docs. The process is as follows:
- A client requests a SAML token from an ADFS Server by authenticating to that server using Windows credentials.
- The ADFS server issues a SAML token to the client.
- The SAML token is signed with a certificate associated with the server.
- The client then presents the SAML token to the application that it needs access to.
- The signature over the SAML token tells the application that the security token service issued the token and grants access to the client.
The implication of stealing the TSC is that once the certificate has been acquired, the actor can forge SAML tokens with whatever claims and lifetime they choose, then sign it with the certificate that has been acquired. This enables the actor to forge SAML tokens that impersonate highly privileged accounts. There are many publicly available pen-testing tools like ADFSDump and ADFSpoof that help with extracting required information from ADFS configuration database to generate the forged security tokens. Microsoft’s M365 Defender team has created several high-fidelity detections related to this. A few of them include:
- Possible attempt to access ADFS key material which detects when a suspicious LDAP query is searching for sensitive key material in AD.
- ADFS private key extraction which detects ADFS private key extraction patterns from tools such as ADFSDump.
Note: These detections can be seen in Azure Sentinel Security Alerts or in the M365 security portal.
Outside of directly looking for tools, this adversary may have used custom tooling so looking for anomalous process executions or anomalous accounts logging on to our ADFS server can give us some clue when such attacks happen. Azure Sentinel provides queries that can help to:
Every environment is different and some of these queries being generic could be noisy. So, in the first step a good approach would be to limit this kind of hunting to our ADFS server.
Azure Active Directory Hunting
Having gained a significant foothold in the on-prem environment, the actor also targeted the Azure AD of the compromised organizations and made modifications to Azure AD settings to facilitate long term access. The MSTIC team at Microsoft has shared many relevant queries through the Azure Sentinel Github to identify these actions.
One such activity is related to modifying domain federation trust settings. In layperson terms, a federation trust signifies an agreement between two organizations so that users located in partner organization can send authentication requests successfully.
- The Azure Sentinel query for domain federation trust settings modification will alert when a user or application modifies the federation settings on the domain particularly when a new Active Directory Federated Service (ADFS) Trusted Realm object, such as a signing certificate, is added to the domain. Modification to domain federation settings should be rare hence this would be a high-fidelity alert that Azure Sentinel users should pay attention to.
- If a threat actor obtains access to an Application Administrator account, they may configure alternate authentication mechanisms for direct access to any of the scopes and services available to the Service Principal. With these privileges, the actor can add alternative authentication material for direct access to resources using this credential. The team has produced queries that look for addition of new key credentials to an Application or Service Principal.
- While OAuth applications in this intrusion campaign are being used for persistent access via attacker-added credentials, while reviewing OAuth applications it may be valuable to look for evidence of previously unknown OAuth permissions, such as those that can read sensitive data and provide offline access:
Suspicious application consent similar to O365 Attack Toolkit
Suspicious application consent similar to PwnAuth
Suspicious application consent for offline access
In addition, consider hunting for new key credentials being added to Service Principals and Azure AD applications. Attackers have been observed adding new key credentials and then using these to access sensitive data within an environment. MSTIC has already published detections to help identify such activity, and this has also been incorporated into the hunting workbook.
Data Access
Accessing confidential data is one of the primary motives of this attack. Data access for the attacker here relied on leveraging minted SAML tokens to access user files/email stored in the cloud via compromised AppIds. One way to detect this is when a user or application signs in using Azure Active Directory PowerShell to access non-Active Directory resources.
Microsoft Graph is one way that the attacker may be seen accessing resources and can help find what the attacker may have accessed using the Service principal Azure Active Directory sign-in logs. If you have data in your Log analytics you could easily plot a chart to see what anomalous activity is happening in your environment that is leveraging the graph. Note that the data type in Azure Sentinel below is only available when XXX is configured.
Spoiler (Highlight to read)
AADServicePrincipalSignInLogs
| where TimeGenerated > ago(90d)
| where ResourceDisplayName == “Microsoft Graph”
| where ServicePrincipalId == “524c43c4-c484-4f7a-bd44-89d4a0d8aeab”
| summarize count() by bin(TimeGenerated, 1h)
| render timechart
AADServicePrincipalSignInLogs| where TimeGenerated > ago(90d)| where ResourceDisplayName == “Microsoft Graph”| where ServicePrincipalId == “524c43c4-c484-4f7a-bd44-89d4a0d8aeab”| summarize count() by bin(TimeGenerated, 1h)| render timechart
Security Analysts using Azure Sentinel could also leverage KQL’s built-in anomaly detection algorithms to find anomalous increases in Exchange mail items accessed operations which is another way to identify this attacker activity.
For example, below is a sample query that brings out some of the logons to Azure AD that did not use multi factor authentication. It is possible this could produce many results, so additional tuning is suggested for your environment. This attack also used Virtual Private Servers (VPS) hosts to access victim networks. Combining the query below with data that list VPS server ranges will make this a high-confidence alert.
Spoiler (Highlight to read)
SigninLogs
| where TimeGenerated > ago(30d)
| where ResultType == 0
| extend additionalDetails = tostring(Status.additionalDetails)
| evaluate ipv4_lookup(IP_Data, IPAddress, network, return_unmatched = false)
| summarize make_set(additionalDetails), min(TimeGenerated), max(TimeGenerated) by IPAddress, UserPrincipalName
| where array_length(set_additionalDetails) == 2
| where (set_additionalDetails[1] == “MFA requirement satisfied by claim in the token” and set_additionalDetails[0] == “MFA requirement satisfied by claim provided by external provider”) or (set_additionalDetails[0] == “MFA requirement satisfied by claim in the token” and set_additionalDetails[1] == “MFA requirement satisfied by claim provided by external provider”)
//| project IPAddress, UserPrincipalName, min_TimeGenerated, max_TimeGenerated
SigninLogs| where TimeGenerated > ago(30d)| where ResultType == 0| extend additionalDetails = tostring(Status.additionalDetails)| evaluate ipv4_lookup(IP_Data, IPAddress, network, return_unmatched = false)| summarize make_set(additionalDetails), min(TimeGenerated), max(TimeGenerated) by IPAddress, UserPrincipalName| where array_length(set_additionalDetails) == 2| where (set_additionalDetails[1] == “MFA requirement satisfied by claim in the token” and set_additionalDetails[0] == “MFA requirement satisfied by claim provided by external provider”) or (set_additionalDetails[0] == “MFA requirement satisfied by claim in the token” and set_additionalDetails[1] == “MFA requirement satisfied by claim provided by external provider”)//| project IPAddress, UserPrincipalName, min_TimeGenerated, max_TimeGenerated
In relation to the VPS servers section above, the previously mentioned workbook has a section that shows successful user signins from VPS (Virtual Private Server) providers where only tokens were used to authenticate. This uses the new KQL operator ipv4_lookup to evaluate if a login came from a known VPS provider network range. This operator can alternatively be used to look for all logons not coming from known ranges should your environment have a common logon source.
In addition to pre-compromise logon hunting it is also possible to monitor for logons attempting to use invalid key material. This can help identify attempted logons using stolen key material made after key material has been rotated. This can be done by querying SigninLogs in Azure Sentinel where the ResultType is 5000811. Please note that if you roll your token signing certificate, there will be expected activity when searching on the above.
Additionally, as a cloud native SIEM Azure Sentinel can not only collect raw data from various disparate logs but it also gets alerts from various security products. For example, M365 Defender has a range of alerts for various attack components like SolarWinds malicious binaries, network traffic to the compromised domains, DNS queries for known patterns associated with SolarWinds compromise that can flow into Sentinel. Combining these alerts with other raw logs and additional data sources provides the security team with additional insights as well as a complete picture of nature and the scope of attack.
References
Recent Nation-State Cyber Attacks
Behavior:Win32/Solorigate.C!dha threat description – Microsoft Security Intelligence
Customer guidance on recent nation-state cyberattacks
FireEye Advisory: Highly Evasive Attacker Leverages SolarWinds Supply Chain to Compromise Multiple Global Victims With SUNBURST Backdoor
FireEye GitHub page: Sunburst Countermeasures
DHS Directive
SolarWinds Security Advisory
FalconFriday – Fireeye Red Team Tool Countermeasures KQL Queries
Microsoft-365-Defender-Hunting-Queries: Sample queries for Advanced hunting in Microsoft 365 Defender (github.com)
Azure Sentinel SolarWinds Post Compromise Hunting Workbook
by Scott Muniz | Dec 16, 2020 | Security, Technology
This article is contributed. See the original author and article here.
Mozilla has released security updates to address vulnerabilities in Firefox, Firefox ESR, and Thunderbird. An attacker could exploit some of these vulnerabilities to take control of an affected system.
CISA encourages users and administrators to review the Mozilla Security Advisories for Firefox 84, Firefox ESR 78.6, and Thunderbird 78.6 and apply the necessary updates.
by Contributed | Dec 16, 2020 | Technology
This article is contributed. See the original author and article here.
Hello Everyone,
One of the amazing journeys I have been lucky to be a part of is developing our self-tuning algorithms for detecting attacks on accounts in real-time. Back in 2012, we got tired of the treadmill of manually adapting to attackers and committed to adaptive learning systems. Today, I want to share some cool new work the team has delivered. When I started fighting account compromise at Microsoft, we put a lot of effort into building and maintaining a large set of heuristic rules that ran during authentication. These rules effectively spotted compromise based on observed behavior, but it was easy for attackers to change their patterns and bypass those rules. This meant that we were always in reactionary mode trying to update the heuristics every time an attack pattern changed, or a new attack evolved. At that point, we decided that the only scalable and maintainable way to prevent current attacks and adapt to block new attacks was to apply machine learning to the area of account compromise. After much research and many iterations, we built a real-time system that uses supervised machine learning to analyze the current compromise to adapt and block attacks as they happen.
Fast forward to today, we just released a re-design on the real-time machine learning compromise prevention system for Azure AD. The improved system still leverages supervised machine learning but it expands the features and process used to train the model, which provides significantly improved accuracy in Azure AD real-time risk assessment. The model flags more bad activity as risky while simultaneously reducing false alarms. This risk can be used by Azure AD Identity Protection customers as a condition in their Conditional Access policy engine to block risky sign-ins or ask for multi-factor authentication. Let’s dive into how the real-time compromise prevention system works.
The real-time ML system leverages intelligence from many sources, including:
- User behavior: is the user signing in from a known device, a known location, a known network?
- Threat intelligence: is the sign-in coming from a known bad, suspicious infrastructure?
- Network intelligence: is the IP address part of a mobile network, a proxy, a hosting facility?
- Device intelligence: is the device compliant or managed?
Known good or bad sign-ins are used to label the data and help “teach” the algorithm what is a good sign-in and what is a malicious sign-in. These known good and bad sign-ins are called labels and are a precious good when it comes to building AI systems for security. Our team has invested a lot in having good quality labels that can be used to train models and to assess the detection performance. One of our most significant assets is a team of highly trained analysts who work on data labelling by manually reviewing cases and making determinations. We also leverage other sources for labelling, such as customer feedback that we get directly from the Identity Protection UX and API, and threat intelligence sources from across Microsoft ecosystem.
All this intelligence is used to automatically train new supervised machine learning models, which are then deployed to the Azure AD authentication service and used to score 30 Billion authentications every day in real-time and taking just a few milliseconds per authentication. The new protection system is ever vigilant, regularly retraining the ML models dynamically adapt to changes in the bad actor ecosystem.
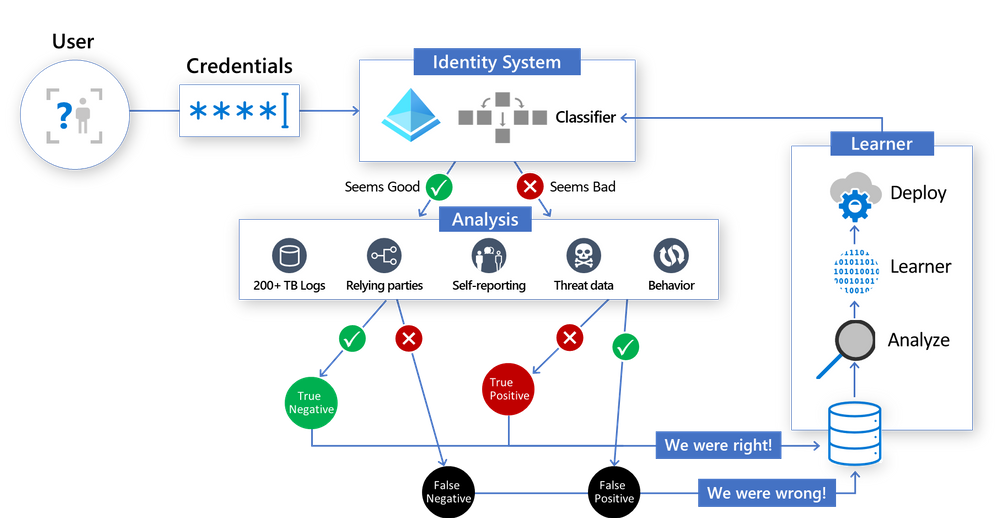
Here’s a look at how the new sign-in risk scoring system works – the classifier scores each login in the core Identity System, and then label data generated in the “Analysis” section is used by the Learner to generate an improved model, then the whole cycle starts again:
We are so excited about the improvement this new system provides and we want to show you the data. You can see Precision-Recall curves for the previous scoring system and the newly improved system in the chart below. Precision indicates the percentage of the sign-ins flagged as risky that are actually bad sign-ins. A recall is a measure of the percentage of all bad sign-ins that are flagged as risky. Each point in each line represents the precision and recall at a specific score. The score is the probability or confidence level that the model has about the sign-in being bad. In summary, the higher the precision and higher the recall, the better the model performs.

This is just one of the exciting new Identity Protection features our team has been working on. Our team continues to work with our customers, partners, and teams across Microsoft to offer customers the best Identity protection systems. If you want to find out more information about how machine learning systems like this works, be sure to check out a recent session from the Ignite conference entitled “The science behind Azure Active Directory Identity Protection”.
On the behalf of Azure AD team, thank you for all your feedback far. We hope you’ll continue to help us improve and share more about your experience with Azure AD Identity Protection. And be sure to follow us on Twitter (@AzureAD) to get the latest updates on Identity security.
Maria Puertas Calvo (@Maria_puertas_calvo)
Principal Lead Data Scientist
Microsoft Identity Division
by Contributed | Dec 16, 2020 | Azure, Microsoft, Technology
This article is contributed. See the original author and article here.
Overview
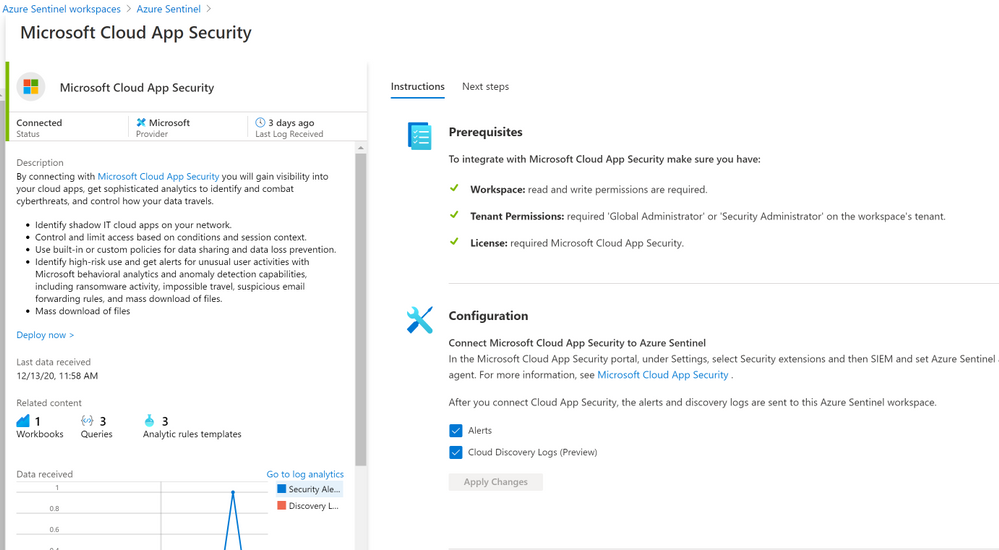
The Microsoft Cloud App Security (MCAS) connector lets you stream alerts and Cloud Discovery logs from MCAS into Azure Sentinel. This will enable you to gain visibility into your cloud apps, get sophisticated analytics to identify and combat cyberthreats, and control how your data travels, more details on enabling and configuring the out of the box MCAS connector (Connect data from Microsoft Cloud App Security)
Cloud App Security REST API (URL Structure , Token & Supported Actions)
The Microsoft Cloud App Security API provides programmatic access to Cloud App Security through REST API endpoints. Applications can use the API to perform read and update operations on Cloud App Security data and objects.
To use the Cloud App Security API, you must first obtain the API URL from your tenant. The API URL uses the following format:
https://<portal_url>/api/<endpoint>
To obtain the Cloud App Security portal URL for your tenant, do the following steps:
– In the Cloud App Security portal, click the question mark icon in the menu bar. Then, select About.
 – In the Cloud App Security about screen, you can see the portal url.

Once you have the portal url, add the /api suffix to it to obtain your API URL. For example, if your portal’s URL is https://m365x933168.eu2.portal.cloudappsecurity.com, then your API URL is https://m365x933168.eu2.portal.cloudappsecurity.com/api.
Cloud App Security requires an API token in the header of all API requests to the server, such as the following:
Authorization: Token <your_token_key>
Where <your_token_key> is your personal API token. For more information about API tokens, see Managing API tokens., here’s an example of CURLing MCAS Activity log:

The following table describes the actions supported:

Where Resource represents a group of related entities, fore more details please visit MCAS Activities API
Implementation (MCAS Activity Connector)
- Log in to the Azure tenant, http://portal.azure.com
- Go to Azure Sentinel > Playbooks
- Create a new Playbook and follow the below gif / step-by-step guide, the code being uploaded to github repo as well:
- Add a “Recurrence” step and set the following field, below is an example to trigger the Playbook once a daily basis:
- Interval: 1
- Frequency: Day
- Initialize a variable for the MCAS API Token value, make sure to generate MCAS API Token following this guide
- Name: MCAS_API_Token
- Type: String
- Value: Token QhXXXXBSlodAV9AXXXXXXQlMcFhweXXXXXRXXh1OGkXXkXXkeX
- Set an HTTP endpoints to Get MCAS Activity data:
- HTTP – MCAS Activities API:
- Parse MCAS Activities data via Json:
- Parse JSON – MCAS Activities:
- Content: @{body(‘HTTP_-_MCAS_Activities_API’)}
- Schema: uploaded to github
- Initialize an Array Variable:
- Name: TempArrayVar
- Type: Array
- Append to array variable:
- Name: TempArrayVar
- Value: @{body(‘Parse_JSON_-_MCAS_Activities’)}
- Add For each control to iterate MCAS Activities parsed items:
- Select an output from previous steps: @variables(‘TempArrayVar’)
- Send the data (MCAS Activity Log) to Azure Sentinel Log analytics workspace via a custom log tables:
- JSON Request body: @{items(‘For_each’)}
- Custom Log Name: MCAS_Activity_Log

Notes & Consideration
- You can customize the parser at the connector’s flow with the required and needed attributed / fields based on your schema / payload before the ingestion process, also you can create custom Azure Functions once the data being ingested to Azure Sentinel
- You can customize the for-each step to iterate MCAS Activity log and send them to the Log Analytics workspace so eventually each activity log will be logged in a separate table’s record / row
- You can build your own detection and analytics rules / use cases, a couple of MCAS Activities analytics rules will be ready to use at github, stay tuned
- Couple of points to be considered while using Logic Apps:
Get started today!
We encourage you to try it now!
You can also contribute new connectors, workbooks, analytics and more in Azure Sentinel. Get started now by joining the Azure Sentinel Threat Hunters GitHub community.
by Contributed | Dec 16, 2020 | Technology
This article is contributed. See the original author and article here.
In this guide, you will use the Azure Synapse Analytics Knowledge center to understand the Manage hub blade of Synapse Studio. You will learn how Synapse integrates with other data sources, even non-Azure ones, such as Amazon S3; explore data contained within those sources; and then address access control scenarios in Synapse to facilitate collaboration while keeping resources secure.
Creating a Dedicated SQL Pool in Manage Hub
To successfully complete this tutorial, you will need to have a dedicated SQL pool provisioned. Luckily, you can do this within the Manage hub. To access the Hub, locate the selector on the left-hand bar of Synapse Studio.

Under Analytics pools, select SQL pools. You will notice that your workspace comes with a serverless SQL pool by default. To create a dedicated pool, select + New.

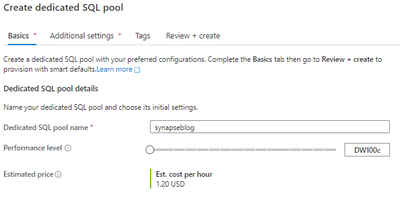
Provide a name for your dedicated pool and set it to a reasonable performance tier.
Select Review + create. Then, select Create. Wait for your pool to provision and come online. If you want to learn more information about the difference between dedicated SQL pools and serverless SQL pools, you can find more here.
Creating a Pipeline from Knowledge Center
You will need to access the Knowledge center. Recall that it can be accessed under the ? button in the upper right-hand corner of Synapse Studio. Knowledge center will be the first menu option.

Select Browse gallery. Then, select Pipelines. Search for the Movie Analytics pipeline. Select the pipeline and then select Continue.

You will need to provide three user inputs to provision the pipeline: MoviesS3, MoviesADLS, and SinkDW.

On the right side of the page, under the Preview section, you also see a high-level view of the pipeline. Configure MoviesS3 first. Lower the dropdown menu and select + New. The New linked service (Amazon S3) window will open. Provide the following configuration:
- Name: Any descriptive name will suffice
- Authentication type: Access key
- Access Key ID: Provide the Access Key ID for an AWS IAM user with read permissions to the source S3 bucket
- Secret Access Key: The Secret Access Key for the IAM user
- Service URL: A path-style S3 URL referencing the bucket, not the CSV file in the bucket. Find more information here.

If you want to confirm your S3 connection settings, select the Test connection button in the bottom right-hand corner of the page. You can test the connection to the S3 bucket or to the moviesDB.csv file by changing the selection of the Test connection radio buttons. Either way, both tests should be successful.

Once the tests succeed, select Create. You have created your first linked service in Azure Synapse. Consider linked services like connection strings. Connection information is stored in linked services to simplify the process of creating datasets from sources. To specify the MoviesADLS input, select the dropdown. When you provisioned your Synapse workspace, you provisioned an Azure Data Lake Storage Gen2 account. Selecting your account linked service will suffice for this exercise.

Finally, specify SinkDW. Again, choose the default linked service. It refers to the DNS endpoint of your workspace’s dedicated SQL pool(s).

Now that you have specified all User inputs, select Open pipeline. In Synapse Studio, you will now see the Movie Analytics pipeline in the Data hub. We will be editing this pipeline soon.

Configuring the Movie Analytics Pipeline
Select the MoveFromS3ToADLS activity. Select the Source tab. Select Open next to the MoviesS3 dataset. Verify that the Connection information is set correctly:
- Linked service: The S3 linked service you created earlier
- File path: The location of your moviesDB.csv file in [bucket]/[directory]/moviesDB.csv format
- First row as header: selected
- Retain all other defaults

To test that your settings are correct, select the Preview data button.

Returning to the Copy data activity, select the Sink tab. Select Open next to the MoviesADLS dataset. Ensure that the following information is provided under the Connection tab.
- Linked service: Choose the reference to your workspace’s ADLS Gen2 account
- File path: sample-data/ready-demo/moviesDB.csv
- First row as header: selected
- Keep all other defaults

You are now ready to execute the Copy data activity. Add a breakpoint to the Copy data activity and debug it, as the image below demonstrates.

After a few seconds, in the Output tab, you should see that the activity succeeds.

You will now execute the AggregateAndWriteToDW data flow. First, turn on data flow debug. When you do this, Azure temporarily provisions an eight core cluster.

Choose OK for the Turn on data flow debug dialog.
Open the AggregateAndWriteToDW data flow.

Select the MoviesADLS source. Then choose the Data preview tab. Select Refresh to see the data loaded from ADLS Gen2.

Since the emphasis of this guide is not on the data handling capabilities of Azure Synapse Analytics, proceed to the SinkToDW sink. Under the Settings tab, ensure that Allow upsert is enabled.

Under the Sink tab, next to the Dataset dropdown, select Open.
Under the Connection tab, open Linked service properties. For DBName, provide the name of your dedicated SQL pool as the value. Keep the Table value the same (ADF_Lab_Sink).
Return to the Integrate hub and access the Movie Analytics pipeline.

Debug the pipeline. Do not set breakpoints.
In the Output tab, monitor the execution of both activities. As indicated below, the eyeglasses icon allows you to examine the debug results of a pipeline activity more in-depth.

Examining the results for the AggregateAndWriteToDW data flow should reveal that 737 rows were written to the SQL dedicated pool.

Feel free to Publish your new pipeline and your modifications to it. That will facilitate your knowledge of securing Azure Synapse resources.
Access Control in Azure Synapse Analytics
Now that you have created SQL pools, created and edited pipelines, and added linked services, this raises the question of securing your resources. To control access to your resources, Microsoft recommends the use of Azure Active Directory security groups, simplifying security administration to verifying that users are placed in the correct groups. For example, you might create a SynapseContributors security group for developers. Synapse Roles, like Synapse Contributor, can then be assigned to security principals, which include AAD groups. These role assignments can be limited to a certain scope.

Such a role assignment can be created in the Manage hub. Locate the Access control page under the Security tab and select Add. Here are a couple of Synapse Roles that you should be aware of:
- Synapse Administrator: Access to all Synapse resources and published artifacts. The recipient can grant others roles.
- Synapse Contributor: Access to all Synapse resources except managed private endpoints (more information below) and credentials.
Note that you can change the scope of your Azure Synapse role assignments. For example, we can give a certain user permissions to use the Synapse workspace’s managed identity (WorkspaceSystemIdentity). Note that the Synapse Roles you can assign to the security principal are reduced–in this example, only the Synapse Administrator and Synapse Credential User (preview) roles can leverage the managed identity. Managed identities provide simple and secure authentication to services that use Azure Active Directory for authentication, like Azure Data Lake.

Azure provides even more capabilities to govern the access and administration of Azure Synapse Analytics. For users to create compute resources, including SQL pools, they must have at least the Azure Contributor role on the workspace. This role assignment can be added through the Access control (IAM) panel of the Synapse workspace Azure resource.

Lastly, we will discuss SQL permissions. If you have the Synapse Administrator role, you are already a db_owner on the serverless pool which is provided with your workspace, Built-in. Suppose you are a developer on the project. The Synapse Administrators can give you access through the SynapseContributors group using the following commands:
CREATE DATABASE analyticsdb;
use analyticsdb
CREATE USER [SynapseContributors] FROM EXTERNAL PROVIDER;
ALTER ROLE db_owner ADD MEMBER [SynapseContributors];
SynapseContributors is an AAD security principal (group). To enter this script, navigate to the Develop hub. Then, create a new SQL script.

The situation is slightly different for the dedicated SQL pool. Instead of using the ALTER ROLE T-SQL statement, you use the sp_addrolemember stored procedure.
CREATE USER [SynapseContributors] FROM EXTERNAL PROVIDER;
EXEC sp_addrolemember ‘db_owner’, ‘SynapseContributors’;
In the Connect to bar, the dedicated pool is specified and the specific database used in the pipeline earlier has been selected.

Azure Synapse Analytics provides a whole host of access control solutions. To learn more, please consult this. We will conclude this post with a discussion of network security in Azure Synapse Analytics.
Network Security in Azure Synapse Analytics
Azure Synapse Analytics allows you to provision a managed virtual network for your workspace. With the managed VNet, administators do not need to handle the burden of configuring traffic management rules, since that configuration is handled by Synapse. Moreover, using the managed VNet provides support for managed private endpoints. These endpoints are created in the managed VNet and enable access to Azure services. Communication between private endpoints and Azure resources occurs over private links, which transfer data through Microsoft’s network infrastructure.

Examine the image above from the Microsoft documentation. Here are a couple of important ideas you can pull from this diagram:
- The SQL pools exist outside of the managed VNet, but they can be referenced using managed private endpoints
- Private endpoints can reference Azure resources within the same Azure tenant and even resources in subscriptions outside of the AAD tenant
Clearly, using managed virtual networks with your Synapse workspaces avoids data exfiltration. You can manage private endpoints in the Manage hub, as seen below. If you provision you workspace with support for managed VNets, endpoints referencing both the SQL pool and the serverless SQL pool are automatically created.

To reap the benefits of managed VNets in Synapse workspaces, you will need to provision your workspace with support for the managed VNet–you cannot add this after the workspace is provisioned.

In this image, managed virtual network support is enabled for this Synapse workspace deployment. Moreover, since the Allow outbound data traffic only to approved targets is set, the AD tenants of target resources will need to be added.
Clean-up
In this post, you created a dedicated SQL pool. To locate the pool, navigate to Manage hub, and select SQL pools below Analytics pools. Select the three dots next to the dedicated pool you created.

You can either Pause the SQL pool if it is running, or Delete the pool. Note that if you pause the dedicated pool, you will release the compute node(s), thus halting compute billing. Alternatively, you can delete the SQL pool.
Quick get started with Azure Synapse and try this tutorial with these resources:


Recent Comments