by Contributed | Aug 6, 2021 | Technology
This article is contributed. See the original author and article here.
Introduction:
In this blog, we will look at how we configure near real-time monitoring of SQL Server on Linux and containers with the Telegraf-InfluxDB and Grafana stack. This is built on similar lines to Azure SQLDB and Managed Instance solutions already published by my colleague Denzil Ribeiro. You can refer to the above blogs to know more about Telegraf, InfluxDB and Grafana.
A quick rundown of all the tasks we’ll be carrying out to complete the setup:
- We will first install the Telegraf, InfluxDB, and Grafana containers on the monitoring host machine. You may be wondering why containers are used? because they are simple to set up and also provide isolation.
- Then, we will prepare the target SQL Server instances that we will monitor by creating the login on all of the target SQL Server instances (SQL Server on Linux/containers/Windows) that telegraf will use to connect to SQL Server instances for data collection.
- As this is a demo, I am running all three containers on a single host machine, but depending on the instances you monitor and data that is collected, you may decide to run the containers on different nodes.
- The data retention policies of InfluxDB will then be configured. The retention policy ensures that Influxdb does not grow out of bounds.
- Finally, we will configure and set up Grafana to create our dashboard with graphs and charts.
Let’s Build:
For this demonstration, the host on which I deploy the containers is an Azure VM running Ubuntu 20.04. I’m collecting data from the four SQL Server instances listed below:
- A SQL Server instance running on RHEL.
- Two SQL Server container instances, one deployed using the Ubuntu image and the other using the RHEL image.
- A SQL Server running on Windows.
Let’s start deploying containers:
- Install docker on the Ubuntu 20.04 host, which is our monitoring VM. To install Docker on Ubuntu 20.04 VM, refer to this article.
- Run the command below to create a docker network. This is the common network on which all three containers (Telegraf, InfluxDB, and Grafana) will be deployed.
docker network create --driver bridge influxdb-telegraf-net
#You can change the name of the network from “influxdb-telegraf-net” to whatever you want.
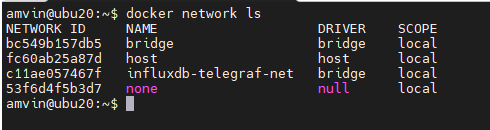
you can list the network using the command
docker network ls
We will now create the SQL Server login that telegraf will use to connect to the target SQL Server instances. This login must be created on all target SQL Server instances that you intend to monitor. You can change the login name from telegraf to any other name of your choice, but the same also needs to be changed in the telegraf.conf file as well.
USE master;
CREATE LOGIN telegraf WITH PASSWORD = N'StrongPassword1!', CHECK_POLICY = ON;
GO
GRANT VIEW SERVER STATE TO telegraf;
GO
GRANT VIEW ANY DEFINITION TO telegraf;
GO
Run the following command to deploy the telegraf container
docker run -d --name=telegraf -v /home/amvin/monitor/sqltelegraf/telegraf.conf:/etc/telegraf/telegraf.conf --net=influxdb-telegraf-net telegraf
# where:/home/amvin/monitor/sqltelegraf/telegraf.conf is a telegraf configuration file placed on my host machine, please update the path as per your environment.
# please ensure that you change the IP addresses and port numbers to your target SQL Server instances in the telegraf.conf file that you create in your environment.
Note: You can download the sample telegraf.conf from here. Please remember to change the IP address to your target SQL Server instance IP addresses.
- Run the following command to deploy the InfluxDB container
docker run --detach --net=influxdb-telegraf-net -v /home/amvin/monitor/data/influx:/var/lib/influxdb:rw --hostname influxdb --restart=always -p 8086:8086 --name influxdb influxdb:1.8
# where: /home/amvin/monitor/data/influx is a folder on the host that I am mounting inside the container, you can create this folder in any location.
# please ensure you set the right permissions so files can be written inside this folder by the container.
- Deploy the Grafana container using the following command
docker run --detach -p 3001:3000 --net=influxdb-telegraf-net --restart=always -v /home/amvin/monitor/data/grafana:/var/lib/grafana -e "GF_INSTALL_PLUGINS=grafana-azure-monitor-datasource,grafana-piechart-panel,savantly-heatmap-panel" --name grafana grafana/Grafana

# where: home/amvin/monitor/data/grafana is a folder on the host that I am mounting inside the container, you can create this folder in any location.
# please ensure you set the right permissions so files can be written inside this folder.
With the containers now deployed, use “docker ps -a” to list them, and you should see something like this:

Note: Please ensure that you open the ports on the host to which Grafana and InfluxDB containers are mapped to, in this case they are 3000 and 8086 respectively.
Let’s now setup retention policy on InfluxDB to ensure that there is limited growth of the database. I am setting this for 30 days, you can configure it as per your requirement.
sudo docker exec -it influxdb bash
#then run beow commands inside the container
influx
use telegraf;
show retention policies;
create retention policy retain30days on telegraf duration 30d replication 1 default;
quit
Setting up Grafana:
We are now ready to create the dashboard, before that we need to setup Grafana and to do that follow the below steps:
- Browse to your Grafana instance – http://[GRAFANA_IP_ADDRESS_OR_SERVERNAME]:3000
- First time you login into Grafana, login and password are set to: admin. Also take a look at the Getting Started Grafana documentation.
- Add a data source for InfluxDB. Detailed instructions are at in the grafana data source docs
- Type: InfluxDB
- Name: InfluxDB (this is also the default)
- URL: http://[INFLUXDB_HOSTNAME_OR_IP_ADDRESS]:8086. (The default of http://localhost:8086 works if Grafana and InfluxDB are on the same machine; make sure to explicitly enter this URL in the field. )
- Database: telegraf
- Click “Save & Test”. You should see the message “Data source is working”.
- Download Grafana dashboard JSON definitions from the repo from here and then import them into Grafana.
You are ready and this is how the dashboard should look, feel free to modify the graphs as per your requirement.


by Contributed | Aug 5, 2021 | Technology
This article is contributed. See the original author and article here.
Abnormal Security, an app available in Azure Marketplace, uses advanced artificial intelligence detection techniques to stop targeted phishing attacks. The cloud-native email security platform protects enterprises by detecting anomalous behavior and developing a deep understanding of people, relationships, and business context. Abnormal Security is a member of the Microsoft Intelligent Security Association.
Azure Marketplace interviewed Ben S., an IT director in the manufacturing sector, to learn what he had to say about the product.
What do you like best about Abnormal Security?
Abnormal Security stood out to us as a nuanced and unique way to approach the idea of business email compromise. Through their behavioral engine, they would build out personas for what is normal and expected interaction for your employee base, and through that identification, they would classify what is abnormal activity. And they carry that forward from your internal personnel to the vendor base that you contact and interact with.
It does a really great job of providing reporting both at a high level and then down to the granular details. So there’s a handful of dashboards that help to show attack trends and attack types, whether it be credential phishing, malware scam, or social engineering. Any of those types of categories it’s able to represent both in percentage and count. It’s also able to show attacker origin. And then the other piece that I think is incredibly helpful is that, for the emails it does remediate or take action on, it doesn’t just do that blindly. It actually takes that email message and is able to highlight the pieces that caused its threat score to be elevated so that you, as a security analyst or a support individual, can go through and understand what it is you’re looking at and know why something would be considered a threat or malicious.
How has the product helped your organization?
We saw a lot of banking impersonation and, in some cases, internal invoice impersonation taking place. We were receiving pretty legitimate-looking invoices from known vendors. But they were coming from different email servers. There were also instances where the external contact had been compromised and the invoice had banking information changes to it, trying to get us to wire funds to an attacker’s bank account. Abnormal had a great proof of concept that they were able to walk us through. From the time we turned it on, we saw immediate results from that. The solution integrates with our Exchange Online environment and doesn’t sit in line like a traditional secure email gateway type of solution. It sits next to it and maintains that same visibility. So if an attack is identified after the fact, it’s still connected to the point where it’s able to then do post-remediation and pull those delivered messages out from mailboxes.
Another useful feature is the abuse mailbox. It’s a function that allows us in IT support to leverage some email client toolbar applications for employees to be able to submit suspect messages. Previously that was a manual effort by our security team, where that would become a helpdesk ticket item that then would require hands-on analysis by someone on my team.
How are customer service and support?
Customer service has been great. When we reached out and started to engage with them on the proof of concept, they were tremendous in helping to get the platform configured. And then that carried forward to when we were customers as we were getting more and more familiar with the platform and asking questions, primarily around why certain emails were classified the way they were. Those were all easy-to-open cases where we got connected with dedicated support personnel. They configured this solution for us so that we have some flexibility in some different classifications, most notably the ability for us to maintain our VIP list of people that potentially are at higher risk, or that we want additional scrutiny around because of approval power.
Any recommendations to other users considering this product?
I think the biggest thing in the security space is there are a ton of different solutions and platforms trying to address similar issues. It’s important, when you’re looking for a solution, to understand what you’re looking to address. Financial loss, for us, was one of the biggest drivers, and in the evaluations we did, Abnormal showed the best capabilities to help address that risk.
What is your overall rating for this product?
5 out of 5 stars.
Cloud marketplaces are transforming the way businesses find, try, and deploy applications to help their digital transformation. We hope these improvements make your experience in Azure Marketplace intuitive and simple. Learn more about Azure Marketplace and find ways to discover the right application for your cloud solution needs.
by Contributed | Aug 4, 2021 | Technology
This article is contributed. See the original author and article here.
Since we first announced users could save Teams meetings recordings in Microsoft 365, we’ve clocked immense progress – with most users now saving their Teams meetings recordings by default on OneDrive and SharePoint than on Classic Stream. With this switch, users are enjoying many new benefits from meeting recordings being better integrated with Microsoft 365, including: easy share controls and external sharing capabilities, improved video management, advanced compliance and governance, and much more.
In line with the vision for Stream (built on SharePoint), and to bring these increased benefits to all our users, all new Teams meeting recordings will soon be saved to OneDrive and SharePoint – with rollout beginning incrementally from August 16, 2021.
Major updates to transcript coverage and controlling downloads.
Central to the changes we’re making are our users’ needs. Thus, alongside our efforts to transition meeting recordings to Microsoft 365, we’ve been gathering your feedback – resulting in the following product updates and feature accelerations to ensure a more accessible and secure product:
Generating Teams live transcription for all meetings to ensure closed captions are available during playback in Microsoft 365:
- Available today: Teams Live Transcription with speaker attribution has been expanded to all Office and Microsoft 365 license types.
- Rolling out by August: Live transcription will always be generated when a user clicks ‘Start recording’ on desktop client.
- Rolling out by August: Live transcription will be available across all meeting types, including channel meetings and ad-hoc meetings.
- Rolling out by August: Live transcription and live captions will be available for 15 additional spoken languages.
Downloading and editing a transcript file:
- Available today: Users can download the transcript file from the Teams meeting ‘Transcripts’ tab, where users can edit and share the file manually with others.
- Under development: Improvements to the above flow by allowing users to download the transcript file from the video player itself, make changes locally, and upload the file to the player so that the changes are reflected in the closed captions.
- Other immediate options to edit transcripts within the video player: users can download recordings from ODSP and upload to Classic Stream, where a transcript will be generated on-demand and users can edit the transcript within the video itself.
- If you have questions about this or other features, please contact support through your M365 Admin Center or your account manager.
Blocking the downloads of meeting recordings is now available for all users in ODSP:
- Available today: Block downloads for non-channel meeting recordings has been rolled out and turned on by default for all recordings.
- Available today: Block downloads for channel meeting recordings has been rolled out and admins may enable this feature through a new Teams policy setting.
To learn more about these updates, admins can see Message Center post 222640. Microsoft is excited about these updates that will bring higher quality and more accurate transcription to more people and languages than ever before.
What else is happening with Teams meeting recordings stored in Microsoft 365?
The changes above fall within the broader context of the work we’re doing with Stream (on SharePoint). Several other features have begun lighting up for Teams meeting recordings stored in Microsoft 365 including:
- Now available: Auto-recording – Meeting owners can set meetings to automatically start recording.
- Now available: Stream start page – Search and manage meeting recordings from the new Stream start page (stream.office.com)
- Rolling out: Stream video player – Watch recordings from the new Stream web player.
- Under development: Auto-expiration of meeting recordings – learn more about this feature.
To learn more about these, and other upcoming features for Stream (on SharePoint), click here.
In a nutshell, be ready for new experiences with Teams meeting recordings in Microsoft 365.

by Contributed | Aug 3, 2021 | Technology
This article is contributed. See the original author and article here.
Many smart cities are thinking about generating traffic insights using edge AI and video as a sensor. These traffic insights can range from simpler insights such as vehicle counting and traffic pattern distribution over time to more advanced insights such as detecting stalled vehicles and alerting the authorities.
In this blog, I show how I am using an Azure Percept dev kit to build a sample traffic monitoring application using the reference sources and samples in GitHub provided by Microsoft along with the Azure IoT and Percept ecosystem.
I wanted to build a traffic monitoring application that would classify vehicles into cars, trucks, bicycles etc. and count each vehicle category to generate insights such as traffic density and vehicle type distribution over time. I wanted the traffic monitoring AI application to show me the traffic pattern distribution in a dashboard updated in real-time. I also wanted to generate alerts and visualize a short video clip whenever an interesting event occurs (for example number of trucks exceed a threshold value). In addition, a smart city manager would be able to pull up a live video stream when heavy traffic congestion is detected.
Here’s what I needed to get started

Azure Percept ($349 in the Microsoft store): https://www.microsoft.com/store/build/azure-percept/8v2qxmzbz9vc
HOST: NXP iMX8m processor
Vision AI: Intel Movidius Myriad X (MA2085) vision processing unit (VPU)
- Inseego 5G MiFi ® M2000 mobile hotspot (reliable cloud connection for uploading events and videos)

Radio: Qualcomm ® snapdragon ™ x55 modem
Carrier/plan: T-Mobile 5g Magenta plan
https://www.t-mobile.com/tablet/inseego-5g-mifi-m2000
Key Azure Services/Technologies used
Overall setup and description
Step 1: Unbox and setup the Azure Percept
This step takes about 5-10 minutes when all goes well. You can find the setup instructions here https://docs.microsoft.com/azure/azure-percept/quickstart-percept-dk-set-up.
Here are some screenshots that I captured as I went through my Azure Percept device setup process.

Key points to remember during the device setup are to make sure you note down the IP address of the Azure Percept and setup your ssh username and password so you can ssh into the Azure Percept from your host machine.
During the setup, you can create a new Azure IoT Hub instance in the Cloud or you can use an existing Azure IoT hub that you may already have in your Azure subscription.
Step 2: Ensure good cloud connectivity (uplink/downlink speed for events, videos and live streaming)
The traffic monitoring AI application I am building is intended for outdoor environments where wired connections are not always feasible or available. Video connectivity is necessary for live streaming or uploading video clips when network connectivity is available. For this demo, the Azure Percept device will be connecting to the cloud using a 5G device to upload events and video clips. Make sure that the video uplink speeds over 5G are good enough for video clip uploads as well as live streaming. Here is a screenshot of the speed test for the Inseego 5G MiFi ® M2000 mobile hotspot from T-Mobile that I am using for my setup.

Step 3: Reference architecture
Here is a high-level architecture diagram of a traffic monitoring application built with Azure Percept and Azure services. For this project, I used the Azure Percept dev kit with the single USB-connected camera (as opposed to external IP cameras) and Azure Video Analyzer.

Step 4: Build Azure eye module docker container for ARM 64
You will want to make a few customizations to the Azure Eye Module C++ source code tailored to your traffic monitoring application (for example, you can make customizations to only send vehicle detection events to IoT hub or you can build your own custom parser class for custom vehicle detection models). For this project, I am using the SSD parser class with the default SSD object detection model in the Azure Eye Module.
To build a customized Azure Eye Module, first download the Azure Eye Module reference source code from GitHub. On your host machine, clone the following repo:
git clone https://github.com/microsoft/azure-percept-advanced-development.git
On your host machine, open a command shell and use the following command to build the Azure Eye Module docker container. Note that you will need docker desktop running prior to running this command (I am using a Windows host):
docker buildx build --platform linux/arm64 --tag azureeyemodule-xc -f Dockerfile.arm64v8 --load
Once docker image is built, tag it and push it to your ACR.
Step 5: Build Objectcounter docker container for arm64
Download the Object Counter reference source code from github. On your host machine, clone the following repo:
git clone https://github.com/Azure-Samples/live-video-analytics-iot-edge-python
Navigate to the folder live-video-analytics-iot-edge-pythonsrcedgemodulesobjectCounter
Build the docker container and push it to your ACR:
docker build  -f docker/Dockerfile.arm64 –no-cache .  -t objectcounter:0.0.1-arm64v8
docker login  -u <your_acr_name>  -p <your_acr_password>  <your_acr_name>.azurecr.io
docker push <your_acr_name>.azurecr.io/objectcounter:0.0.1-arm64v8
I made several source code changes to main.py in the objectCounter module to customize my own objectCounter docker container. For example, I only send a video event trigger to the signal gate processor (to capture video recording of a few seconds around an event) when a certain vehicle category exceeds a threshold count. I also made customizations so that object counter can understand inference events from SSD (in-built detection engine that comes with AzureEye Module) or a custom YOLOv3 model that is external to the AzureEye module (You can read about how to run an external YOLOv3 model in my previous blog post here
https://techcommunity.microsoft.com/t5/internet-of-things/set-up-your-own-end-to-end-package-delivery-monitoring-ai/ba-p/2323165)
Step 6: Azure Video Analyzer For Edge Devices
To be able to save video recordings around interesting event detections, you will need the Azure Video Analyzer module.
You may choose to build your own custom AVA docker container from here:
https://github.com/Azure/video-analyzer.git
You can read more about the AVA and how to deploy it to an edge device here
https://docs.microsoft.com/en-us/azure/azure-video-analyzer/video-analyzer-docs/deploy-iot-edge-device
Step 7: Configure message routes between the Azure IoT edge modules
The different modules (Azure Percept Module, ObjectCounter Module and AVA Module) interact with each other through MQTT messages.
Summary of the routes:
- Azure Percept module sends the inference detection events to IoT hub which is configured to further route the messages either to blob storage or a database (for dashboards and analytics in the cloud).
- Azure Percept module sends the detection events to objectCounter module that implements business logic (such as object counts and aggregations which are used to trigger video recordings via the AVA module)
- ObjectCounter module sends the aggregations and triggers to IoT hub which is configured to further route the messages either to blob storage or a database (for dashboards and analytics in the cloud).
- ObjectCounter module sends the event triggers to AVA so that AVA can start recording event clips
Here are a couple of screenshots to show how to route messages from IoT Hub to an endpoint:


Here is a sample inference detection event that IoT hub receives from the Azure Percept Module
Body":{
  "timestamp": 145831293577504,
  "inferences": [
    {
      "type": "entity",
      "entity": {
        "tag": {
          "value": "person",
          "confidence": 0.62337005
        },
        "box": {
          "l": 0.38108632,
          "t": 0.4768717,
          "w": 0.19651619,
          "h": 0.30027097
        }
      }
    }
  ]
Step 8: Set up the graph topology for AVA
There are multiple ways to build your own custom graph topology based on the use cases and application requirements. Here is how I configured the graph topology for my sample traffic monitoring AI application.
 "sources": [
        {
          "@type": "#Microsoft.Media.MediaGraphRtspSource",
          "name": "rtspSource",
          "endpoint": {
            "@type": "#Microsoft.Media.MediaGraphUnsecuredEndpoint",
            "url": "${rtspUrl}",
            "credentials": {
              "@type": "#Microsoft.Media.MediaGraphUsernamePasswordCredentials",
              "username": "${rtspUserName}",
              "password": "${rtspPassword}"
            }
          }
        },
        {
          "@type": "#Microsoft.Media.MediaGraphIoTHubMessageSource",
          "name": "iotMessageSource",
          "hubInputName": "${hubSourceInput}"
        }
      ],
      "processors": [
        {
          "@type": "#Microsoft.Media.MediaGraphSignalGateProcessor",
          "name": "signalGateProcessor",
          "inputs": [
            {
              "nodeName": "iotMessageSource"
            },
            {
              "nodeName": "rtspSource"
            }
          ],
          "activationEvaluationWindow": "PT3S",
          "activationSignalOffset": "-PT1S",
          "minimumActivationTime": "PT3S",
          "maximumActivationTime": "PT4S"
        }
      ],
      "sinks": [
        {
          "@type": "#Microsoft.Media.MediaGraphFileSink",
          "name": "fileSink",
          "inputs": [
            {
              "nodeName": "signalGateProcessor",
              "outputSelectors": [
                {
                  "property": "mediaType",
                  "operator": "is",
                  "value": "video"
                }
              ]
            }
          ],
          "fileNamePattern": "MP4-StreetViewAssetFromEVR-AVAEdge-${System.DateTime}",
          "maximumSizeMiB":"512",
          "baseDirectoryPath":"/var/media"
        }
      ]
    }
  }
If you are using a pre-recorded input video file (.mkv or .mp4) instead of live frames from the USB-connected camera module, then update the rtspUrl to grab frames via the RTSPsim module:
"name": "rtspUrl",
"value": "rtsp://rtspsim:554/media/inv.mkv"
I use the following RTSPSim container module provided by Microsoft to stream a pre-recorded video file:
mcr.microsoft.com/lva-utilities/rtspsim-live555:1.2
If you are using live frames from the USB-connected camera, then grab the live rtsp stream from Azure Percept Module:
"name": "rtspUrl",
"value": "rtsp://AzurePerceptModule:8554/h264"
Here is a brief explanation of the media graph topology that I use:
- There are two source nodes in the graph.
- First source node is the RTSP source (the RTSP source can either serve live video frames from the Percept camera module or pre-recorded video frames served via the RTSPsim)
- Second source node is the IoT message source (this is the output of the Object Counter Trigger)
- There is one Processor node which is the signal gate processor. This node takes the IoT message source and RTSP source as inputs and based on the object counter trigger, the signal gate requests the AVA module to create a 5 second video recording of the detected event (-PT1S to +PT4S)
- There is one Sink node, which is the fileSink. This could also be an AMS asset sink. However, currently, AMS asset sink has a limitation of minimum 30 seconds video clip duration. Hence, I used a fileSink to save a 5 second clip and then used an external thread to upload the locally saved .mp4 files to Azure blob storage. Note that for on-demand live streaming, I use Azure AMS.
You can learn more about Azure Media Graphs here:
https://docs.microsoft.com/azure/media-services/live-video-analytics-edge/media-graph-concept
You can learn more about how to configure signal gates for event based video recording here:
https://docs.microsoft.com/azure/media-services/live-video-analytics-edge/configure-signal-gate-how-to
Step 9: Dashboard to view events, videos and insights
You can use any web app (e.g. react.js based) and create APIs to build a traffic monitoring dashboard that shows real-time detections and video recordings from Azure IoT hub and Azure blob storage. Here is an example of a dashboard:

Here are some examples of what the Azure Percept detected for a few live and pre-recorded videos:


In conclusion, in just a few days, I was able to set up a quick Proof of Concept of a sample traffic monitoring AI application using Azure Percept, Azure services and Inseego 5G MiFi ® M2000 mobile hotspot!
Learn more about the Azure Percept at https://azure.microsoft.com/services/azure-percept/
Note: The views and opinions expressed in this article are those of the author and do not necessarily reflect an official position of Inseego Corp.

by Contributed | Aug 2, 2021 | Technology
This article is contributed. See the original author and article here.
Healthcare organizations need to provide more avenues of care for patients but scheduling and managing virtual visit appointments can be a time-consuming and tedious task for frontline healthcare workers.
The good news: It just got easier. Microsoft Bookings is now part of our Microsoft 365 for frontline workers offer. Bookings is available as an app in Microsoft Teams so frontline healthcare workers can schedule, manage, and conduct virtual appointments right from Teams—where they’re already working.
That means your frontline teams can save time with a simple, yet powerful tool that eases the hassle of scheduling and is integrated into their workflows. They can have a single hub with the tools they need for streamlining both care team collaboration and virtual health.
That can help your healthcare organization:
- Quickly and efficiently increase patient access to care with virtual visits.
- Improve patient outcomes by simplifying collaboration across care teams.
- Reduce costs and optimize resources by simplifying fragmented workflows.
See how frontline healthcare workers can streamline care team collaboration and virtual visits with Microsoft Teams in this video.
Seamless virtual health experiences for your frontline and your patients
With Bookings available as an app in Teams, your frontline can create calendars, assign staff, schedule new appointments, and conduct virtual visits and provider consults without ever leaving Teams.

Bookings can help reduce and automate repetitive scheduling tasks for frontline care teams. They can view multiple clinicians’ Outlook calendars to find an open slot to schedule a virtual visit. Customized confirmation and reminder emails and texts with a link to join can be automatically sent to patients. And when it’s time for their virtual visit, patients can easily join from a mobile device without needing to install an app.
In other words, you can enable seamless virtual health experiences for both your frontline and your patients.
Plus, you can earn and keep your patients’ trust with a virtual health platform that can help support your protection of patient data and compliance with healthcare regulations. For example, with Microsoft Teams, a Business Associate Agreement is put in place by default for customer organizations that are considered covered entities or business associates under HIPAA. Learn more about that in our recent whitepaper.
Virtual visits made easy and cost-effective
Our healthcare customers such as St. Luke’s Hospital and Lakeridge Health have enhanced patient care with virtual visits using the Bookings app in Teams and Microsoft 365. Now with Bookings included in Microsoft 365 for frontline workers, we’ve made it even easier and more cost-effective for healthcare organizations of all sizes to enable seamless virtual health.
Get started with Microsoft 365 for frontline workers.
A virtual health platform with many options to meet your needs
In addition to our Microsoft 365 for frontline workers offering, Teams and Microsoft 365 provide many options to help you meet your healthcare organization’s specific virtual health needs. You can expand virtual visit capabilities by connecting Teams to your electronic health record system, customizing experiences in your own apps, integrating into the Microsoft Cloud for Healthcare, and more. Learn more on our Microsoft Teams and healthcare page and Microsoft 365 and healthcare page. You can also get help finding the right fit for your healthcare organization with our virtual visit selection tool.

Recent Comments