
by Contributed | Nov 4, 2020 | Technology
This article is contributed. See the original author and article here.
The last several years brought exciting innovations in the field of Artificial Intelligence, especially when it comes to advancements in speech and language processing. Processing speech and making text and audio information searchable enables a diverse set of innovative applications, including helping researchers in searching for related papers, or building information graphs for predicting the best new drug candidates, or uncovering issues with products and services in near real time. For region like Central and Eastern Europe, which includes 30+ countries, most speaking their own language, support for local languages is a critical condition for implementing innovation. That’s why the recent (September 2020) Azure Speech services update has opened a whole new area of opportunity for our region.
With updated language support, most of the EU languages are now supported in Azure Speech services. For region which I am covering in my current role, it means that we now have support for all of our CEE EU languages (Polish, Bulgarian, Czech, Greek, Croatian, Hungarian, Romanian, Slovak, Slovenian, Estonian, Lithuanian, Latvian, Maltese) and Russian in Azure Speech and Translator services. Additionally, our speech generation models have also been updated, now leveraging the Neural TTS – a powerful speech synthesis capability, which enables to convert text to lifelike speech which is close to human-parity. Below you will find 3 benefits, how this might help you advance your products and services today.

Automatic generation of medical summary from spoken conversations between doctors and patients
First, analyzing speech data or generating speech enables you to extract insights from audio or video information, which otherwise would be unreachable for analytical systems. This might include data like customer support conversations or employee speech in videos or transcribing speech for field employees or doctors. Communicating with your customers with natural-sounding generated speech in your own language is another area of innovation, which enables scenarios from voice announcements to supporting people with visual impairments to building voice assistants. Is information the new currency? If you answer “yes” to this — why then would you have terabytes of currency sitting without you getting use of it? Now you can turn it into tangible cash-flow.
Azure Speech services are a sub-set of pre-built (but customizable) APIs for working with Speech. This includes transcribing spoken language into text for further analysis (Speech-to-Text) and generating naturally sounding speech form text input (Text-to-Speech). Azure Translator is another piece in the puzzle, which has also received major update for the languages, now translating text between 70+ languages.
Second, there are new scenarios enabled now by these pre-built AI models. Do you have that innovative idea for analysing customer conversations or augmenting your service with spoken messages in your local language? Often, these ideas were not realized due to the associated challenges like finding the right skilled people within your organization and investing into a project with unknown development cycle and returns. Now it is possible to build a realistic prototype app quickly to extract insights from your speech data, by calling the service through the API — in days, if not hours.

Analysing customer support conversations brings insights from priceless data, which is untapped without applying Speech processing
Third, this is one of those cloud services, which may work without sending your data to the cloud! Many of Azure Cognitive Services today may be deployed right within your own data center as containers. This means, that none of the actual data will be sent to the cloud, as even processing will happen locally. In this case, only billing information will be exchanged with Azure.
Interested enough to give it a try? If you are interested in learning more, you may request detailed information or virtual session on Azure Cognitive Services from our sales representatives (please specify whether you are looking for the session on Azure Cognitive services, or details of your specific projects where Speech services may be used). To read more or test Azure Speech services capabilities in your language, please refer to our Azure Speech Services Documentation.
Looking forward to the exciting results you will achieve in your business with the updated Azure Speech Services!
by Scott Muniz | Nov 4, 2020 | Security, Technology
This article is contributed. See the original author and article here.
Original release date: November 4, 2020
Adobe has released security updates to address vulnerabilities in Adobe Acrobat and Reader. An attacker could exploit some of these vulnerabilities to take control of an affected system.
The Cybersecurity and Infrastructure Security Agency (CISA) encourages users and administrators to review Adobe Security Bulletin APSB20-67 and apply the necessary updates.
This product is provided subject to this Notification and this Privacy & Use policy.
by Contributed | Nov 4, 2020 | Technology
This article is contributed. See the original author and article here.
The following is the second on a series of articles by @Ali Youssefi that we will be cross-posting into this Test Community Blog. These articles were first published by Ali in the Dynamics community but since the topic is very related with Testing it makes sense to publish here as well.
If you didn’t get a chance to catch the first one of the series, please have a look here: Test Automation and EasyRepro: 01 – Overview and Getting Started
Otherwise, please read ahead!
—————————————————————————————————————–
Summary
EasyRepro is an open source framework built upon Selenium allowing automated UI tests to be performed on a specific Dynamics 365 organization. This article will focus on designing and debugging unit tests. It will follow up on the first post’s sample unit test in depth as well as provide design and troubleshooting ideas.
Getting Started
If you haven’t already, you may want to clone the project that we used on the first article on this series (link above) from GitHub to DevOps then build locally and review any dependencies and/or test settings to run a simple test.
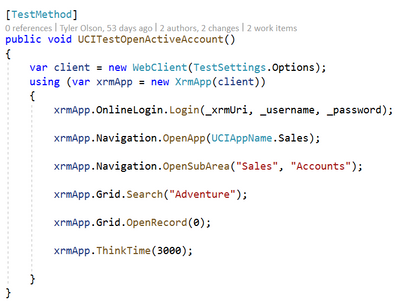
Reviewing the Open Account Sample Unit Test in depth

When working with the sample unit tests you’ll soon find that while extremely helpful you’ll need to modify or extend these tests to work with your customizations of the platform. The sample unit tests provide a great starting off point and can help us better understand how to work with the EasyRepro framework. Let’s review the UCITestOpenActiveAccount unit test line by line.
WebClient and XrmApp objects
The WebClient is derived from the BrowserPage class and injected into the XrmApp object. The WebClient contains mainly internal methods used by the XrmApp and platform element references such as OnlineLogin, Navigation, Grid, etc as shown in the unit tests above. Typically you will not be interacting with this object until you need to extend the framework.
The XrmApp is the primary way of navigating and commanding the platform. When opened you’ll see the WebClient passed into each object used in the unit tests. Review this object to better understand each of the area of the platform you can work with in your unit tests.

As you can see, each of the commands in the Open Account unit test are represented by elements related to Dynamics. These elements include commands related to the object such as working with entity forms and navigating around the platform. Each element can be explored to determine what functionality can be achieved from the framework natively.
Commands
Let’s review each one of the commands in the Open Account unit test to better understand what they are doing and where we may need to modify to better meet our requirements.
Login

The Login method typically involves two paths: One using the standard Microsoft Office login and one that redirects to your organization’s sign in page.
The first line shows passing in the URI of the organization, the username and password. How to set these values is covered in the first post in this series Test Automation and EasyRepro: 01 – Overview and Getting Started.
The second shows how to incorporate your organization’s sign in page. Each sign in page is unique and will require understanding how to work with Selenium and the DOM of the page to input and submit these credentials. This will be covered in the Designing Tests towards Customization section.
Once the Login method has completed we will redirected to our default application in the organization. The next command details moving to another UCI application.
Open UCI App

The OpenApp method uses the UCIAppName class to navigate to a specific UCI app. The standard platform applications such as Sales Hub and Customer Service Hub, as well as others, are available in the class. I’ll cover how to extend to a custom UCI app in the Designing Tests towards Customization section.
Open Sub Area

OpenSubArea introduces the first navigation into the sitemap of the Unified Interface. This method expects two parameters, the first identifying which area to open and the second which subarea to click. These string values are case sensitive.
Search

The Search method is used on the Grid object to search using the Quick Find view. Wildcard characters can be added here to simulate a user looking for values like or starting with specific characters if desired. For our unit test as long as we have the sample data in the organization we should pull up the Adventure Works (sample) record in the result set.
Open Record

The final navigation command in the unit test is to open the first record in the Grid using OpenRecord. As long as we pulled up the Adventure Works (sample) in our results this will open the first record based on the index of the rows in the view. If the index is outside of the bounds an exception will be thrown.
Think Time

Finally we have reached the end of the unit test. The final command here is a method called ThinkTime. This is used to simulate a user waiting for a period of time, in this case 3 seconds. This is a useful method to allow elements to render for use with the framework.
Designing Tests towards Customization
Adding custom UCI applications
In our sample unit test we are navigating to the Sales Hub Unified Interface but there maybe times where you will need to navigate to a specific custom application. A simple way to do so, assuming the UCI app shows in the user’s drop down when logged in, is to add to the UCIAppName class.

In the example above a new string has been added to the class called ‘PfeCustomApp’. The OpenApp method will search for an UCI app with called ‘PFE Custom App’. This can then be used in single or many unit tests.
Searching and reviewing results in a Grid
In our sample unit test we knew what to expect due to sample data in our organization. However when implementing your own unit tests you may want perform additional tasks like counting the number of results are returned, sort the records in the view, switch the view, etc.

Above is an image from the Object Browser showcasing the native EasyRepro functionality for the Grid object. To Search use the Search method. For reviewing results look to the GetGridItems method to extract the grid items which we can iterate through.

Changing Forms and Referencing Fields
Going back to the UCITestOpenActiveAccount unit test as described above we searched for the Adventure Works (sample) record in clicked on the first record in the Quick Find view. We just touched on actions that can be performed on the view, now let’s look at what can be done once we are inside the record.
When the Adventure Works (sample) record is opened we now can shift gears to working with the Entity object. The Entity object includes functionality such as but not limited to:
· Assigning the record to another user or team
· Working with field values
· Working with Sub Grids
· Switching Forms
· Switching Processes
For now let’s stick with changing forms and working with field values.
Switching Forms
Start by navigating to the OpenRecord method and adding a new line. Here we will add SelectForm(“<name of your form>”). This works with the form selector and allows us to change the form based on the name.

Working with Field Values
When working with most fields on the form the actions a user will perform are to clear out a value, read a value or update a value. In the below image I’ve added a line using the GetValue method. This returns me the current value which can be used for validation or other concerns. When referencing a field it is important to reference by its schema name and not display name. For instance on Account instead of using ‘Account Name’ I’m using ‘name’.

To clear out a value you simply have to use ClearValue and pass in the schema name.

Finally to set a value you use the SetValue method passing in the schema name of the control (unless working with a complex type field).

Debugging Tests
When you begin to extend and debug the sample unit tests towards your customization you may run questions regarding how the test is running, who its running as, how to handle unforeseen issues, etc. For this section we will talk through some common scenarios that come up and how to address them.
My Unit Test is performing unexpected actions, what can I do?
One of the key benefits of browser automation is that we can watch the unit test in action, halt the execution, and examine the current state of the platform. One of the first steps in doing this is to run the unit test in what’s called Non Headless Mode.
Running Unit Tests in Non Headless Mode
Headless Mode is what tells the unit test if we want to run the test with a GUI or not. Simply stated this will allow us to watch the browser launch and perform the actions or simply run in the background.
In the first post in this series we touched on the TestSettings object and how it tells our unit test how we want it to run. In this object is the class called BrowserOptions and within this is a property called Headless. To turn headless mode on or off, set this value to true (on) or false (off).

My Unit Test needs to run as a specific user, what can I do?
By default to run our EasyRepro unit tests (at least for the online platform) we must provide some credentials that determine who we run our tests as. This helps us identify and troubleshoot issues related to authentication and authorization. However sometimes due to your organization’s setup you may have pass through authentication which will attempt to run the unit tests as the user you are logged into your machine with.
Running Unit Tests in Incognito Mode
Going back to the TestSettings object and inside of BrowserOptions we find a property called PrivateMode. By setting this property to true we can run in “Incognito” or “InPrivate” or whateevr terminology your browser of choice uses. This helps us ensure we are using the credentials we provided as well as not assuming any cached settings are applied.
My Unit Test needs to check form or grid values, what can I do?
If you have worked with the Visual Studio Unit Testing tools in the past you are probably familiar with the Assert class. This class allows a test designer to add assertions to ensure the actions performed are accurate. EasyRepro provides us the ability to check for form or grid values and elements which can then be used to with the Assert class.
Using the Assert class
Below is an example of checking if the number of results from our search is not equal to a single result. This could be helpful to determine if duplicates exist as well as other scenarios.

Reference:
microsoft.visualstudio.testtools.unittesting.assert
Next Steps
Exploring the Sample Unit Tests
At this point you should have enough experience to begin exploring the other sample unit tests available in the Microsoft.Dynamics365.UIAutomation.Sample project. These tests show how to interact with popular elements like Business Process Flows, Quick Create forms and Command Bar actions.
Each element has its own unique capabilities and should cover most of what you will need to automate testing in the platform. However you may come across a need to extend EasyRepro to account for specific use cases which we will cover in the next post in the series Extending and Working with XPath.
Conclusion
This article focuses on a specific unit tests and exploring line by line what each command does. While this covers a significant amount of interaction with the EasyRepro framework it really is only one test case. Take time to review as many of the sample unit tests as possible. Some test I find beneficial are:
· UCITestCreateCase
· SharedTestUploadTelemetry
· UCITestBusinessProcessFlowNextStage
· UCITestAccountAddNote
· UCITestRetrieveCommandBarValues
· UCITestUpdateClearFields
—————————————————————————————————————–
We hope you guys are enjoying this series of articles on EasyRepro, please don’t hesitate to leave any comments below!

by Contributed | Nov 4, 2020 | Technology
This article is contributed. See the original author and article here.
Reconnect is back, and this week we are joined by none other than four-time MVP titleholder Vicente Gerardo Guzman Lucio! Hailing from Guanajuato, Mexico, Vicente describes himself as a Xamarin lover, project leader, and tech consultant.
Most recently, the former Developer Technologies MVP has been working on a project which links two mobile applications developed in Xamarin.Forms. The idea behind the project, Vicente says, is to reflect actions carried out between two applications in order for users to continue smoothly with their workflow.
First awarded in 2014, Vicente looks back fondly at his time as an MVP. Events like the MVP Summit, he says, brought together tech experts from all over the world and enabled training directly from product developers and creators. Now, Reconnect continues to motivate Vicente to grow as a professional and a person.
“[Being a Reconnect member] means being able to meet people who are experts in certain technological areas that I still don’t know, it means being able to learn from each one of them and, more importantly, it means being able to grow as a professional thanks to them,” Vicente says.
Moving forward, Vicente is developing a free course for developers focused on Blazor technology. He hopes to complete the course and “bring it to light” before the end of the year.
To newcomers in the MVP program, Vicente has these words of encouragement: “Never give up. If you have a goal in mind, it will always have obstacles, but perseverance is what makes things happen.”
For more on Vicente, check out his blog and Twitter @LucioMSP

by Contributed | Nov 4, 2020 | Technology
This article is contributed. See the original author and article here.
With a lot of content added to the community repo, here are some of the highlights:
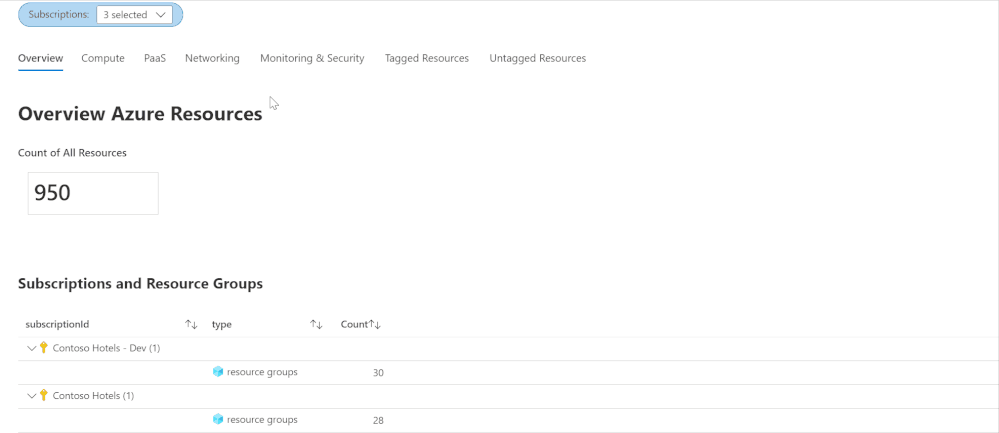
Azure Inventory Workbook (based on Azure Resource Graph)
This workspace, contributed by Billy York, provides a comprehensive review of the Azure resources you have, arranged by categories (Compute, PaaS, Networking etc.) so very easy to browse through, and details as well. 
AntiMalware Assessment Workbook
This workbook, contributed by Bruno Gabrielli, helps you review the protection status of your resources – which resources are protected and which are not, what protection you use on each and if there are issues (e.g. expired certificates).

Queries
Examples queries from the product were added to many Azure services and solutions, such as Azure AD Domain Services, Virtual Network Gateways, Change Tracking, Container Insights, Security Insight and more.
For the full list of updates visit what’s new on our Azure Monitor community repo.
Let us know what you think – leave your comments here or on our GitHub issues section and share what your liked and what you’d like to see next.
by Contributed | Nov 4, 2020 | Technology
This article is contributed. See the original author and article here.
Introduction
This is John Barbare and I am a Sr. Customer Engineer at Microsoft focusing on all things in the Cybersecurity space. In this tutorial I will walk you through the steps of configuring and enabling Microsoft Defender for Endpoint in Microsoft Endpoint Manager (MEM). The name has been rebranded from Microsoft Defender ATP to Microsoft Defender for Endpoint but inside the portal(s) the name has not changed as of this publication. For this demo, I will show you how to configure almost all settings in the MEM console with the exception of making sure Intune is set to on in Microsoft Defender for Endpoint so all systems are properly synchronized. With that said, let’s get started and see MEM’s awesome capability of the Endpoint Security tab and start protecting your endpoints. For licensing information visit the product licensing terms and Microsoft 365.
Enable Microsoft Defender for Endpoint
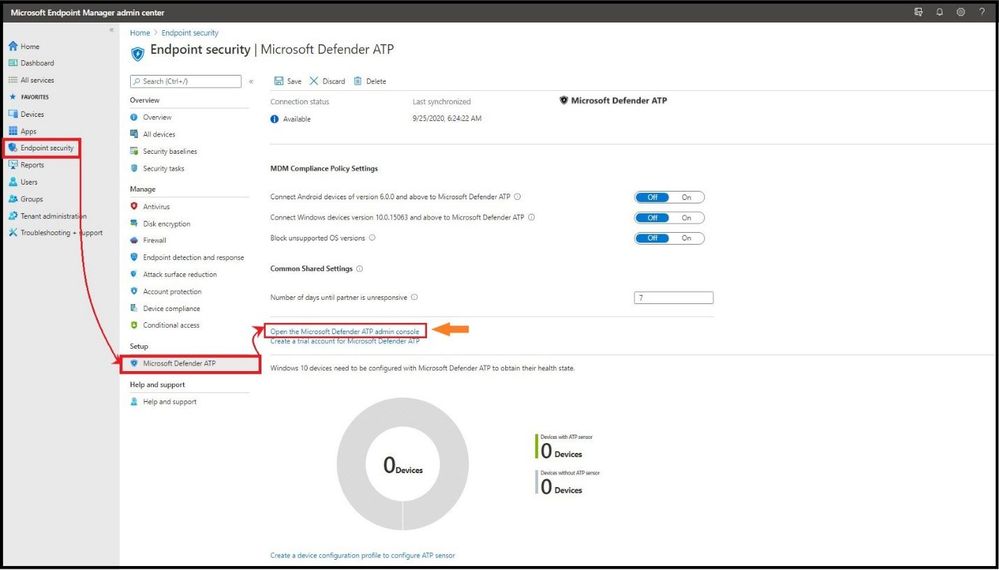
The first item you want to do is login into Microsoft Endpoint Manager admin center and select the Endpoint Security tab on the main column and then under Setup, select Microsoft Defender ATP. Under Common Share Settings select Open the Microsoft Defender ATP admin console.
 Setting up Microsoft Defender for Endpoint in MEM
This will take you straight to Microsoft Defender Security Center. On the left hand side select Settings, and then Advanced Features, and make sure Microsoft Intune connection is toggled to the on position and select Apply to save the settings.
 Turning on “Intune” in Microsoft Defender for Endpoint
When you established the connection between Intune and Microsoft Defender for Endpoint, Intune received a Microsoft Defender for Endpoint onboarding configuration package from Microsoft Defender for Endpoint. You deploy this configuration package to your Windows devices with a device configuration profile for Microsoft Defender for Endpoint.
Head back over to MEM and under the same Microsoft Defender ATP settings we will configure the MDM Compliance Policy Settings. You have three choices to choose from depending on your organization’s specific security requirements. You can choose from the following:
- Set Connect Windows devices version 10.0.15063 and above to Microsoft Defender ATP to On
- Set Connect Android devices of version 6.0.0 and above to Microsoft Defender ATP to On
- Block unsupported OS versions
If you are only connecting to a Windows device, it is only necessary to turn on the “Set Connect Windows devices version 10.0.15063 and above to Microsoft Defender ATP to On” to the on position. Once you have your organization’s configurations set to on, go ahead and select save.
 MEM Compliance Policy Settings
As you can see, the connector settings have been saved successfully as seen in the top right after selecting save with a green check mark.
 Configuration Settings Saved
After setting your organization’s configurations to On in the above steps, other applicable devices which are already being managed by Intune, as well as new devices you enroll in the future will be automatically connected to Microsoft Defender for Endpoint for the intent of compliance.
Onboarding a Windows 10 2004 Machine
For this demo, I will be onboarding Microsoft Defender for Endpoint to a new Windows 10 version 2004 machine using MEM.
The configuration package configures devices to communicate with Microsoft Defender for Endpoint services to scan files, detect threats, and other security related items.
One of the best features about the MEM and Microsoft Defender for Endpoint synchronization is after your organization onboards a device using the configuration package, you will never have to do it again.
From the MEM admin center, select Devices, Configuration profiles, + Create Profile, and select Windows 10 and later for Platform.
 Creating a Profile
Under Profile select Microsoft Defender ATP (Windows 10 Desktop), and select Create.
 Adding Defender in the Profile
This will take you to the basics page and put a good name and description of your profile and select next.
 Adding in Name and Description
For configuration settings, select the configurations that work best for your company and select next.
 Configuration Settings
For Assignments, select either all users, all devices, or all users and devices. If you have groups to exclude, select exclude and add the groups to the list and select next.
 Adding Assignment Settings
For Applicability Rules it will give you three options to choose from: Rule, Property, and Value. An example would be to create a rule that has the OS edition of WIN 10 EDU, WIN ENT, WIN 10 PRO , WIN 10 PRO EDU, and WIN 10 PRO WKS. Select next when complete.
 Selecting Which O/S Types Receive Policy
Review your new policy that you created that defined all the correct parameters in your policy before selecting create.
 Confirming Policy
As seen on the upper right, the MDATP WIN 10 Desktop profile was successfully created.
 Profile Created
Confirming The Windows Device Was Successfully Onboarded in MEM
Go to Endpoint Security, then Microsoft Defender ATP and it will show you the device (or your devices) that have been onboarded successfully with the sensor as seen below.
 Device(s) Successfully Onboarded
Confirming in Microsoft Defender Security Center
Click on https://securitycenter.windows.com/ and select Configuration Management tab on the bottom. The machines that fit the criteria based on the OS versions in the created policy will show up inside the portal as seen below.
 Microsoft Defender for Endpoint Displaying Successfully Onboarded Devices in MEM
To see the machines that were onboarded and other information, one can select the Device Inventory tab and confirm by Machine Name, Health state, and when it was last seen online to confirm.
Quick Video Demo
To see this in action, click here for a video walkthrough from a demo from Microsoft’s Product Group. Enjoy!
Conclusion
Thanks for taking the time to read this blog and I hope you had fun reading how to onboard WIN 10 devices to Microsoft Defender for Endpoint without downloading or deploying a package as everything is done inside MEM. This configuration that was demoed configures your devices to communicate with Microsoft Defender for Endpoint services to scan files and detect threats. The device is also configured to report to Microsoft Defender for Endpoint the devices risk level based on compliance policies you will create. Hope to see you in the next blog and always protect your endpoints!
Thanks for reading and have a great Cybersecurity day!
Follow my Microsoft Security Blogs: http://aka.ms/JohnBarbare
by Contributed | Nov 3, 2020 | Technology
This article is contributed. See the original author and article here.
We are excited to share that Azure Defender for Key Vault has been generally available since Microsoft Ignite on September 22nd, 2020! We have prepared this blog to go over the following topics:
- Introduction to Azure Defender for Key Vault
- How to enable Azure Defender for Key Vault
- How to find alerts of Azure Defender for Key Vault
- How to respond to alerts
- How to provide feedback on alerts
Azure Defender for Key Vault
Azure Key Vault is a cloud service for securely storing and accessing secure data like secrets, keys, certificates, and passwords. By compromising this data, attackers may be able to gain unauthorized access or perform lateral movement to breach other resources in the customers’ environment.
Azure Defender for Key Vault is an Azure-native threat protection service, which detects unusual and potentially harmful access to Key Vault accounts. It provides an additional layer of security intelligence for the keys, secrets and certificates stored in the Azure Key Vault by alerting you to suspicious or malicious access. This layer of security allows you to address threats without being a security expert, and without the need to manage third-party security monitoring systems.
When anomalous activities occur, Azure Defender shows alerts and optionally sends them via email to relevant members of your organization. These alerts include the details of suspicious activity and recommendations on how to investigate and remediate the threats.
More information about Azure defender for Key Vault is available here.
How to enable Azure Defender for Key Vault
Azure Defender for Key Vault can be enabled from Security Center, or from Key Vault. The pricing information is available here.
Method 1: Enable from Security Center
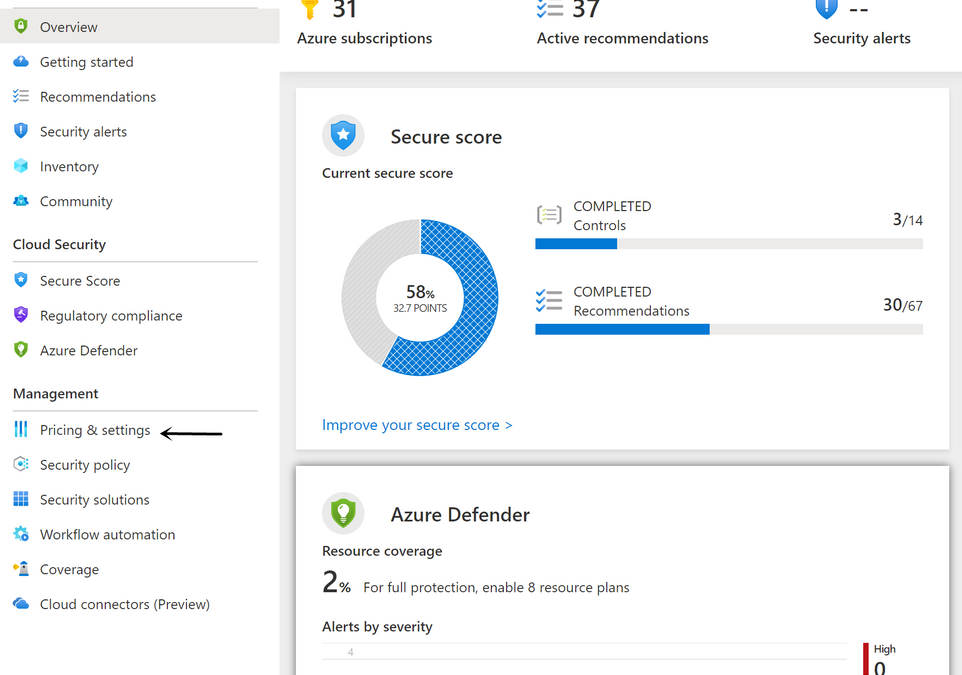
- Go to the Security Center from Azure Portal.
- From Security Center’s main menu, select Pricing & settings under Management.

- Select the subscription that you want to enable Azure Defender for Key Vault.
- Select Azure Defender to upgrade.

- Switch Azure Defender plan for Key Vault to On.
- Select Save.
Method 2: Enable from Key Vault
- Go to the target Key Vault from Azure Portal.
- From Key Vault’s main menu, select Security under Settings.

- Under Security alerts, select Try it free for the first 30 days.
- Select the subscription that you want to enable Azure Defender for Key Vault.

- Select Upgrade.
How to find alerts of Azure Defender for Key Vault
The Azure Defender for Key Vault alerts show up on Key Vault and Security Center.
- View alerts on the Key Vault’s Security page
- Go to the target Key Vault from Azure Portal.
- From Key Vault’s main menu, select Security under Settings.

- View alerts in the Security Center’s Security alerts page.
- Go to the Security Center from Azure Portal.
- From Security Center’s main menu, select Security alerts under General.

- Details on the alert page.

Here is the list of alerts that you might get from the Azure Defender for Key Vault.
How to respond to alerts
Azure Defender for Key Vault is designed to help identify suspicious activity caused by stolen credentials. Do not dismiss the alert simply because you recognize the user or application. Contact the owner of the application or the user and verify the activity was legitimate.
When you get an alert from Azure Defender for Key Vault, we recommend following this document.
How to provide feedback on alerts
Please provide your feedback for each alert on the alert page, which provides valuable input for the algorithm developers in the team to improve the quality of the alerts in the future. This feedback will not directly affect the results of the algorithm and will only be used to make long-term improvements.

- Select the answer to the question Was this useful?.
- Choose the Reason which best matches your scenario.
- Provide Additional feedback to help the service team understand more about the reason why it is useful or not.
- Select Microsoft may email me about my feedback to allow the service team to follow up by email.
- Select Submit.
You can create alert suppression rules to suppress unwanted security alerts from Azure Defender. Learn more in Suppress alerts from Azure Defender.
by Contributed | Nov 3, 2020 | Technology
This article is contributed. See the original author and article here.
Clickstream analysis is the process of collecting, analysing and reporting aggregated data about user’s journey on a website. User’s interactions with websites are collected, with applications like Adobe analytics and Tealium. Bringing clickstream data into a centralised place and combining it with other data sources for rich analytics is often required.
Typically clickstream data can reach around 2-3TB/day in size. Using Relational databases to analyse such data might not be suitable or cost effective.
Azure Data Explorer is a fast, fully managed data analytics service for real-time analysis on large volumes of Telemetry, Logs, Time Series data streaming from applications, websites, IoT devices, and more.
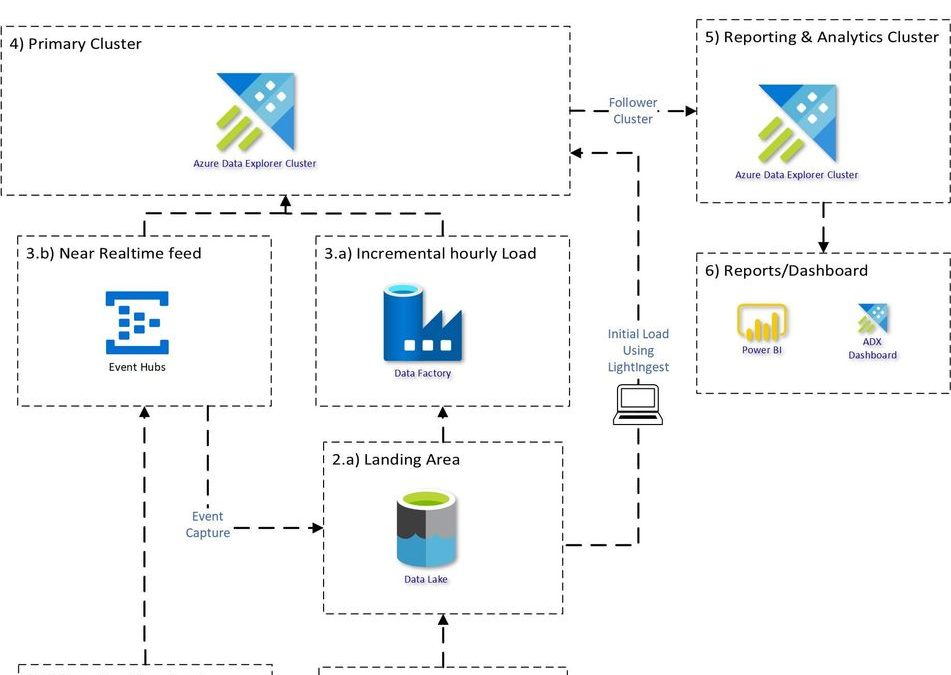
Proposed Architecture:
An end to end proposed architecture how you can use Azure Data Explorer to bring Clickstream historical and incremental data into Azure Data Explorer and analyse, aggregate and visualise the data.

Source System:
1.a) Adobe Analytics dataset usually contains about 1000+ fields. Adobe Analytics provides Data feed functionality which can be used to extract the data to Azure Data Lake Store. Data can be extracted with different configurations:
- Frequency: daily or hourly
- Format: .zip or .gz format
- Files: Single vs Multiple
1.b) Tealium datasets are extracted in JSON structure with 100’s of nested fields. The data can be sent to Azure Event hub in near realtime.
Bringing Data into ADX:
Creating the table structure and mapping for 1000+ column is a cumbersome task, it can be made easy with 1 Click Ingestion.
There are multiple ways to load the data.
3) Historical Load using Lightingest:
LightIngest is a command-line utility for ad-hoc data ingestion into Azure Data Explorer.
Simplest and efficient way to load all the historical data, with just one command.
LightIngest.exe "https://ingest-<<ClusterName.ClusterRegion>>.kusto.windows.net;Fed=True" -database:<<DatabaseName>> -table:<<TableName>> -source:" https://<<StorageName>>.blob.core.windows.net/<<ContainerName>>;<<StorageAccountKey>> " -prefix:"<<FolderPath>>" -pattern:*.tsv.gz -format:tsve
Although adobe files are in TSV format but due to special characters in the files, you should use the format TSVE in ADX.
Similarly, for Tealium historical load, use Json format.
Incremental Load:
3.a)
For Adobe batch file loading subscribe to eventgrid.
Alternatively, ADF is useful for loading because you can easily control the loading flow, and manage all your ETL or ELT pipelines from a single tool. Example pipeline (Template attached)

.ingest command:
.ingest into table @{pipeline().parameters.tableName} (h'abfss://@{variables('containerName')}@{pipeline().parameters.storageName}.dfs.core.windows.net/@{variables('folderPath')}/@{pipeline().parameters.fileName};@{activity('GetAccountKeyFromKV').output.value}') with (format='tsve',ingestIfNotExists = '["@{pipeline().parameters.fileName}"]', tags = '["ingest-by:@{pipeline().parameters.fileName}"]',creationTime='@{variables('inputFileDateTime')}')
3.b) For Tealium real time streaming connect Eventhub to ADX table:
4) Expected Compression ratio:
Source
|
Data Size
|
Input Format
|
ADX Mapping Format
|
Expected Data Size in ADX
|
Adobe Analytics
|
XX – TB
|
TSV
|
TSVE
|
XX/10 TB (10x Compression)
|
Tealium
|
XX – TB
|
JSON
|
JSON
|
XX/3.5 TB (3.5x Compression)
|
5) Querying & Analytical workload:
The Analytical work requires more compute but is usually required at working hours. Using a follower cluster will make it easy to pause/resume and optimise for read workload. This will be useful for charge back to different groups and will provide workload isolation.
Cluster pause/resume can be done using Logic app or Azure Automation.
Estimated Cluster Size:
The cluster size will depend on the daily data ingestion and how many days needs to be retained in hot cache. You can estimate your cluster size based on your requirements.
Costing for 2TB daily load with 10x compression.

You can monitor your workload and adjust your cluster accordingly.
by Contributed | Nov 3, 2020 | Technology
This article is contributed. See the original author and article here.
Hi Team, Eric Jansen here – I’m a Platforms Customer Engineer with some interesting scenarios that I’ll be sharing over the coming months, mostly revolving around the topic of On-Premises DNS. Today’s topic will be a very specific scenario regarding DNS Policy. DNS Policy has been around since the debut of Windows Server 2016 and it was a massive leap forward in functionality for Windows On-Prem DNS. There’s plenty of content regarding that topic, so that’s not what I’ll be talking about today, but if you want an overview, check out the following:
https://docs.microsoft.com/en-us/windows-server/networking/dns/deploy/dns-policy-scenario-guide
More specifically, today’s topic is regarding the removal of DNS Query Resolution Policies (or from here forward ‘QRPs’ – ‘Query Resolution Policies’ is a lot of typing  ) in large scale. To provide some context, a number of my customers use DNS as one of their methods for blocking their clients from getting to unwanted domains that may have been identified as malicious or go against corporate policy, or whatever the reason may be. With that said, there are customers that have hundreds of thousands of these policies to block hundreds of thousands of domains. So now comes the inevitable question, when they first try to remove all the policies in doing their initial testing with so many policies – Why is it so ridiculously slow to remove my Query Resolution Policies!?
The answer to that is… Well, it depends. It depends on how you attempted to remove them.
With that said, let’s look at a scenario in the lab using a domain joined member server that has the DNS Role installed, where customer X is trying to remove, let’s say 50,000 QRPs. Below are some options and we’ll measure the time it takes for each option to complete, but first a Pro Tip:
Pro Tip: Incase this is your first rodeo – Always test in a lab first and have a thorough understanding of what you’re doing before making production changes. When you do make your changes, in your lab and in production, have a backout plan.
Option 1:
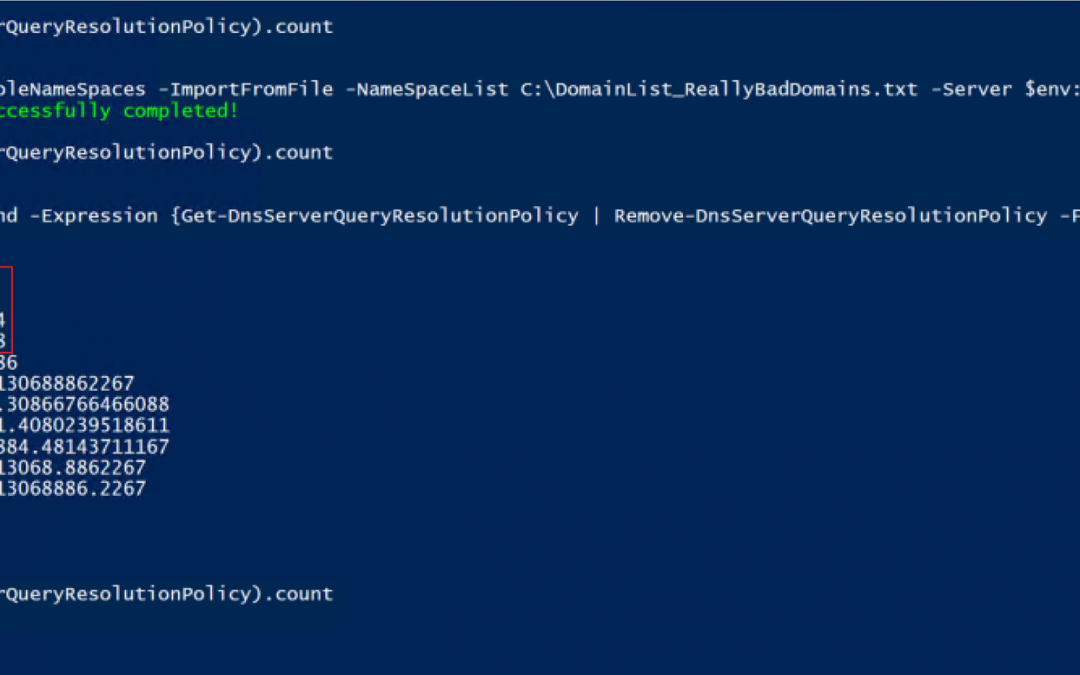
Get-DNSServerQueryResolutionPolicy | Remove-DNSServerQueryResolutionPolicy -Force
Sounds logical to me…but unfortunately this doesn’t work for all scenarios, especially if you have a very large number of domains.
Eventually, at least in all of my testing, it’ll fail and throw an exception ID of Win32 167. If you dig into the exception further ($Error[0].Exception.ErrorData) it translates to “Unable to lock a region of a file.” This can happen due to a timeout thread that does the re-arrangement of the policies, that can block the addition or creation of policies due to a read lock, when too many changes are being made at once.
Timer: N/A – Fail..
Yeah, so it sounds like more than one thing is trying to be changed at the same time and it’s not happy. I know, this is not fun for anyone.. Ok, lets throttle it back a bit – quite literally.
Option 2:
Get-DNSServerQueryResolutionPolicy | Remove-DNSServerQueryResolutionPolicy -Force -ThrottleLimit 1
OK, so we start to look at additional parameters for Remove-DNSServerQueryResolutionPolicy and find the -ThrottleLimit parameter that shows the following description:
“Specifies the maximum number of concurrent operations that can be established to run the cmdlet. If this parameter is omitted or a value of 0 is entered, then Windows PowerShell® calculates an optimum throttle limit for the cmdlet based on the number of CIM cmdlets that are running on the computer. The throttle limit applies only to the current cmdlet, not to the session or to the computer.”
So, if you have concurrent operations happening, but some operation needs to be changed before another operation can occur, maybe this will help? Yep, the ThrottleLimit value maintains the order of processing policies into the pipeline, so it essentially serializes the data going through the pipeline (at least in our scenario with the ThrottleLimit value being 1) without the need to collect the data first and then use a foreach loop (as an example), getting all policies and for each one, removing it.
OK, so, let’s see what happens.

Well played…. It now works with no exceptions being thrown! But the excitement wears off pretty quickly, and you’re learning the hard way that unfortunately, now it takes forever. So now instead of throwing exceptions you’re ready to throw your keyboard in frustration. It took 31 hours, 24 minutes and 28 seconds to complete…. That’s no good, so let’s see if we can figure something else out.
Option 3:
Get-DNSServerQueryResolutionPolicy | Sort ProcessingOrder -Descending |
Remove-DNSServerQueryResolutionPolicy -Force

We have now outsmarted the system! But why is this faster??
Well, consider the following. When you do a Get-DNSServerQueryResolutionPolicy you’ll notice that it returns the list sorting it based on the processing order. OK, so what happens if I remove the QRP that is assigned to ‘ProcessingOrder’ 1? Yep, the other 49,999 policies are now moved up in processing order, and then the next policy is removed, which now has ‘ProcessingOrder’ 1, so the remaining 49,998 policies have to have their ‘ProcessingOrder’ modified, and so on, until they’re all gone. OK, so let’s do the math on that for 50,000 QRPs that need to get removed using ‘Option 2′.
After about six hours of using calc.exe, my fingers started to get tired of entering in the numbers into the calculator: 49,999 + 49,998 + 49,997 + 49,996 + 49,995 etc.; So I decided that I’d figure it out with PowerShell instead. (Ok, I may have lied – the thought of entering 50,000 values into the calculator never once crossed my mind.)
$ProcessingOrder = 1..50000
$i = 0
$j = 0
Foreach($Order in $ProcessingOrder){
$i++
$($j += $($ProcessingOrder.count - $i))
}

Write-Host "Number of Processing Order Changes that will need to take place with 'Option 2':"
Write-Host "$('{0:N0}' -f $j)" -ForegroundColor Red
Running the snippet of code above will return this:

So, if the calculation that my code does above is correct, then…that’s a lot of changes that need to take place, and that is the answer to why it’s so ridiculously slow.
Option 3 on the other hand removes the policies in reverse processing order, so that no other policies need to have the ‘ProcessingOrder’ value modified for them – I’m sure most admins would prefer this methodology, of only having to make 50 thousand changes (just deletes), vs. just shy of 1.25 BILLION processing order changes…plus the 50 thousand deletes.
Now you may have noticed that I did leave the -ThrottleLimit parameter off of Remove-DNSServerQueryResolutionPolicy so it’s technically still removing more than one at a time, and not necessarily in the exact reverse order, as evident from the Audit log. Option 2, however, was going exactly in ascending order, and it would take on average 5 second to delete each policy in the beginning (based on the audit log timestamps).
Just because it’s you guys though, and I because I know you’re curious, I shimmed in an Option 3.5, just to test the time of doing it in reverse order, but this time setting the throttle limit to 1.
Option 3.5:
Get-DnsServerQueryResolutionPolicy | Sort-Object ProcessingOrder -Descending |
Remove-DnsServerQueryResolutionPolicy -Force -ThrottleLimit 1

Well, it’s not going to win any speed records at the racetrack, but it’s not that bad. I’ll take this over ‘Option 2′ all day long.
But WHAT IF….we could do one better?? WHAT IF, you really had that need for speed? Well team, let me introduce you to the high speed, low drag, ‘Option 4′.
Option 4:
Stop-Service DNS
Get-Item ‘HKLM:SOFTWAREMicrosoftWindows NTCurrentVersionDNS ServerPolicies’ |
Remove-Item -Recurse -Force
Start-Service DNS

From a speed perspective we have a winner…but you have to take the service down, so I’m not a fan of that, but if you have a lot of resolvers, it may not matter to you..
Specs:
For those that are interested, the testing was done on a Windows Server 2019 (Ver 1809) VM that was running on a Windows Server 2019 (Ver 1809) Hyper-V box. The VM has the following hardware configuration:

The Hyper-V host is an old Dell R610.
Side note: The test scenarios above were more memory intensive than CPU, I just used an existing DNS server that I had laying around and it just happened to have 24 CPUs already on it  . Regardless of the numbers that I posted for the test scenarios above, everyone’s mileage will vary, and the point of the article wasn’t to give exact numbers, but to show the difference in time that it takes depending on the approach that’s taken to remove the QRPs.
Until next time..
Disclaimer:
The content above contains a sample script. Sample scripts are not supported under any Microsoft standard support program or service. The sample scripts are provided AS IS without warranty of any kind. Microsoft further disclaims all implied warranties including, without limitation, any implied warranties of merchantability or of fitness for a particular purpose. The entire risk arising out of the use or performance of the sample scripts and documentation remains with you. In no event shall Microsoft, its authors, or anyone else involved in the creation, production, or delivery of the scripts be liable for any damages whatsoever (including, without limitation, damages for loss of business profits, business interruption, loss of business information, or other pecuniary loss) arising out of the use of or inability to use the sample scripts or documentation, even if Microsoft has been advised of the possibility of such damages.
by Contributed | Nov 3, 2020 | Technology
This article is contributed. See the original author and article here.
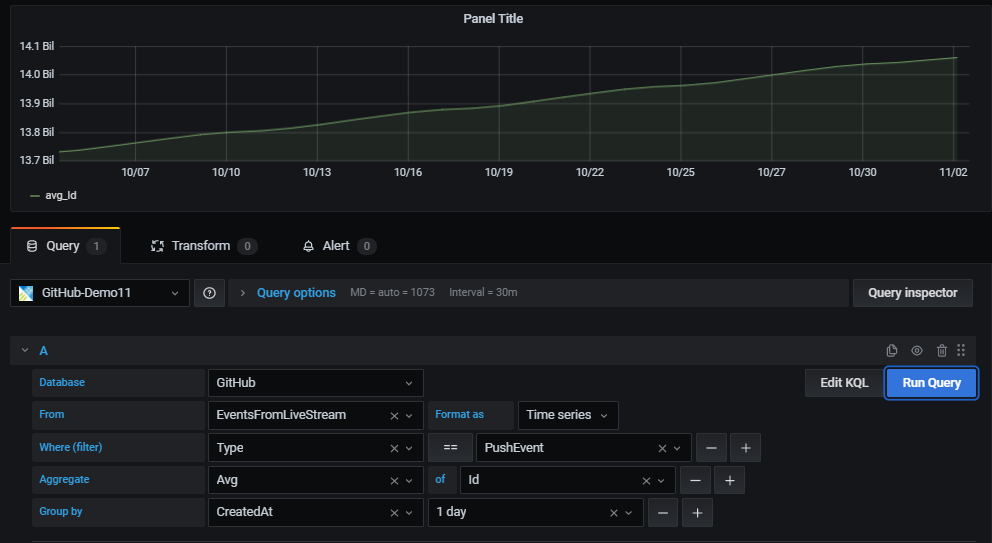
Recently Grafana team added a new query builder experience that allows business users to create dashboard panels with no KQL queries.
All that is needed to create a new panel, is using simple drop-down controls. The new experience offers an easy and intuitive way to select columns, aggregation functions and filter values to analyze and visualize your data.

Prerequisites
Azure Data Explorer (Grafana) plugin version 3.2.1 or later.
Visualize
Once you have configured a datasource, use a new or an existing dashboard to create a new panel.
In the panel first select the datasource, database and table.
For the selected table, use the UI controls to easily filter, aggregate and group the data and present the result set in the panel.
Filter
Adding filters has never been easier – start with the plus sign (+) to the right of the “Where (filter)” control.
Then select the filter column from the list of table columns, select the comparison operator and type in the value to filter by.

Data aggregation
The aggregate control is used for selecting the aggregation type and also the columns to use for aggregating (optional).
One or more aggregations can be set.
This is equivalent to KQL summarize operator.

Data grouping
The “Group by” control allows users to select one or more columns to arrange the values into groups and label each series differently (with “config overrides”).
This is equivalent to the “by” expression in KQL summarize operator.

Auto-generated KQL query
While creating a panel with the query editor a KQL query is being automatically generated at the bottom of the screen.
The purpose of the query is to show the exact representation of the logic the user constructs with the graphical query editor.
In addition, the user can take the generated query and further enhance it by clicking the “Edit KQL” button to the left of “Run Query” button.
By clicking “Edit KQL” the user will move to the “Raw mode” and he will be able to use the flexibility and power of KQL to finetune his query.

Time shift
This new capability allows easy and intuitive construction of time shifted panels to compare 2 equivalent time periods.
Enabling time shift and defining the duration of the shift is available with the new time shift drop-down below the query.
For example, you can use the same query with 1-week time shift to get a WoW view of your data.

Looking forward for your feedback in GitHub,
Enjoy

Recent Comments