by Contributed | Mar 9, 2021 | Technology
This article is contributed. See the original author and article here.
Welcome to our first post in the “Microsoft Cloud App Security: The Hunt” blog series!
Using Microsoft 365 Defender, our integrated solution, we will address common alerts customers receive in Microsoft Cloud App Security (called “MCAS” by users and enthusiasts) to determine the full scope and impact of a threat. We will show case how Microsoft 365 Defender assists security engineers by providing critical details such as how the threat entered the environment, what it has affected and how it is currently impacting the enterprise.
We will do this by taking the details we are given from an alert from Cloud App Security, using Kusto Query Language or KQL to query logs from various products across the Microsoft security stack that are available in Microsoft 365 defender Advanced hunting today.
Additionally, we will use the mapping of the MITRE ATT&CK Framework tactics and techniques available in Cloud App Security to assist our investigation on where or how an adversary may move next.
Throughout this blog series, we will address the alerts and scenarios we have seen most frequently from customers and apply simple but effective queries that can be used in everyday investigations.
To begin this exciting journey, our first use case will walk you through a possible investigation path you could follow once receiving a multi-stage incidents from Cloud App Security.
Use case
Contoso implemented Microsoft 365 and is monitoring users at risk using Microsoft’s security solutions.
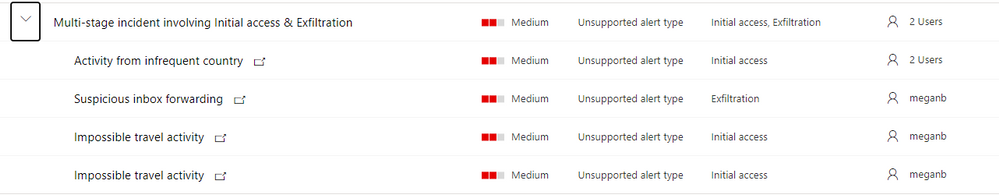
While reviewing the new incidents, our security analyst notices a new multi-staged incident for a user named Megan Bowens.
Multi-stage incident
By opening the incident, our analyst can immediately identify the incident alerts and the mapped MITRE tactics. Based on those, it looks like the user account might have been compromised. Let’s confirm this using M365 Defender!

Investigation
Step 1: review the alerts to understand the incident context
By looking at the timeline, it seems that the user connected from a location she did not use in the last six months (Activity from infrequent country:( Romania.

Microsoft then triggered an out-of-the-box alert regarding activities from distant locations (Impossible travel activity). Using the information from this alert, admins can review activities from anywhere in the world: Belgium, Romania but also Belarus!

Finally, it appears that during this session, the user created an inbox rule forwarding emails to , which is considered as suspicious Microsoft Cloud App Security.

Now that we understand the context, let’s investigate to understand the scope of the breach.
Step 2: understand a user’s specific context
Before spending time in logs, we must understand the user’s context. The easiest way is to open her user page and review the provided information:

On the user page, we are immediately provided information confirming that something happened with this user account: Megan’s account is considered a high risk by Azure Active Directory and her suddenly increased in the last few days, plus her score is higher thf the organization. We can also see from this page that she’s located United States.

To understand her habits, let’s open the Locations details:

This shows us the different locations used by the user in the last 30 days and the percentage of activities performed from those locations.
It immediately appears that she is usually working from the US and Belgium, so activities performed from those countries are normal:

If we go further, we can also see that some activities have been performed from other locations: Romania and Belarus:


is anomalous behavior for Megan (bases on the information above and her tracked “Locations” in her user profile), let’s hunt!
Step 3: review the suspicious activities to understand the scope of the breach
Our investigation will go through in different phases (list non-exhaustive).
Action
|
Why ?
|
Summarize all the performed actions from the suspicious IP/location for that account
|
Understand the risk based on performed activities (ex: reading an email = low risk, downloading/sharing files = medium risk, creating inbox rule/admin activities = high risk).
If low risk activities, from mobile device for example, no further investigation might be required as this could be the user using a VPN client on her phone.
|
Provide details on all accessed emails and their path in the mailbox
|
Understand if access was targeted to sensitive information (finance, secrets, …).
If the information seems sensitive and the device type seems suspicious, further investigation required.
Also review the user agent to identify suspicious access.
|
If emails were sent, review the recipients and message details.
|
Identify potential phishing attempts or identify other compromised accounts.
We will also use the user agent to identify potential tools using Graph API or SMTP.
|
Review the accessed files
|
Understand if access was targeted to sensitive information (finance, secrets, …).
|
Review the created inbox rules
|
Inbox rules can be used to exfiltrate data or hide conversations between the attacker and other recipients.
|
Review other users using this IP address
|
Identify potential compromised users or identify new potential corporate IP address used by a new office.
|
- Obtain the user’s account object Id.
The Azure AD Account object ID is the unique identifier of a user account. Therefore, we will use this identifier for hunting scenarios as it is exposed in the different tables. You can get the user’s account object ID from the user entity page (screenshot below), or by querying the IdentityInfo table:

Querying the table:
IdentityInfo | where AccountUpn =~ 'meganb@seccxp.ninja'

Review our user’s signings to identify other potential suspicious locations or IP addresses.
Using this query, you can get an overview of the users signing activity and identify potential anomalies. Note that if the user is using an AAD joined device and passing through a conditional access policy, the details of the managed device are exposed:
let timeToSearch = startofday(datetime('2020-11-14'));
AADSignInEventsBeta
| where AccountObjectId == 'eababd92-9dc7-40e3-9359-6c106522db19' and Timestamp >= timeToSearch
| distinct Application, ResourceDisplayName, Country, City, IPAddress, DeviceName, DeviceTrustType, OSPlatform, IsManaged, IsCompliant, AuthenticationRequirement, RiskState, UserAgent, ClientAppUsed

.
Using this Advanced hunting query scoped to the alerts date, we can easily identify the performed actions:
let accountId = 'eababd92-9dc7-40e3-9359-6c106522db19';
let locations = pack_array('RO', 'BY');
let timeToSearch = startofday(datetime('2020-11-14'));
CloudAppEvents
    | where AccountObjectId == accountId and CountryCode in (locations) and Timestamp >= timeToSearch
| summarize by ActionType, CountryCode, AccountObjectId
| sort by ActionType asc
We can see that the malicious actor accessed and deleted emails, opened files, created and deleted inbox rules.
That’s a great start! We know now what we are looking for.

- Review the accessed emails.
To understand what the actor was looking for, we can use the following query. It’s using events available with advanced auditing and the EmailEvents table to enrich emails details (subject, sender, recipients, …) when possible.
let accountId = 'eababd92-9dc7-40e3-9359-6c106522db19';
let locations = pack_array('RO', 'BY');
let timeToSearch = startofday(datetime('2020-11-14'));
CloudAppEvents
    | where ActionType == 'MailItemsAccessed' and CountryCode in (locations) and AccountObjectId == accountId and Timestamp >= timeToSearch
    | mv-expand todynamic(RawEventData.Folders)
    | extend Path = todynamic(RawEventData_Folders.Path), SessionId = tostring(RawEventData.SessionId)
    | mv-expand todynamic(RawEventData_Folders.FolderItems)
    | project SessionId, Timestamp, AccountObjectId, DeviceType, CountryCode, City, IPAddress, UserAgent, Path, Message = tostring(RawEventData_Folders_FolderItems.InternetMessageId)
    | join kind=leftouter (
        EmailEvents
        | where RecipientObjectId == accountId
        | project Subject, RecipientEmailAddress , SenderMailFromAddress , DeliveryLocation , ThreatTypes, AttachmentCount , UrlCount , InternetMessageId
        ) on $left.Message == $right.InternetMessageId
| sort by Timestamp desc
Note the clients used: a browser and REST, indicating potential script accessing the emails:


- the accessed folders and files:
let accountId = 'eababd92-9dc7-40e3-9359-6c106522db19';
let locations = pack_array('RO', 'BY');
let timeToSearch = startofday(datetime('2020-11-14'));
CloudAppEvents
    | where ActionType == 'FilePreviewed' and CountryCode in (locations) and AccountObjectId == accountId and Timestamp >= timeToSearch
    | project Timestamp, CountryCode , IPAddress , ISP, UserAgent , Application, ActivityObjects, AccountObjectId
    | mv-expand ActivityObjects
    | where ActivityObjects['Type'] in ('File', 'Folder')
    | evaluate bag_unpack(ActivityObjects)

- Review the deleted emails. This might indicate that the actor tried to remove traces of discussions with other users or deletion of alerting emails:
let accountId = 'eababd92-9dc7-40e3-9359-6c106522db19';
let locations = pack_array('RO', 'BY');
let timeToSearch = startofday(datetime('2020-11-14'));
CloudAppEvents
    | where ActionType in~ ('MoveToDeletedItems', 'SoftDelete') and CountryCode in (locations) and AccountObjectId == accountId and Timestamp >= timeToSearch
    | mv-expand ActivityObjects
    | where ActivityObjects['Type'] in ('Email', 'Folder')
    | evaluate bag_unpack(ActivityObjects)
    | distinct Timestamp, AccountObjectId, ActionType, CountryCode, IPAddress, Type, Name, Id
| sort by Timestamp desc
- Review the created/enabled/modified inbox rules. You can see here that the rule if looking for specific keywords, like “Credit Card” or “Password”:
let accountId = 'eababd92-9dc7-40e3-9359-6c106522db19';
let locations = pack_array('RO', 'BY');
let timeToSearch = startofday(datetime('2020-11-14'));
CloudAppEvents
    | where ActionType contains_cs 'InboxRule' and CountryCode in (locations)
    | extend RuleParameters = RawEventData.Parameters
| project Timestamp, CountryCode , IPAddress , ISP, ActionType , ObjectName , RuleParameters
| sort by Timestamp desc

- Now is time for our latest query that will identify scope of the breach. We hunted to get more information on Megan, our impacted user we got alerted from the incident. But there might be additional compromised users, we’ll use the IP addresses from the initial breach and search for other users having activities from those IP addresses:
let accountId = 'eababd92-9dc7-40e3-9359-6c106522db19';
let locations = pack_array('RO', 'BY');
let timeToSearch = startofday(datetime('2020-11-14'));
let ips = (CloudAppEvents
        | where CountryCode in (locations )
        | distinct IPAddress , AccountObjectId
);
ips
| join (CloudAppEvents | project ActivityIP = IPAddress, UserId = AccountObjectId ) on $left.IPAddress == $right.ActivityIP
| distinct UserId
| join IdentityInfo on $left.UserId == $right.AccountObjectId
| distinct AccountDisplayName , AccountUpn , Department , Country , City, AccountObjectId

Step 4: time to remediate!
Now that we have confirmed that Megan’s account had been compromised and we confirmed she was the only impacted user, it’s time to take action.
The required actions will of course depend on your specific procedures, but a good start is confirming the user as compromised by clicking on “Take actions” or by going back to the user page and apply actions like suspending the user or requesting the user to sign-in again.


If you are syncing your accounts from Active Directory, you must perform the remediation steps on-premises.
Microsoft Cloud App Security allows you to apply remediation to those apps too.

A huge Thanks to @Tali Ash for the review!
For more information about the features discussed in this article, read:
Learn more
For further information on how your organization can benefit from Microsoft Cloud App Security, connect with us at the links below:
To experience the benefits of full-featured CASB, sign up for a free trial—Microsoft Cloud App Security.
Follow us on LinkedIn as #CloudAppSecurity. To learn more about Microsoft Security solutions visit our website. Bookmark the Security blog to keep up with our expert coverage on security matters. Also, follow us at @MSFTSecurity on Twitter, and Microsoft Security on LinkedIn for the latest news and updates on cybersecurity.
by Contributed | Mar 9, 2021 | Technology
This article is contributed. See the original author and article here.
Final Update: Tuesday, 09 March 2021 08:29 UTC
We’ve confirmed that all systems are back to normal with no customer impact as of 3/9, 07:20 UTC. Our logs show the incident started on 3/9, 06:40 UTC and that during the 40 minutes that it took to resolve the issue some of the customers may have experienced intermittent data latency, data access and missed or delayed alerts in West Europe region.
- Root Cause: The failure was due to a backend dependency.
- Incident Timeline: 40 Minutes – 9/3, 06:40 UTC through 9/3, 07:20 UTC
We understand that customers rely on Azure Log Analytics as a critical service and apologize for any impact this incident caused.
-Soumyajeet
by Contributed | Mar 9, 2021 | Technology
This article is contributed. See the original author and article here.
In this new episode of Azure Unblogged I had the chance to speak to Michael Flanakin, Principal Product Manager of Azure Cost Management.
During our chat Michael and I explored the attitudes organizations have when dealing with cloud cost management and how they are using Azure Cost Management to help them. We also explored the best way to keep up to date with all the features and functionality within Azure Cost Management and the best learning resources.
You can watch the video here or on Channel 9.
Resources:
– Learn how to use Azure Cost Management to control your Azure spend and manage bills
– Keep up to date with the latest news relating to Azure Cost Management
– Azure Cost Management and Billing 2020 year in review
by Contributed | Mar 9, 2021 | Technology
This article is contributed. See the original author and article here.
In this installment of the weekly discussion revolving around the latest news and topics on Microsoft 365, hosts – Vesa Juvonen (Microsoft) | @vesajuvonen, Waldek Mastykarz (Microsoft) | @waldekm are joined by Belgium-based Senior Service Engineer from Microsoft – Bert Jansen | @o365bert.
Bert splits his time coaching ISVs and Partners on how to get the most out of their SharePoint Online experience and on PnP Community projects – Modernization and PnP Core SDK. This episode’s discussion focuses on why Partners and ISVs would be interested in Microsoft 365 – the Intelligent file handling platform, on-site migrations – on-prem to cloud – classic to modern, and on modern pages – APIs, Microsoft Graph and PnP Core SDK.
A blog busting 23 articles and videos were published by Microsoft and Community members in the last week.
This episode was recorded on Monday, March 8, 2021.
These videos and podcasts are published each week and are intended to be roughly 45 – 60 minutes in length. Please do give us feedback on this video and podcast series and also do let us know if you have done something cool/useful so that we can cover that in the next weekly summary! The easiest way to let us know is to share your work on Twitter and add the hashtag #PnPWeekly. We are always on the lookout for refreshingly new content. “Sharing is caring!”
Here are all the links and people mentioned in this recording. Thanks, everyone for your contributions to the community!
Microsoft articles:
Community articles:
Additional resources:
If you’d like to hear from a specific community member in an upcoming recording and/or have specific questions for Microsoft 365 engineering or visitors – please let us know. We will do our best to address your requests or questions.
“Sharing is caring!”
by Contributed | Mar 9, 2021 | Technology
This article is contributed. See the original author and article here.
In this tutorial you will learn how to use ingestion metrics to monitor Batching ingestion to ADX in Azure portal.
Background
Batching ingestion is one of the methods to ingest data to ADX. Using this method, ADX batches received ingress data chunks to optimize ingestion throughput. The data is batched based on a batching policy defined on the database or on the table. ADX uses a default values of 5 minutes as the maximum delay time, 1000 items and a total size of 1G for batching. The batching ingestion goes through several stages, and there are specific components responsible for each of these steps:
- For Event Grid, Event Hub and IoT Hub ingestion, there is a Data Connection that gets the data from external sources and performs initial data rearrangement.
- The Batching Manager batches the received references to data chunks to optimize ingestion throughput based on a batching policy.
- The Ingestion Manager sends the ingestion command to the ADX Storage Engine.
- The ADX Storage Engine stores the ingested data so it is available for query.
Monitoring the batching ingestion, you can get information such as ingestion results, the amount of ingested data, the latency of the ingestion and the batching process itself. When analyzing the amount of data passing through ingestion and the ingestion latency, it is possible to split metrics by Component Type to better understand the performance of each of the batching ingestion steps.
After reading this tutorial you will know how to answer the following questions:
- How can I see the result of my ingestion attempts?
- How much data was processed by the ingestion pipeline?
- What is the latency of the ingestion process and did latency built up in ADX pipeline or upstream to ADX?
- How can I better understand the batching process of my cluster during ingestion?
- When working with Event Hub, Event Grid and IoT Hub ingestion, how can I compare the number of events arrived to ADX to the number of events sent for ingestion?
Related articles:
Navigate to the cluster metrics pane and configure the analysis timeframe
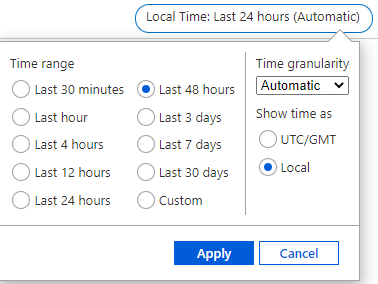
In this tutorial, we are analyzing data ingestion to ADX during the last 48 hours:
- Sign in to Azure portal and navigate to your cluster overview page.
- In the left-hand pane of your ADX cluster, search for metrics.
- Select Metrics to open the metrics pane and begin analysis on your cluster.
- In the upper right corner above the chart, click on the time selector:

- Select the desired timespan for metrics analyzing (in this example, last 48 hours), then select Apply:
Ingestion result
The Ingestion Result metric gives information about the total number of sources that either failed or succeeded to be ingested. Splitting the metric by status, you can get detailed information about the status of the ingestion operations.
Note:
- Using Event Hub or IoT Hub ingestion events are pre-aggregated into one blob, and then treated as a single source to be ingested. Therefore, pre-aggregated events appear as a single ingestion result after pre-aggregation.
- Transient failures are retried internally to a limited number of attempts. Each transient failure is reported as a transient ingestion result. Therefore, a single ingestion may result with more than one ingestion result.
- In the metrics pane select the following settings:

Settings
|
Suggested Value
|
Field Description
|
Scope
|
<Your Cluster Name>
|
The name of the ADX cluster
|
Metric Namespace
|
Kusto Cluster Standard Metrics
|
A namespace which is the category for the metric
|
Metric
|
Ingestion result
|
The metric name
|
Aggregation
|
Sum
|
The aggregated function by which the metrics are aggregated over time. To better understand aggregation see Changing aggregation
|
- You can now see the number of ingestion sources (that either failed or succeeded to be ingested) over time:

- Select Apply splitting above the chart:

- Choose the Status dimension to segment your chart by the status of the ingestion operations:

- After selecting the splitting values, click away from the split selector to close it. Now the chart shows how many ingestion sources were tried to be ingested over time, and the status of the ingestions. There are multiple lines, one for each possible ingestion result.

- In the chart above, you can see 3 lines: blue for successful ingestion operations, orange for ingestion operations that failed due to “Entity not found” and purple for ingestion operations that failed due to “Bad request”.
- The error in the chart represents the category of the error code. To see the full list of ingestion error codes by categories and better understand the possible error reason see Ingestion error codes in Azure Data Explorer.
- To get more details on an ingestion error, you can set failed ingestion diagnostic logs. (take into account that logs emission results with creation of additional resources, and therefore costs money).
The amount of ingested data:
The Blobs Processed, Blobs Received and Blobs Dropped metrics give information about the number of blobs that were processed by ingestion components.
- In the metrics pane select the following settings:

Settings
|
Suggested Value
|
Field Description
|
Scope
|
<Your Cluster Name>
|
The name of the ADX cluster
|
Metric Namespace
|
Kusto Cluster Standard Metrics
|
A namespace which is the category for the metric
|
Metric
|
Blobs Processed
|
The metric name
|
Aggregation
|
Sum
|
The aggregated function by which the metrics are aggregated over time. To better understand aggregation see Changing aggregation
|
- Select Apply splitting above the chart:

- Select the Component Type dimension to segment the chart by different components through ingestion:

- If you want to focus on a specific database of your cluster, select Add filter above the chart:

- Select the database that you want to analyze (this example shows filtering out blobs sent to the GitHub database):

- After selecting the filter values, click away from the Filter Selector to close it. Now the chart shows how many blobs that are sent to GitHub database were processed at each of the ingestion components over time:

- In the chart above you can see that on February 13 there is a decrease in the number of blobs that were ingested to GitHub database over time. You can also see that the number of blobs that were processed at each of the components is similar, meaning that approximately all data processed in the data connection was also processed successfully by the batching manager, by the ingestion manager and by the storage engine. Therefore, this data is ready for query.
- To better understand the relation between the number of blobs that were received at each component and the number of blobs that were processed successfully at each component, you can add a new chart to describe the number of blobs that were sent to GitHub database and were received at each component.
- Above the Blob processed chart, select New chart:

- Select the following settings for the new chart:

- Return the split and filter steps above to split the Blob Received metric by component type and filter only blobs sent to GitHub database. You can now see the following charts next to each other:

- Comparing the charts, you can see that the number of blobs that were received on each component is like the number of blobs that were processed. That is means that approximately there are no blobs that were dropped during ingestion.
- You can also analyze the Blob Dropped metric following the steps above to see how many blobs were dropped during ingestion and to detect whether there is problem in processing at specific component during ingestion. For each dropped blob you will also get an Ingestion Result metric with more information about the failure reason.
Ingestion latency:
Note: According to the default batching policy, the default batching time is 5 minutes. Therefore, the expected latency of ~5 minutes using the default batching policy.
While ingesting data to ADX, it is important to understand the ingestion latency to know how much time passes until data is ready for query. The metrics Stage Latency and Discovery Latency aimed to monitor ingestion latency.
The Stage Latency indicates the timespan from when a message is discovered by ADX, until its content is received by an ingestion component for processing. Stage latency filtered by the Storage Engine component indicates the total ADX ingestion time until data is ready for query.
The Discovery Latency is used for ingestion pipelines with data connections (Event Hub, IoT Hub and Event Grid). This metric gives information about the timespan from data enqueue until discovery by ADX data connections. This timespan is upstream to ADX, and therefore it is not included in the Stage Latency that measures only latency in ADX.
When you see a long latency until data is ready for query, analyzing Stage Latency and Discovery Latency can help you to understand whether the long latency is because of long latency in ADX or upstream to ADX. If the long latency is in ADX, you can also detect the specific component responsible for the long latency.
- In the metrics pane select the following settings:

Settings
|
Suggested Value
|
Field Description
|
Scope
|
<Your Cluster Name>
|
The name of the ADX cluster
|
Metric Namespace
|
Kusto Cluster Standard Metrics
|
A namespace which is the category for the metric
|
Metric
|
Stage Latency
|
The metric name
|
Aggregation
|
Avg
|
The aggregated function by which the metrics are aggregated over time. To better understand aggregation see Changing aggregation
|
- Select Apply splitting above the chart:

- Select the Component Type dimension to segment the chart by different components through ingestion:

- If you want to focus on a specific database of your cluster, select Add filter above the chart:

- Select which database values you want to include when plotting the chart (this example shows filtering out blobs sent to GitHub database):

- After selecting the filter values, click away from the Filter Selector to close it. Now the chart shows the latency of ingestion operations that are sent to GitHub database at each of the components through ingestion over time:

- In the chart above, you can see that the latency at the data connection is approximately 0 seconds. It makes sense since the Stage Latency measures only latency from when a message is discovered by ADX.
- You can also see that the longest time passes from when the Batching Manager received data to when the Ingestion Manager received data. In the chart above it took around 5 minutes as we used a default Batching Policy for the GitHub database and the default time for batching policy is 5 minutes. We can conclude that apparently the sole reason for the batching was time. You can see this conclusion in detail in the section about Understanding Batching Process.
- Finally, looking at the StorageEngine latency in the chart, represents the latency when receiving data by the Storage Engine, you can see the average total latency from the time of discovery data by ADX until data is ready for query. In the graph above it is 5.2 minutes on average.
- If you use ingestion with data connections, you may want to estimate the latency upstream to ADX over time as long latency may also be because of long latency before ADX actually gets the data for ingestion. For that purpose, you can use the Discovery Latency metric.
- Above the chart you have already created, select New chart:

- Select the following settings to see the average Discovery Latency over time:

- Return the split steps above to split the Discovery Latency by Component Type which represents the type of the data connection that discovers the data.
- After selecting the splitting values, click away from the split selector to close it. Now you have a chart for Discovery Latency:

- You can see that almost all the time, the discovery Latency is close to 0 seconds means that ADX got data immediately after data enqueue. The highest peak of around 300 milliseconds is around February 13 at 14:00 AM means that at this time ADX cluster got the data around 300 milliseconds after data enqueue.
Understand the Batching Process:
The Batch blob count, Batch duration, Batch size and Batches processed metrics aimed to provide information about the batching process:
Batch blob count: Number of blobs in a completed batch for ingestion.
Batch duration: The duration of the batching phase in the ingestion flow.
Batch size: Uncompressed expected data size in an aggregated batch for ingestion.
Batches processed: Number of batches completed for ingestion.
- In the metrics pane select the following settings:

Settings
|
Suggested Value
|
Field Description
|
Scope
|
<Your Cluster Name>
|
The name of the ADX cluster
|
Metric Namespace
|
Kusto Cluster Standard Metrics
|
A namespace which is the category for the metric
|
Metric
|
Batches Processed
|
The metric name
|
Aggregation
|
Sum
|
The aggregated function by which the metrics are aggregated over time. To better understand aggregation see Changing aggregation
|
- Select Apply splitting above the chart:

- Select the Batching Type dimension to segment the chart by the batch seal reason (whether the batch reached the batching time, data size or number of files limit, set by batching policy):

- If you want to focus on a specific database of your cluster, select Add filter above the chart:

- Select which database that you want to analyze (this example shows filtering out blobs sent to GitHub database):

- After selecting the filter values, click away from the Filter Selector to close it. Now the chart shows the number of sealed batches with data sent to GitHub database over time, split by the Batching type:

- You can see that there are 2-4 batches per time unit over time, and all batches are sealed by time as estimated in the Stage latency section where you can see that it took around 5 minutes to batch data based on the default batching policy.
- Select Add Chart above the chart and return the filter steps above to create additional charts for the Batch blob count, Batch duration and Batch size metrics on a desired database. Use Avg aggregation while creating these metric charts.


From the charts you can conclude some insights:
- The average number of blobs in the batches is around 160 blobs over time, then it decrease to 60-120 blobs. As we have around 280 processed blobs over time on February 14 in the batching manager (see The amount of data ingested section) and 3 processed batch over time, it indeed makes sense. Based on the default batching policy, batch can seal when blob count is 1000 blobs. As we don’t reach 1000 blobs in less than 5 minutes, we indeed don’t see batches sealed by count.
- The average batch duration is 5 minutes. Note that the default batching time defined in the batching policy is 5 minutes, and it may significantly affect the ingestion latency. On the other hand, you should consider that too small batching time may cause ingestion commands to include too small data size and reduce ingestion efficiency as well as requesting post-ingestion resources to optimize the small data shards produced by non-batched ingestion.
- In the batch size chart, you can see that the average size of batches is around 200-500MB over time. Note that the optimal size of data to be ingested in bulk is 1 GB of uncompressed data which is also defined as a seal reason by the default batching policy. As there is no 1GB of data to be batched over 5 minutes time frames, batches aren’t seal by size. Looking at the size, you should also consider the tradeoff between latency and efficiency as explained above.
Compare data connection incoming events to the number of events sent for ingestion
Applying Event Hub, IoT Hub or Event Grid ingestion, you can compare the number of events received by ADX to the number of events sent from Event Hub to ADX. The metrics Events Received, Events Processed and Events Dropped aimed to enable this comparison.
- In the metrics pane select the following settings:

Settings
|
Suggested Value
|
Field Description
|
Scope
|
<Your Cluster Name>
|
The name of the ADX cluster
|
Metric Namespace
|
Kusto Cluster Standard Metrics
|
A namespace which is the category for the metric
|
Metric
|
Events Received
|
The metric name
|
Aggregation
|
Sum
|
The aggregated function by which the metrics are aggregated over time. To better understand aggregation see Changing aggregation
|
- Select Add filter above the chart:

- Select the Component Name property to filter the events received by a specific data connection defined on your cluster:

- After selecting the filtering values, click away from the Filter Selector to close it. Now the chart shows the number of events received by the selected data connection over time:

Looking at the chart above you can see that the data connection called GitHubStreamingEvents got around 200-500 events over time.
- To see if there are events dropped by ADX, you can focus on the Events Dropped metric and Events Processed metric.
- In the chart you created, select Add metric:
 ‘
‘
- Select Events Processed as the Metric, and Sum for the Aggregation.
- Return these steps to add Events Dropped by the data connection.
- The chart now shows the number of Events that were received, processed and dropped by the GitHubStreamingEvents data connection over time:

- In the chart above you can see that almost all received events were processed successfully by the data connection. There is 1 dropped event, which compatible with the failed ingestion result due to bad request that we saw in the ingestion result section.
- You may also want to compare the number of Event Received to the number of events that were sent from Event Hub to ADX.
- On the chart select Add metric.
- Click on the Scope to select the desired Event Hub namespace as the scope of the metric.
- In the opened panel, de-selected the ADX cluster, search for the namespace of the Event Hub that sends data to your data connection and select it:

- Select Apply
- Select the following settings:

Settings
|
Suggested Value
|
Field Description
|
Scope
|
<Your Event Hub Namespace Name>
|
The name of the Event Hub namespace which send data to your data connection
|
Metric Namespace
|
Event Hub standard metrics
|
A namespace which is the category for the metric
|
Metric
|
Outgoing Messages
|
The metric name
|
Aggregation
|
Sum
|
The aggregated function by which the metrics are aggregated over time. To better understand aggregation see Changing aggregation
|
- Click away from the settings to get the full chart that compare the number of events processed by ADX data connection to the number of events sent from the Event Hub:

- In the chart above you can see that all events that were sent from Event Hub, were processed successfully by ADX data connection.
Note: If you have more than one Event Hub in the Event Hub namespace, you should filter Outgoing Messages metric by the Entity Name dimension to get only data from the desired Event hub in your Event Hub namespace
Next Steps
by Contributed | Mar 8, 2021 | Technology
This article is contributed. See the original author and article here.
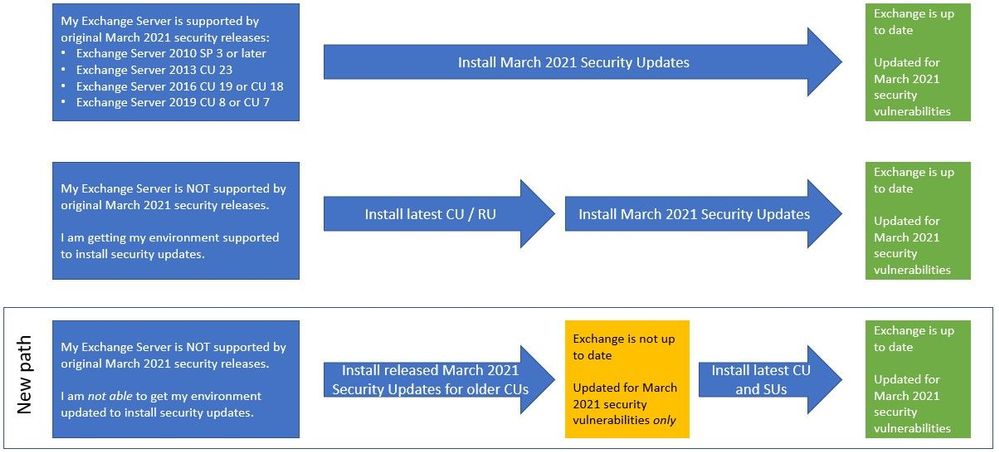
To help customers more quickly protect their environments in light of the March 2021 Exchange Server Security Updates, Microsoft is producing an additional series of security updates (SUs) that can be applied to some older (and unsupported) Cumulative Updates (CUs). The availability of these updates does not mean that you don’t have to keep your environment current. This is intended only as a temporary measure to help you protect vulnerable machines right now. You still need to update to the latest supported CU and then apply the applicable SUs. If you are already mid-update to a later CU, you should continue with that update.
With these new updates, you will have a new path you can take:
What are these updates?
- These update packages contain only fixes for March 2021 CVEs (CVE-2021-26855, CVE-2021-26857, CVE-2021-26858, CVE-2021-27065); no other product updates or security fixes are included. Installing these updates does not mean an unsupported CU is now supported.
- Updates are available only through the Microsoft Download Center (not on Microsoft Update).
- We are producing updates only for some older CUs for Exchange 2016 and 2019.
- If you are running a version of Exchange not covered by these updates, consider either rolling forward to a CU package that has an applicable SU, or rolling forward to a supported CU (preferred option). In case you need to go forward with CUs, please see: best practices for installation of Exchange updates (applies to all versions of Exchange).
About installation of these updates
- These updates must be installed from an elevated command prompt:
- Download the update but do not run it immediately.
- Select Start, and type CMD.
- In the results, right-click Command Prompt, and then select Run as administrator.
- If the User Account Control dialog box appears, choose Yes, and then select Continue.
- Type the full path of the .msp file, and then press Enter.
- Installing the SUs mentioned here and then installing a later CU will make the server vulnerable to exploits again until the CU you install contains the March 2021 security fixes (Exchange 2016 CU 20 and Exchange 2019 CU 9 – and newer – will include March 2021 security updates).
- Installing updates requires a reboot (even if not prompted). The server will not be protected until after the reboot.
- After installing one of these updates, you might see older Exchange security updates for your older CU available for download from Microsoft Update. Install the older security update from Microsoft Update and your servers will stay protected (for 4 CVEs mentioned before).
- If you run into issues after installation, please see https://aka.ms/exupdatefaq first. You can also uninstall these updates (using Add/Remove Programs) if needed.
These additional updates are about to be to available in KB5000871.
IMPORTANT: You must install .msp updates from elevated command prompt (see Known Issues in the update KB article)
If you install these additional updates, please ensure that you continue to bring your Exchange environment to supported state as soon as possible. Our original announcement Released: March 2021 Exchange Server Security Updates contains information and resources that can help you plan your updates, troubleshoot problems, and help you with mitigations, investigation, and remediation of the vulnerabilities.
Additional news about investigations
To aid defenders in investigating these attacks where Microsoft security products and tooling may not be deployed, we are releasing a feed of observed indicators of compromise (IOCs). The feed of malware hashes and known malicious file paths observed in related attacks is available in both JSON and CSV formats at the below GitHub links. This information is being shared as TLP:WHITE.
Please keep checking this blog post for any related updates.
The Exchange Team
by Scott Muniz | Mar 8, 2021 | Security, Technology
This article is contributed. See the original author and article here.
CISA has published a Remediating Microsoft Exchange Vulnerabilities web page that strongly urges all organizations to immediately address the recent Microsoft Exchange Server product vulnerabilities. As exploitation of these vulnerabilities is widespread and indiscriminate, CISA strongly advises organizations follow the guidance laid out in the web page. The guidance provides specific steps for both leaders and IT security staff and is applicable for all sizes of organizations across all sectors.
by Contributed | Mar 8, 2021 | Dynamics 365, Microsoft 365, Technology
This article is contributed. See the original author and article here.
It comes as no surprise that today’s world is driving a seismic shift in B2B sales. Customers are rapidly adopting digital buying behavior, and sellers are feeling the pressure to reinvent themselves. Organizations must commit to empowering and enabling their sellers if they want to adapt to the new landscape and remain resilient in their markets. Companies that are successfully navigating selling today are doing two key things:
- Working smarter: streamlining and scaling sales activities with powerful digital tools.
- Being more strategic: leveraging sales operation roles to focus sales teams on the next critical steps to win accounts with the most opportunity.
While digital selling and optimized sales operations are important for helping sales teams orient their efforts in the post-pandemic marketplace, they are only as good as the data they rely on. New opportunities and new pockets of growth are missed if your data is stale or inaccurate. Compiling that data manually takes time, and trusted and reliable data can be hard to find.
Equipping sellers with reliable, actionable, and relevant real-time data is essential if sellers are going to embrace relationship selling and make the most of the time they have available with customers. Confidence in the “next best steps” and clear direction are what sellers need to turn an opportunity into a victory.
Dynamics 365 and LinkedIn Sales Solutions bring the human touch to digital experiences
Microsoft already brings Dynamics 365 Sales and LinkedIn Sales Navigatortogether, enabling sellers to deliver more personalized and meaningful engagement with customers. By providing a unified view of data, Dynamics 365 Sales and LinkedIn Sales Navigator work in tandem to:
- Empower sellers to find key decision makers
- Keep sellers connected to buyers
- Reduce sales friction
Together, Dynamics 365 and LinkedIn Sales Solutions ensure sellers can build deep, trusted relationships with buyers, and deliver the authentic and personalized engagement that today’s buyers demand.
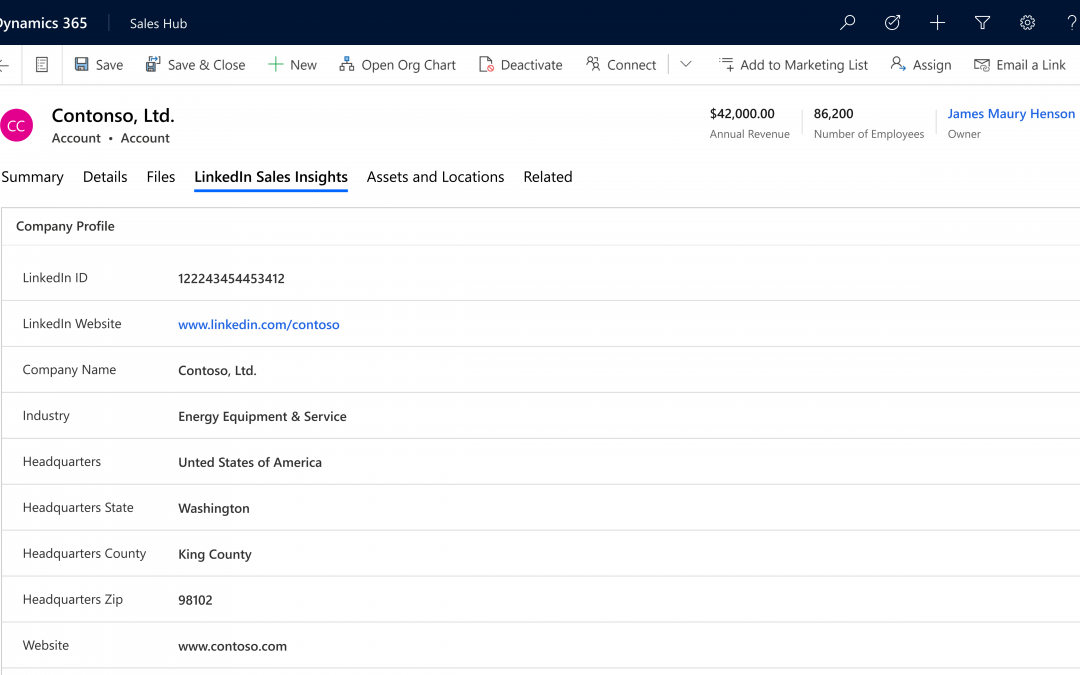
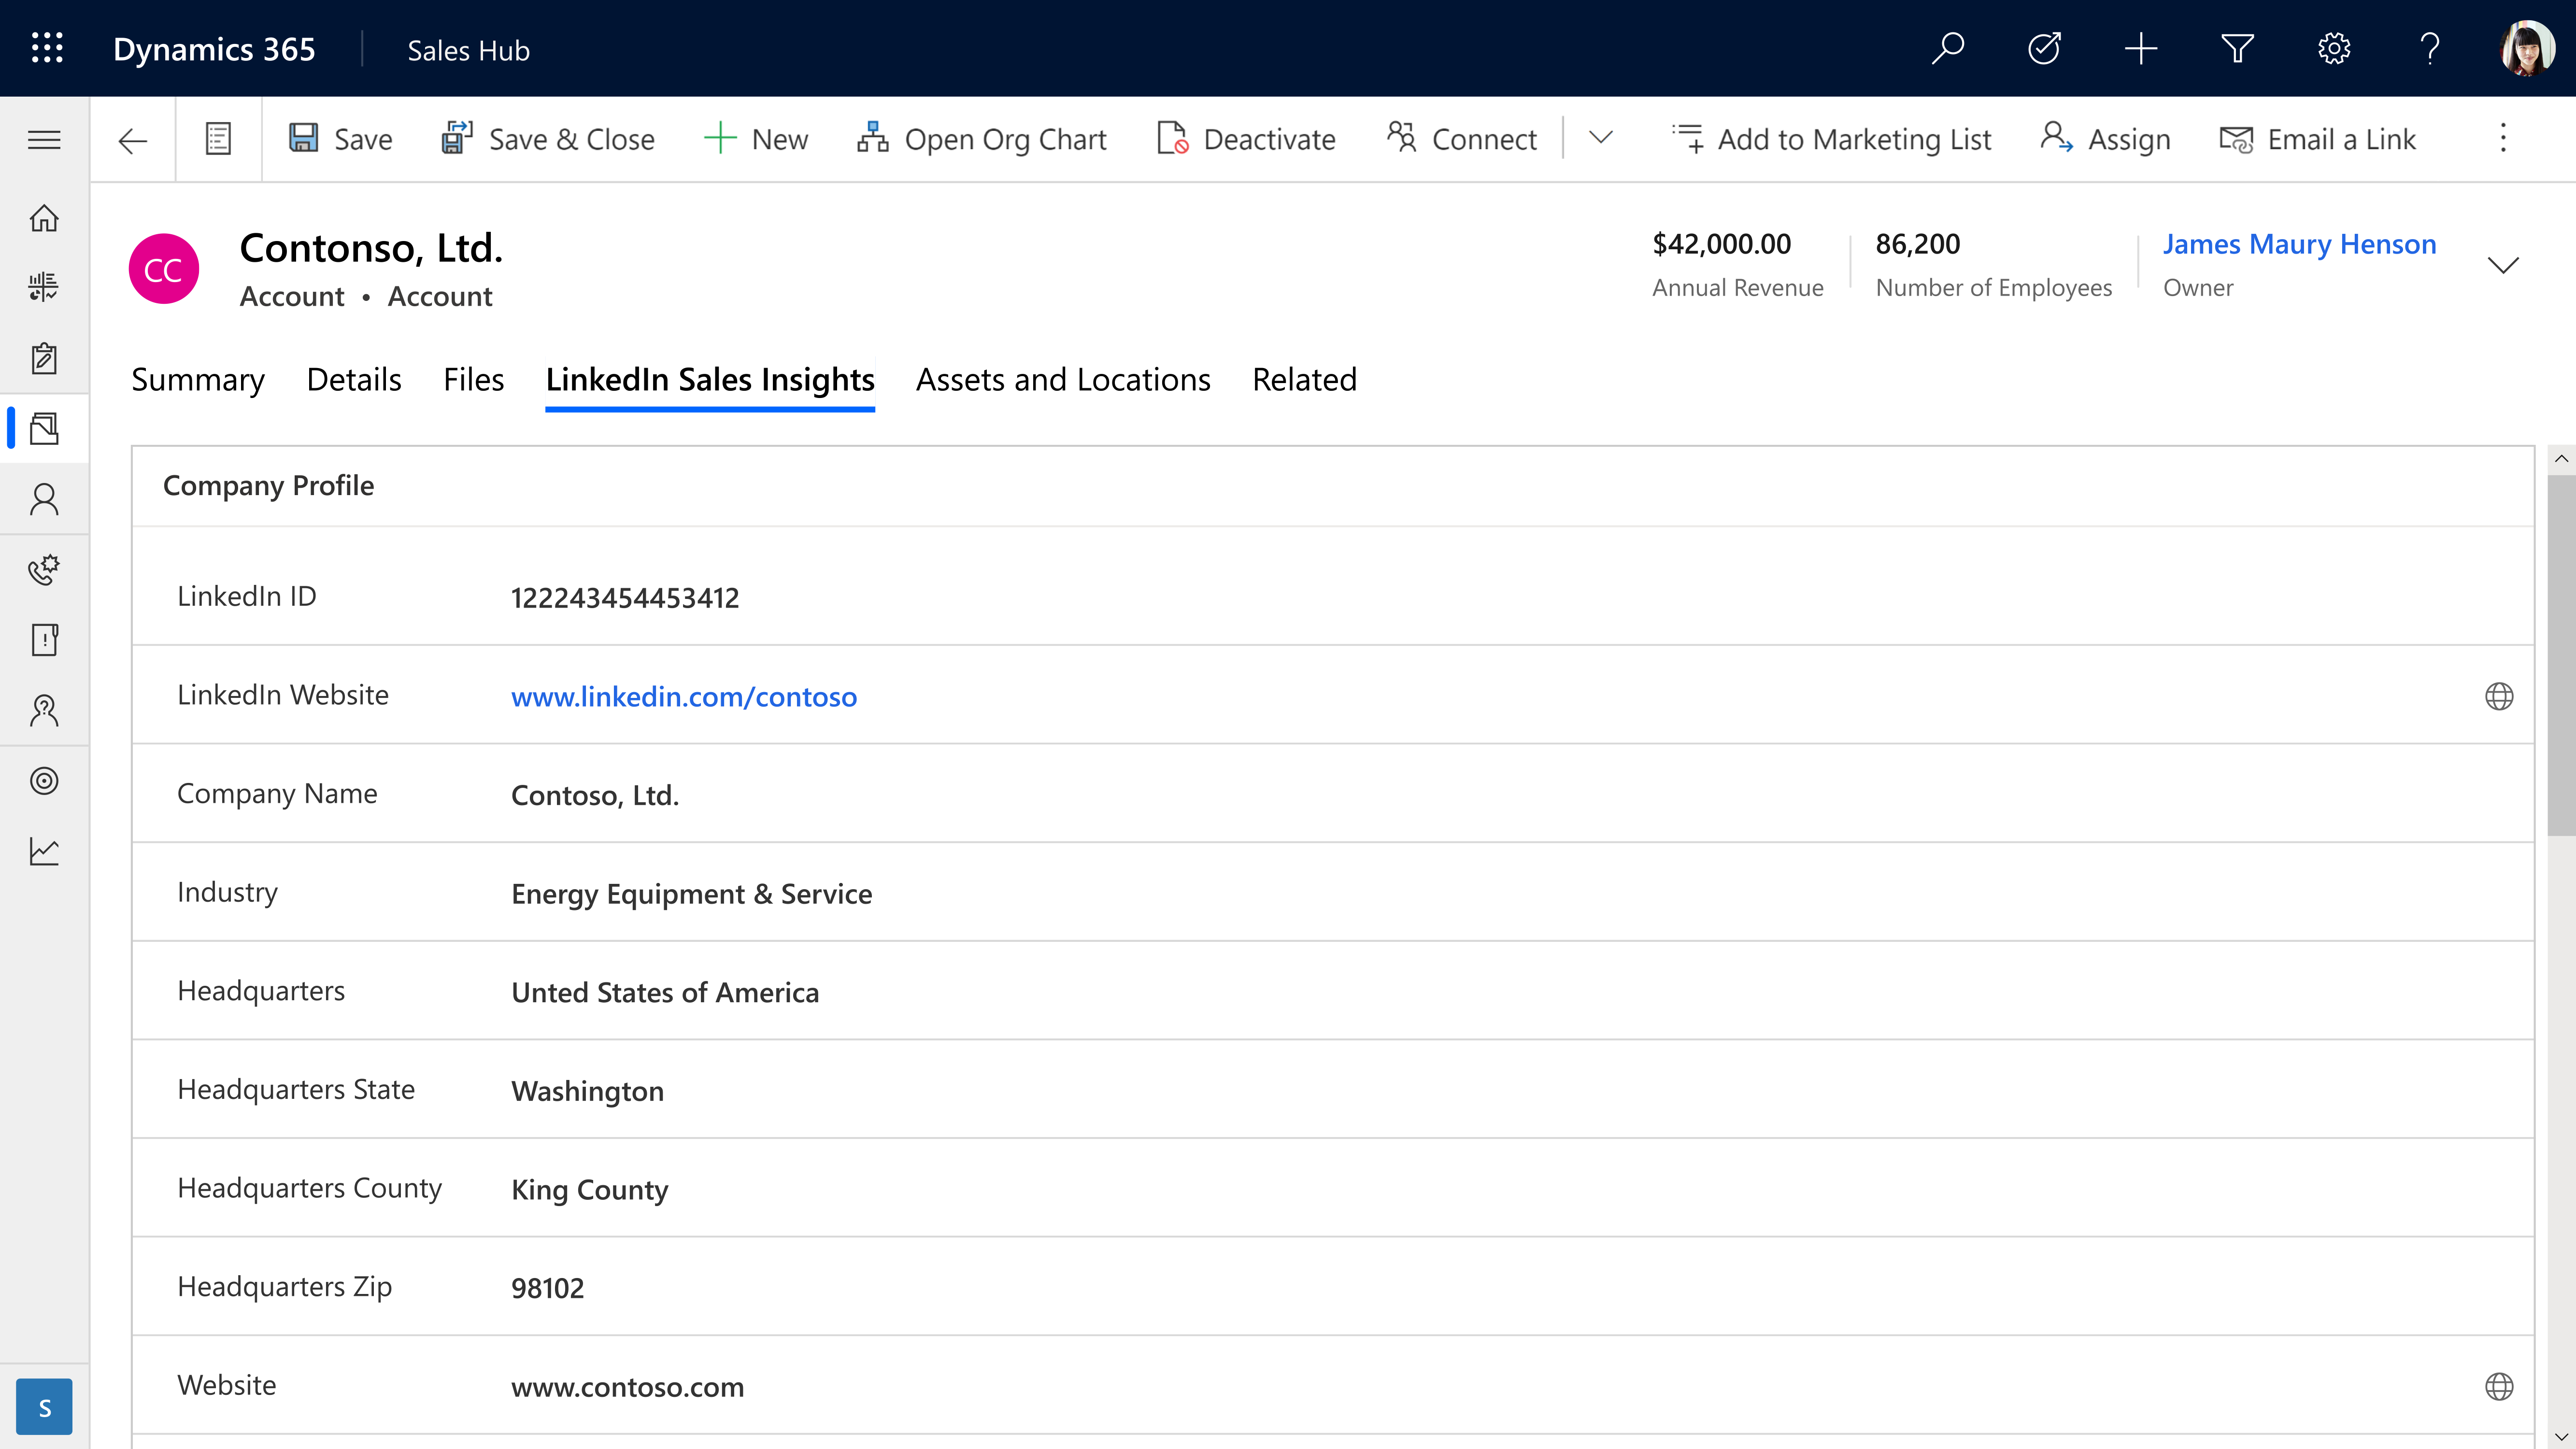
Introducing LinkedIn Sales Insights for Dynamics 365 Sales
In February, LinkedInannounced the general availability of LinkedIn Sales Insights, a new product in the LinkedIn Sales Solutions portfolio that is powered by over 740 million members on LinkedIn to help sales organizations identify and size potential opportunities, get a clearer view of the market, and plan more confidently. With this integration, customers who integrate Sales Insights into Dynamics 365 Sales can feel more confident about their sales planning in knowing that their CRM is powered by the reliable, trusted, and aggregated data produced by LinkedIn Sales Insights.
By bringing together aggregated data at scale with powerful tools that reveal actionable insights, teams are focused, productive, and successful. Intelligent automation that leverages the depth and accuracy of buyer records from LinkedIn helps sellers strategically engage, develop connections, and turn relationships into revenue. With LinkedIn Sales Insights for Dynamics 365, you can expect:
- Account planning and prioritizationwith LinkedIn Sales Insights, company information can be brought into Dynamics 365 Sales to help more confidently plan and prioritize knowing the data powering your CRM is reliable.
- Harvesting opportunities within existing accounts is simpler and far easier with integrated tools that keep a pulse on key accounts.
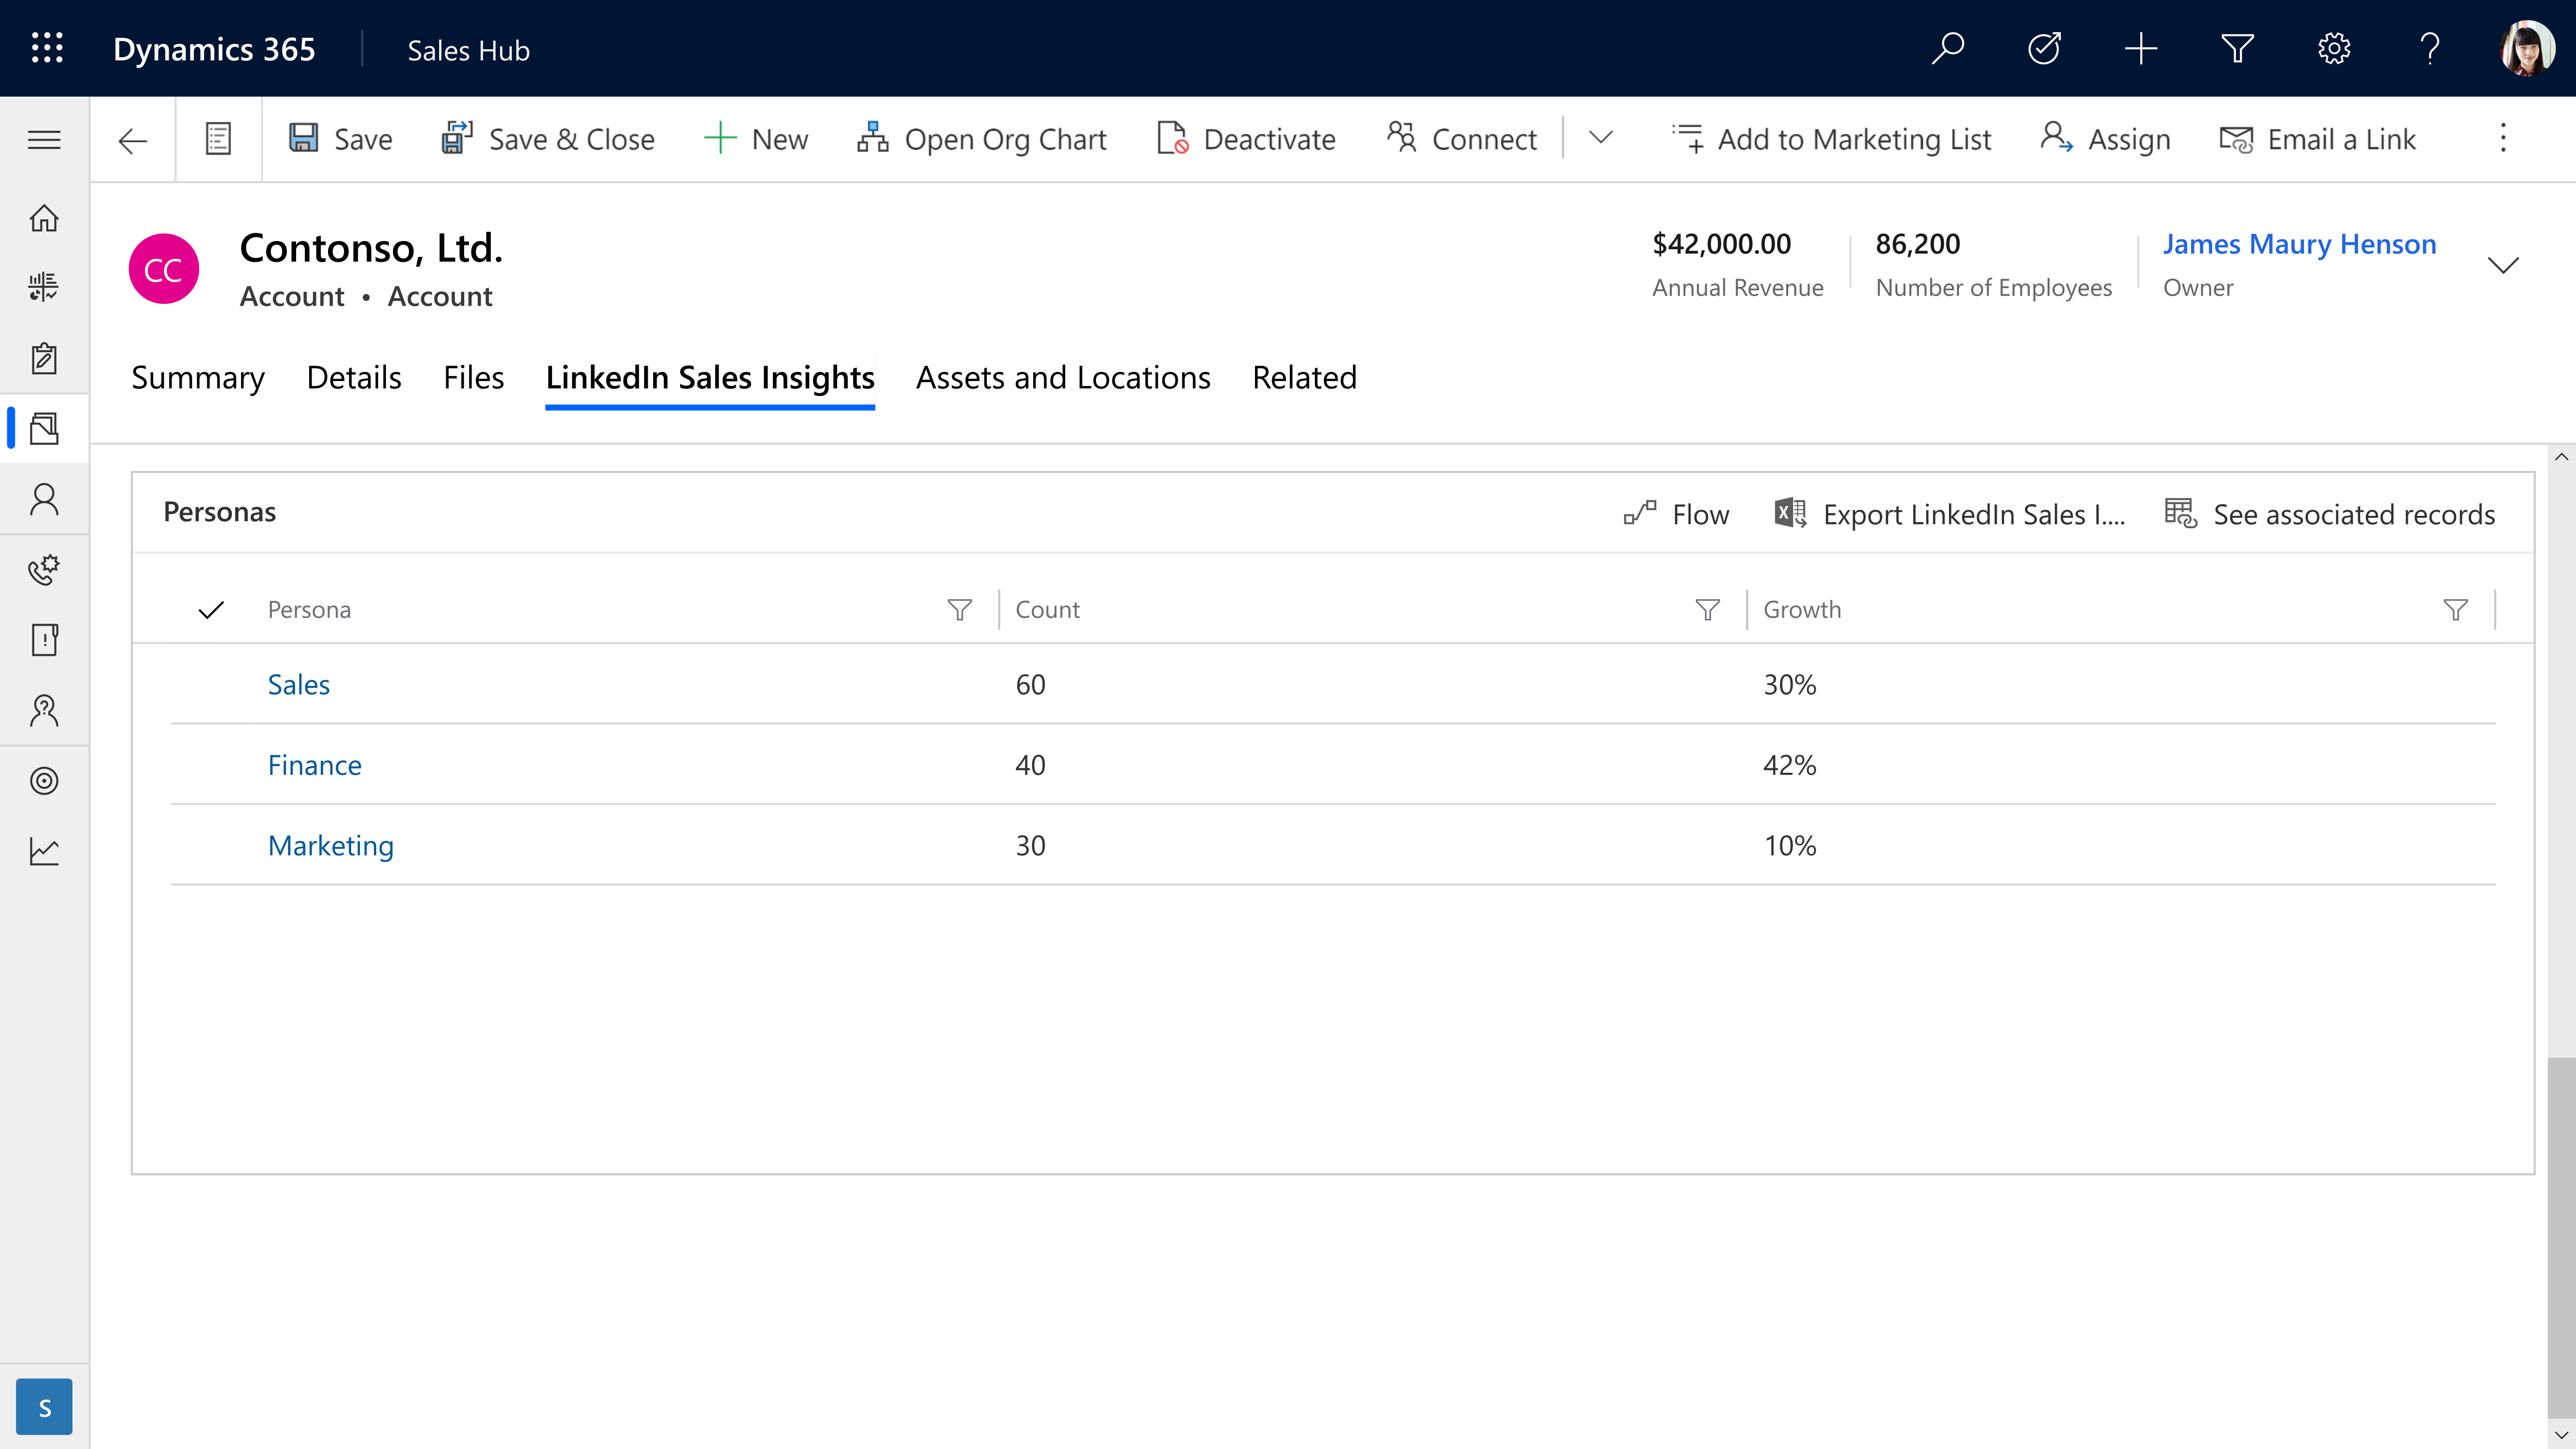
- Opportunities are more accurately evaluated by drilling down into size and growth of specific company departments, functions, and job titles to more accurately size opportunities.
Learn more
Together, LinkedIn Sales Solutions and Microsoft Dynamics 365 support stronger relationships and an increased pipeline by delivering the most current data with powerful intelligence and tools to make sales teams even more customer-centric.
LinkedIn Sales Insights can help your team harness the power of reliable data. Learn more about LinkedIn Sales Insights for Dynamics 365 and discover how it can help transform your sales planning.
Ready to empower your sales team? Read about LinkedIn Sales Insights integration with Dynamics 365 and view the installation guide for LinkedIn Sales Insights for Dynamics 365 Sales.
Want to learn more about Dynamics 365 Sales? Watch a demo or take a guided tour to see how Dynamics 365 Sales can empower your sellers with actionable insights.
The post Smarter sales planning with LinkedIn Sales Insights for Dynamics 365 Sales appeared first on Microsoft Dynamics 365 Blog.
Brought to you by Dr. Ware, Microsoft Office 365 Silver Partner, Charleston SC.

by Contributed | Mar 8, 2021 | Technology
This article is contributed. See the original author and article here.
Together with our friends from Microsoft Project and Dynamics 365 Project Operations, we invite you to join us for a free digital event to reimage your project management. No matter the shape, size, or complexity of your work, Project, Planner, and Project Operations can help you deliver quality results on time, and this event will show you how.
The Reimagine Project Management with Microsoft virtual event is Thursday, March 18, 2021 from 8:00 AM-9:30 AM PST.
Register now for Reimagine Project Management with Microsoft to:
- Discover new features and best practices during the keynote and 6+ hours of additional on-demand demos and product walkthroughs.
- Engage with our product teams and partners by signing up for roundtables on a range of topics related to our project management solutions.
- Connect with Microsoft experts, technology partners, and peers to expand your network.
>Register now

by Contributed | Mar 8, 2021 | Technology
This article is contributed. See the original author and article here.
COVID-19 spread has changed our day-to-day life in unprecedented ways. Organizations around the world are taking action to, contain and help prevent further spread of the disease by using AI technologies like computer vision, help ensure the safety of the employees and customers.
Azure Cognitive Services now, provides Mask detection functionality, to assist application developers in building solutions that can help monitor and contain the spread. Mask detection can be deployed anywhere, from the cloud leveraging Face service, to the edge using Spatial analysis service.
Mask detection on the edge
Spatial analysis is, a capability of Computer Vision, part of Azure Cognitive Services. This capability understands people’s movements in a physical space by analyzing real-time video, significantly increasing efficiency, and providing valuable insights for enabling various scenarios including,
- Counting people in a space for maximum occupancy
- Understanding the distance between people for social distancing measures
- Determining customer footfall such as in retail spaces
- Determining wait time in a checkout line
- Determining trespassing in protected areas
Spatial analysis can now detect whether a person is wearing a protective face covering or not. With this new capability, businesses can leverage insights to build applications that can measure safety and enhance compliance. For example, a business can aggregate data of percentage of people wearing masks in a physical space to improve compliance measures. To help ensure the safety of people working in a given space, mask detection can also be used to notify when a person may accidentally enter the space without a face mask.
Mask detection can be enabled for the following spatial analysis operations – personcount, personcrossingline and personcrossingpolygon. The classifier model can be enabled by configuring the ‘ENABLE_FACE_MASK_CLASSIFIER’ parameter to True, this is disabled by default. The attributes, face_mask or face_noMask, will be returned as metadata with confidence score for each person detected in the video stream.
Face mask and Person detection with Spatial analysis
Spatial analysis operations provide a real-time video analysis pipeline on new and existing RTSP cameras. The deployment of the spatial analysis container on edge devices is facilitated by Azure IoT Hub. When video is streamed and processed by spatial analysis, the container emits AI insight events about people’s movement which in turn are sent to Azure IoT Hub as IoT telemetry. From IoT Hub you can create various routes to other Azure services and build your business solutions.
 Spatial analysis container deployment with Azure IoT
The events from each operation are egressed to Azure IoT Hub on JSON format. Sample JSON for an event output by cognitiveservices.vision.spatialanalysis-personcount operation.
{
    "events": [
        {
            "id": "3733eb36935e4d73800a9cf36185d5a2",
            "type": "personLineEvent",
            "detectionIds": [
                "90d55bfc64c54bfd98226697ad8445ca"
            ],
            "properties": {
                "trackingId": "90d55bfc64c54bfd98226697ad8445ca",
                "status": "CrossLeft"
            },
            "zone": "doorcamera"
        }
    ],
    "sourceInfo": {
        "id": "camera_id",
        "timestamp": "2020-08-24T06:06:53.261Z",
        "width": 608,
        "height": 342,
        "frameId": "1340",
        "imagePath": ""
    },
    "detections": [
        {
            "type": "person",
            "id": "90d55bfc64c54bfd98226697ad8445ca",
            "region": {
                "type": "RECTANGLE",
                "points": [
                    {
                        "x": 0.491627341822574,
                        "y": 0.2385801348769874
                    },
                    {
                        "x": 0.588894994635331,
                        "y": 0.6395559924387793
                    }
                ]
            },
            "confidence": 0.9005028605461121,
            "metadata": {
	        "attributes": {
	            "face_Mask": 0.99
	        }
	    }
        }
    ],
    "schemaVersion": "1.0"
}
Learn how to build business applications with spatial analysis, follow these instructions to deploy a sample Azure Web Application that presents a live view of people counting events in a physical space. You can modify this app with other spatial analysis operations and make modifications based on the event output of the container.
Mask detection in the cloud
Mask detection is also available through the Face Detection cloud endpoint in Azure Cognitive Face API Service. This capability analyses images, detects one or more human faces along with attributes for each face in the image. Face mask attribute is available with the latest detection_03 model, along with additional attribute “noseAndMouthCovered” that provides insight about whether the mask covers both the nose and mouth.
To leverage the latest mask detection capability, users need to specify the detection model in the API request – assign the model version with the detectionModel parameter to detection_03. Refer to How to specify a detection model to learn more about the capabilities of each detection model and sample code to call it.
 Face mask detection with Face Service
Detection_03 API response with face mask attribute:
  {
    "faceId": "eee58bd3-0b54-4f48-9a96-c9c60724ee80",
    "faceRectangle": {
      "top": 171,
      "left": 1212,
      "width": 79,
      "height": 125
    },
    "faceAttributes": {
      "mask": {
        "type": "faceMask",
        "noseAndMouthCovered": “true”
      }
  },
  {
   "faceId": "2d83c3c1-7266-4b84-b47b-a65645368021",
    "faceRectangle": {
      "top": 364,
      "left": 600,
      "width": 66,
      "height": 80
    },
    "faceAttributes": {
      "mask": {
        "type": "faceMask",
        "noseAndMouthCovered": “true”
     }
  },
Responsible AI and Deployment Guide
Microsoft’s principled approach enables developers to build rich solutions while ensuring responsible use.
Responsible deployment recommendations for spatial analysis is provided in accordance with Microsoft Responsible AI Principles: fairness, reliability & safety, privacy & security, inclusiveness, transparency, and human accountability. For general guidelines and specific recommendations for height, angle, and camera-to-focal-point-distance, see Camera placement guide. And refer to Face API Transparency Note to get clear guidance on use of facial recognition to help ensure it fits your goals and achieve accurate results.
Get Started
Learn more with our documentation Spatial analysis, QuickStart: Face Service
Follow the tutorial to Create a People Counting Web App, Detect faces using the .NET SDK
Learn about Azure Stack Edge and Azure IoT Hub

Recent Comments