by Contributed | May 5, 2021 | Technology
This article is contributed. See the original author and article here.
In this blog post, we are going to have a look at how you can automatically upload files to an Azure Blob storage account using Power Automate Desktop. Power Automate Desktop is a great tool to build automation on your desktop. You can create flows, interact with everyday tools such as email and excel and work with modern and legacy applications.
For example, you can automate tasks like:
- Quickly organize your documents using dedicated files and folders actions
- Accurately extract data from websites and store them in excel files using Web and Excel automation
- Apply desktop automation capabilities to put your work on autopilot.
Now want tasks I want to build some automation is to upload files to an Azure Blob Storage account for long-term storage. These can be small and large files, in my cases I wanted to backup all my large video files to an Azure blob Storage account.
To learn more about Power Automate check out Microsoft Docs.
Preparation
Install Power Automate Desktop (it is free)
You can download Power Automate Desktop from here.
Sign in to the Power Automate Desktop Windows application using one of the following accounts and automate your tedious tasks.
A full comparison of the features included in each account can be found here.
Create an Azure Storage account
Secondly you create a Storage account in Azure. An Azure storage account provides you to host all of your Azure Storage data objects: blobs, files, queues, and tables. For more information about Azure storage accounts, see Storage account overview.
To create an Azure storage account just follow these steps on Microsoft Docs: Create a storage account.
Download AzCopy
Since I am dealing with large files, I decided to use the AzCopy utility. AzCopy is a command-line utility that you can use to copy blobs or files to or from a storage account. Get started with AzCopy.
Create Power Automate Desktop Flow
After we prepared everything, we can now start to create the flow in Power Automate Desktop.
Power Automate Desktop Flow – Upload to Azure Blob Storage using AzCopy
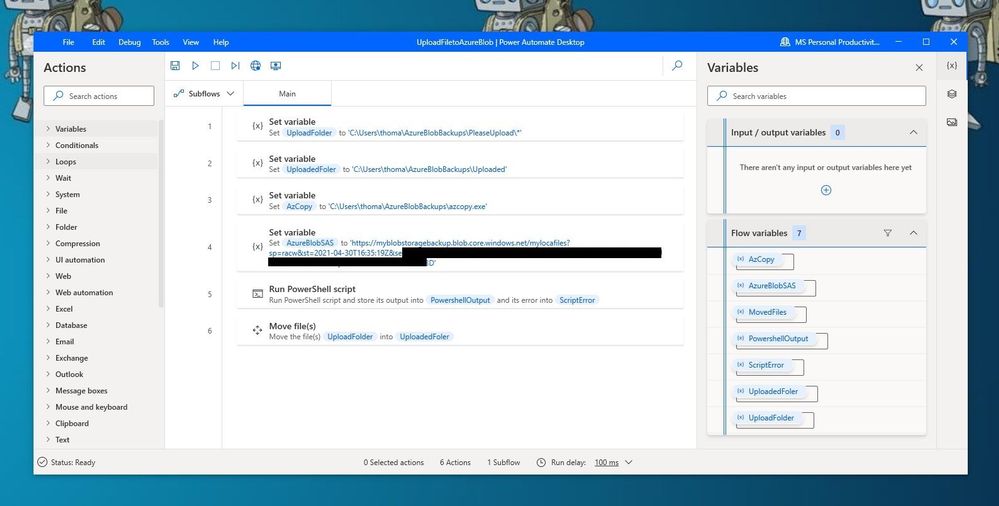
First, I create the following variables within the flow.
- UploadFolder – This is the folder where I place my files, which I want to be uploaded
- UploadedFolder – This is the folder where the file gets moved after it has been uploaded
- AzCopy – This is the path where I saved the azcopy.exe
- AzureBlobSAS – This is the URI for the Azure Blob Storage account including the Shared access signature (SAS) token
To generate the URI with the SAS (Shared access signature) token, go to the Azure Portal to your Azure storage account. Go to containers and create a new container. Open the container and on the and navigate to Shared access signature. Select add, create, and write permission, change the time if needed, and press Generate SAS token and URL. Copy the Blob SAS URL and save it as the variable in the flow.
 Azure Storage Account SAS Token
IMPORTANT: When you add the SAS URL to the variable you will need to make all the % to %% because of how Power Automate Desktops names variables.
Since we want to use the AzCopy utility to copy the files to the Azure Blob storage, you can now add the “Run PowerSheel script” action with the following PowerShell code:
%AzCopy% copy "%UploadFolder%" "%AzureBlobSAS%" --recursive=true
 Run PowerShell script
With the last step, we are going to move the uploaded files to another folder.
 Move Files
Conclusion
I hope this blog post provides you with a quick overview of how you can upload files to an Azure Blob storage account using Power Automate. There are of course other ways on how to do this but the great thing here is that you can easily upload large files and add more actions to your Power Automate Desktop Flow. If you have any questions, feel free to leave a comment below.
by Contributed | May 5, 2021 | Technology
This article is contributed. See the original author and article here.
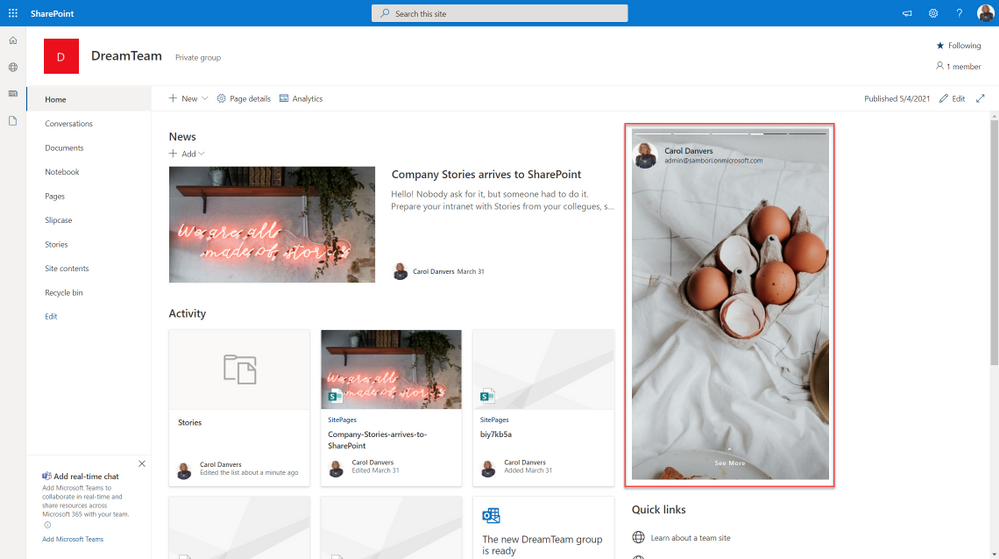
Would not be cool to engage your Modern Workplace users with content appearing like in your favourite social network? In my latest community sample, I built an SPFx webpart to do so. Here is how I did it, but first, this is how it looks:
SharePoint stories webpart
What we need first, is a SharePoint list that will contain all the “story images”, with the author of that story, and some Text, if we want to show the “show more” option. This list will be something like this:
 SP List
Now it is time to code our SPFx webpart.
Before starting, for all the UI thing, I am using an existing open-source React component called “react-insta-stories”, that you can find in its GitHub repository. This component does most of the hard work with the image slide and so on. In its most simple way, the component just needs an array of images:
 react package
But you can also specify an array of Story objects, where a Story can have the following properties:
 Story object properties
Now that we know how to use the Stories component, the webpart functionality is quite easy. We just need to get the Stories information from the SharePoint list, and compose the proper Stories array.
As usual when developing SPFx webparts, the webpart itself, just loads a React component, passing the information that we need, in this case, for simplicity, I am passing the entire WebPartContext object, but try to avoid this practice, and only pass what you need.
This is the main code in the Render webpart method:
 SPFx Webpart render
Once in the main React component, we are calling the SharePoint REST API to get the sotries from the list. To do so, I am using the endpoint:
/_api/web/lists/GetByTitle('Stories')/RenderListDataAsStream
As this endpoint is given me the Image URL in the format that I need (but pretty sure you can do the same with other endpoints, or using the PnP JS library). The code to do so is:
 componentDidMount
The method “_getStoryFromListItem” will create a Story object for the “react-insta-stories” component, and here we have an interesting challenge. The Story object, has a Header property, aimed to render the Story author information, so you just provide the profile image, and a couple of texts for heading and subheading. Although we could get the Author profile image, username and email using Graph API, it is going to be much easier to make use of the MS Graph Toolkit library, and use the MGT Person component. In order to render the GMT Person component, we cannot use the Story Header property, however, the Story object allow us to specify a custom render function for the entire Story, and in that function, we can use the Person component. This is the relevant code to achieve it:
 Story custom render function
The storyRenderer function is the one responsible for rendering the Story, and there, we use the GMT Person component. As you can see in the code above, we also use a React High Order Component called WithSeeMore, this component is from the react-insta-stories library and is the way to load a specific text when the “See more” link is clicked in the Story. So, if the list item has the Content field filled, we set the “seeMore” property of the Story object. This property is again a function, so you can customize how the content is rendered.
And that´s all!… you can get the full code sample in the PnP GitHub repository
Cheers!
by Contributed | May 5, 2021 | Technology
This article is contributed. See the original author and article here.
Node may go down for several reasons, please find the probable causes for Nodes going down in Service Fabric Cluster.
Scenario#1:
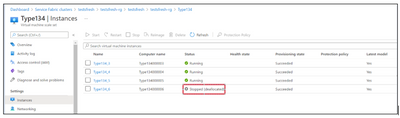
Check the Virtual Machine associated with the Node exists or Deleted or Deallocated.
Azure Portal-> VMSS Resource -> Instances
If Virtual machine doesn’t exist, then one must perform either of below to Remove node state from Service Fabric cluster.
From SFX:
- Go to the service fabric explorer of the cluster.
- Check the Advanced mode setting check box on the cluster:

- Then click on Ellipsis (…) of the down nodes to have the “Remove node state” options and click on it. This should remove node state from the cluster.
From PS Command:
PS cmd: Remove-ServiceFabricNodeState -NodeName _node_5 -Force
Reference: https://docs.microsoft.com/en-us/powershell/module/servicefabric/remove-servicefabricnodestate?view=azureservicefabricps
Scenario#2:
Check if Virtual machine associate with the node is healthy in VMSS.
Go to Azure Portal-> VMSS Resource -> Instances -> Click on the Instance -> Properties

If Virtual Machine Guest Agent is “Not Ready” then reach out to Azure VM Team for the RCA.
Possible Mitigation:
- Restart the Virtual machine from VMSS blade.
- Re-image the Virtual Machine.
Scenario#3:
Check the performance of the Virtual Machine-like CPU and Memory.

If the CPU or Memory is High, then Fabric related process will not be able to establish any instances/start the instances causing the node to go down.
Mitigation:
- Check which process is consuming high CPU/Memory from the Task Manager to investigate the root cause and fix the issue permanently.
Collect the dumps using below tool to determine the root cause:
DebugDiag:
Download Debug Diagnostic Tool v2 Update 3 from Official Microsoft Download Center
(or) Procdump:
ProcDump – Windows Sysinternals | Microsoft Docs
- Restart the Virtual machine from VMSS blade.
Scenario#4:
Check the Disk usage of the Virtual Machine, no space is the disk could lead to Node down issues.
For disk space related issues, we recommend to use ‘windirstat’ tool mentioned in the article: https://github.com/Azure/Service-Fabric-Troubleshooting-Guides/blob/master/Cluster/Out%20of%20Diskspace.md to understand which folders are consuming more space.
Mitigation:
Free up the space to bring the Node Up.
by Contributed | May 5, 2021 | Technology
This article is contributed. See the original author and article here.
We are pleased to announce the launch of the new Visio start page on Office.com, providing Visio users with a familiar start experience that is similar to other Office 365 apps and powerful Office features, like improved file discovery, improved collaboration features, and better template categorization.
From the new landing page, you will experience the benefits of the Office.com ecosystem combined with unique features of the existing Visio landing page. Below are additional details on the latest enhancements:
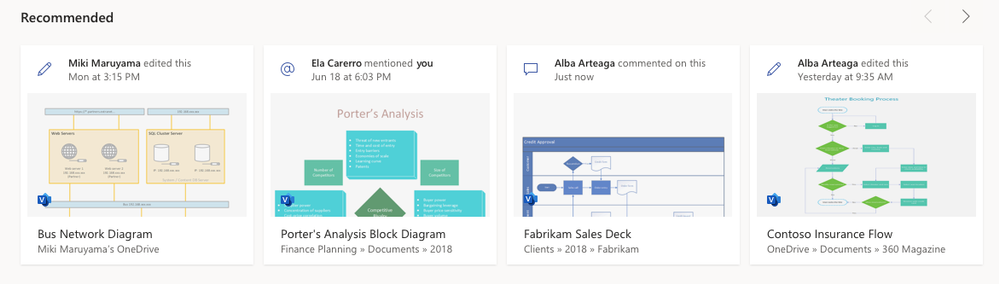
- Improved collaboration: The new design will allow you to see recommended files with actions from your teammates like, “Anne edited this Thursday at 9:10 pm.” You can easily open files that have been recently edited, accessed, and reviewed by your colleagues and quickly pick up where your colleagues left off.
- Better discovery of existing files: With the addition of My recent and Shared files, you can access your frequently used Visio files easily. There is also an option to add your files to the Favorites section for quick access by clicking on the star icon adjacent to the file.

- Better categorization of templates and sample diagrams: The new experience provides a set of templates at the top of the start page to quickly create new Visio diagrams.

To access the full set of templates and sample diagrams, click on More templates, which will direct you to the “More templates” page. Here, you will see the vast repertoire of Visio’s templates and sample diagrams. Navigate to the desired template and click on the Create button to design your new Visio diagram quickly. design your new Visio diagram quickly.

- New search experience: The new search experience will enable you to search quickly through Visio’s rich library of templates and sample diagrams using relevant search terms to help facilitate quicker file creation.

- Overall performance improvements: With the new landing page, you will also experience vastly improved app performance when opening existing or creating new Visio files, reduced time to create new files and so on.
How to access the new landing page
If you have a Visio Plan 1 or Visio Plan 2 subscription, you can access the new landing page via any of the below entry points:
- Click on the waffle menu in the top left. Then, click on All apps and search for “Visio.”

- Search for “Visio” in the universal search box at the top of the page and click on the Visio icon under the Apps header of the search results dropdown.

- Click on the All apps icon in the left navigation bar. Then, click on the Visio app tile under the Office 365 tab.

This experience will be rolling out gradually to our users , so stay tuned to experience the new start page soon!
New announcements are coming your way shortly, so keep checking the Visio Tech Community blog and please continue to send us your product feedback and ideas through UserVoice.

by Contributed | May 4, 2021 | Technology
This article is contributed. See the original author and article here.
What’s Up with Markdown?

Perhaps you’ve noticed a technology called Markdown that’s been showing up in a lot of web sites and apps lately. This article will explain Markdown and help you get started reading and writing it.
Markdown is a simple way to format text using ordinary punctuation marks, and it’s very useful in Microsoft 365. For example, Microsoft Teams supports markdown formatting in chat messages and SharePoint has a Markdown web part. Adaptive Cards support Markdown as well, as do Power Automate approvals. For the bot builders among us, Bot Composer language generation and QnA Maker both support markdown as well. And what’s at the top level of nearly every Github repo? You guessed it, a markdown file called README.md.
Designed to be intuitive
Imagine you’re texting someone and all you have to work with is letters, numbers, and a few punctuation marks. If you want to get their attention, you might use **asterisks**, right? If you’ve ever done that, then you were already using Markdown! Double asterisks make the text bold.
Now imagine you’re replying to an email and want to quote what someone said earlier in the thread. Many people use a little greater-than sign like this:
Parker said,

> Sharing is caring
Guess what, that’s Markdown too! When it’s displayed, it looks like this:
Parker said,
Sharing is caring
Did you ever make a little table with just text characters, like this?
Alpha | Beta | Gamma

——|——|——

  1   |   2  |  3
If so, you already know how to make a table in Markdown!
Markdown was designed to be intuitive. Where possible, it uses the formatting clues people type naturally. So you can type something _in italics_ on the screen and it actually appears in italics.
In all cases you’re starting with plain text – the stuff that comes out of your keyboard and is edited with Notepad or Visual Studio Code – into something richer. (Spoiler alert: it’s HTML.)
What about emojis?  Markdown neither helps nor blocks emojis, they’re just characters. If your application can handle emojis, you can certainly include them in your markdown.
Commonly used Markdown
Markdown isn’t a formal standard, and a lot of variations have emerged. It all started at Daring Fireball; most implementations are faithful to the original but many have added their own features. For example, the SharePoint Markdown Web Part uses the “Marked” syntax; if you’re creating a README.md file for use in Github, you’ll want to use Github Flavored Markdown (GFM).
This article will stick to the most commonly used features that are likely to be widely supported. Each section will show an example of some markdown and then the finished rendering (which, again, may vary depending on what application you’re using).
Each of the following sections shows an example of some simple Markdown, followed by the formatted result.
1. Emphasizing Text
Markdown:
You can surround text with *single asterisks* or _single underscores_ to emphasize it a little bit;

this usually formatted using italics.
You can surround text with **double asterisks** or __double underscores__ to emphasize it more strongly;

this is usually formatted using bold text.
Result:
You can surround text with single asterisks or single underscores to emphasize it a little bit; this usually formatted using italics.
You can surround text with double asterisks or double underscores to emphasize it more strongly; this is usually formatted using bold text.
2. Headings
You can make headings using by putting several = (for a level 1 heading) or – signs (for a level 2 heading) in the line below your heading text.
Markdown:
Result:
My Heading
You can also make headings with one or more hash marks in column 1. The number of hash marks controls the level of the heading.
Markdown:
# First level heading

## Second level heading

### Third level heading

 etc.
Result:
First level heading
Second level heading
Third level heading
etc.
3. Hyperlinks
Markdown:
To make a hyperlink, surround the text in square brackets

immediately followed by the URL in parenthesis (with no space in

between!) For example:

[Microsoft](https://www.microsoft.com).
Result:
To make a hyperlink, surround the text in square brackets immediately followed by the URL in parenthesis (with no space in between!) For example: Microsoft.
4. Images
Images use almost the same syntax as hyperlinks except they begin with an exclamation point. In this case the “alt” text is in square brackets and the image URL is in parenthesis, with no spaces in between.
Markdown:

Result:
In case you were wondering, you can combine this with the hyperlink like this:
Markdown:
[](http://pnp.github.io)
Result:
5. Paragraphs and line breaks
Markdown:
Markdown will

automatically

remove

single line breaks.
Two line breaks start a new paragraph.
Result:
Markdown will automatically remove single line breaks.
Two line breaks start a new paragraph.
6. Block quotes
Markdown:
Use a greater than sign in column 1 to make block quotes like this:
> Line 1

> Line 2
Result:
Use a greater than sign in column 1 to make block quotes like this:
Line 1 Line 2
7. Bullet lists
Markdown:
Just put a asterisk or dash in front of a line that should be bulleted.
* Here is an item starting with an asterisk

* Here is another item starting with an asterisk

    * Indent to make sub-bullets

        * Like this

– Here is an item with a dash

    – Changing characters makes a new list.
Result:
Just put a asterisk or dash in front of a line that should be bulleted.
- Here is an item starting with an asterisk
- Here is another item starting with an asterisk
- Indent to make sub-bullets
- Here is an item with a dash
- Changing characters makes a new list.
8. Numbered lists
Markdown:
1. Beginning a line with a number makes it a list item.

1. You don’t need to put a specific number; Markdown will renumber for you

8. This is handy if you move items around

    1. Don’t forget you can indent to get sub-items

        1. Or sub-sub-items

1. Another item
Result:
- Beginning a line with a number makes it a list item.
- You don’t need to put a specific number; Markdown will renumber for you
- This is handy if you move items around
- Don’t forget you can indent to get sub-items
- Or sub-sub-items
- Another item
9. Code samples
Many markdown implementations know how to format code by language. (This article was written in Markdown and made extensive use of this feature using “markdown” as the language!) For example to show some HTML:
Markdown:
    ~~~html

    <button type=“button“>Do not push this button</button>

    ~~~
Result:
<button type=“button”>Do not push this button</button>
10. Tables
Tables are not universally supported but they’re so useful they had to be part of this article. Here is a simple table. Separate columns with pipe characters, and don’t worry about making things line up; Markdown will handle that part for you.
Markdown:
Column 1 | Column 2 | Column 3

—|—|—

Value 1a | Value 2a | Value 3a

Value 1b | Value 2b | Value 3b
Result:
Column 1 |
Column 2 |
Column 3 |
|---|
Value 1a |
Value 2a |
Value 3a |
Value 1b |
Value 2b |
Value 3b |
HTML and Markdown
Markdown doesn’t create any old formatted text – it specifically creates HTML. In fact, it was designed as a shorthand for HTML that is easier for humans to read and write.
Many Markdown implementations allow you to insert HTML directly into the middle of your Markdown; this may be limited to certain HTML tags depending on the application. So if you know HTML and you’re not sure how to format something in Markdown, try including the HTML directly!
Editing Markdown
If you’d like to play with Markdown right now, you might like to try the Markdown Previewer where you can type and preview Markdown using any web browser.
For more serious editing, Visual Studio Code does a great job, and has a built-in preview facility. Check the VS Code Markdown documentation for details.
There’s a whole ecosystem of tools around Markdown including converters for Microsoft Word and stand-alone editing apps; these are really too numerous to list but are easy to find by searching the web.
Legacy
From vinyl records to 8-bit games and static web sites, there’s a trend these days to rediscover simpler technologies from the past. Markdown definitely falls into this category.
Back before “WYSIWYG” (What You See Is What You Get) word processors were cheap and pervasive, there were “runoff” utilities that were very much like Markdown. They turned text files into nicely formatted printed documents (usually Postscript). Markdown harkens back to these legacy tools, but adds HTML compatibility and an intuitive syntax.
Conclusion
While it may seem unfamiliar at first, Markdown is intended to make it easy for people to read and write HTML. Whether you’re a power user, IT admin, or developer, you’re bound to run into Markdown sooner or later. Here’s hoping this article makes it a little easier to get started!
by Contributed | May 4, 2021 | Technology
This article is contributed. See the original author and article here.
Performance tuning is often harder than it should be. To help make this task a little easier, the Azure Cognitive Search team recently released new benchmarks, documentation, and a solution that you can use to bootstrap your own performance tests. Together, these additions will give you a deeper understanding of performance factors, how you can meet your scalability and latency requirements, and help set you up for success in the long term.
The goal of this blog post is to give you an overview of performance in Azure Cognitive Search and to point you to resources so you can explore the concept more deeply. We’ll walk through some of the key factors that determine performance in Azure Cognitive Search, show you some performance benchmarks and how you can run your own performance tests, and ultimately provide some tips on how you can diagnose and fix performance issues you might be experiencing.
Key Performance Factors in Azure Cognitive Search
First, it’s important to understand the factors that impact performance. We outline these factors in more depth in this article but at a high level, these factors can be broken down into three categories:
It’s also important to know that both queries and indexing operations compete for the same resources on your search service. Search services are heavily read-optimized to enable fast retrieval of documents. The bias towards query workloads makes indexing more computationally expensive. As a result, a high indexing load will limit the query capacity of your service.
Performance benchmarks
While every scenario is different and we always recommend running your own performance tests (see the next section), it’s helpful to have a benchmark for the performance you can expect. We have created two sets of performance benchmarks that represent realistic workloads that can help you understand how Cognitive Search might work in your scenario.
These benchmarks cover two common scenarios we see from our customers:
- E-commerce search – this benchmark is based on a real customer, CDON, the Nordic region’s largest online marketplace
- Document search – this benchmark is based on queries against the Semantic Scholar dataset
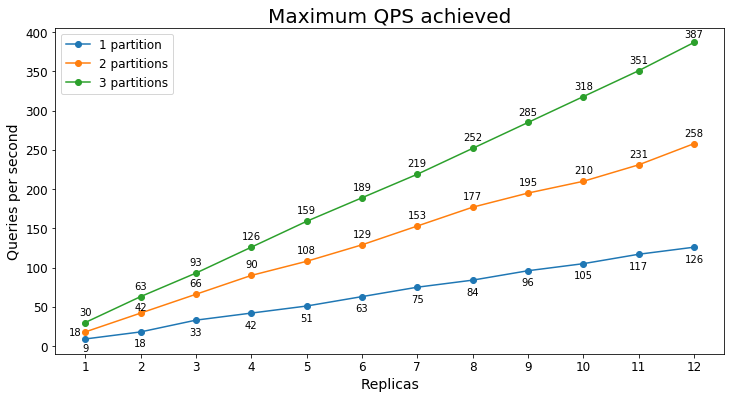
The benchmarks will show you the range of performance you might expect based on your scenario, search service tier, and the number of replicas/partitions you have. For example, in the document search scenario which included 22 GB of documents, the maximum queries per second (QPS) we saw for different configurations of an S1 can be seen in the graph below:
As you can see, the maximum QPS achieved tends to scale linearly with the number of replicas. In this case, there was enough data that adding an additional partition significantly improved the maximum QPS as well.
You can see more details on this and other tests in the performance benchmarks document.
Running your own performance tests
Above all, it’s important to run your own performance tests to validate that your current setup meets your performance requirements. To make it easier to run your own tests, we created a solution containing all the assets needed for you to run scalable load tests. You can find those assets here: Azure-Samples/azure-search-performance-testing.
The solution assumes you have a search service with data already loaded into the search index. We provide a couple of default test strategies that you can use to run the performance test as well as instructions to help you tailor the test to your needs. The test will send a variety of queries to your search service based on a CSV file containing sample queries and you can tune the query volume based on your production requirements.
Apache JMeter is used to run the tests giving you access to industry standard tooling and a rich ecosystem of plugins. The solution also leverages Azure DevOps build pipelines and Terraform to run the tests and deploy the necessary infrastructure on demand. With this, you can scale to as many worker nodes as you need so you won’t be limited by the throughput of the performance testing solution.

After running the tests, you’ll have access to rich telemetry on the results. The test results are integrated with Azure DevOps and you can also download a dashboard from JMeter that allows you to see a range of statistics and graphs on the test results:

Improving performance
If you find your current levels of performance aren’t meeting your needs, there are several different ways to improve performance. The first step to improve performance is understanding why your service isn’t performing as you expect. By turning on diagnostic logging, you can gain access to a rich set of telemetry about your search service—this is the same telemetry that Microsoft Azure engineers use to diagnose performance issues. Once you have diagnostic logs available, there’s step by step documentation on how to analyze your performance.
Finally, you can check out the tips for better performance to see if there are any areas you can improve on.
If you’re still not seeing the performance you expect, feel free to reach out to us at azuresearch_contact@microsoft.com.
by Contributed | May 4, 2021 | Technology
This article is contributed. See the original author and article here.
How to build a fast, scalable data system on Azure SQL Database Hyperscale. Hyperscale’s flexible architecture scales with the pace of your business to process large amounts of data with a small amount of compute in just minutes, and allows you to back up data almost instantaneously.
Zach Fransen, VP of data and AI at Xplor, joins Jeremy Chapman to share how credit card processing firm, Clearent by Xplor, built a fast, scalable merchant transaction reporting system on Azure SQL Database Hyperscale. Take a deep dive on their Hyperscale implementation, from their approach with micro-batching to continuously bring in billions of rows of transactional data, from their on-premises payment fulfillment system at scale, as well as their optimizations for near real-time query performance using clustered column store indexing for data aggregation.
QUICK LINKS:
00:35 — Intro to Clearent
01:33 — Starting point and challenges
03:12 — Clearant’s shift to Hyperscale
04:53 — Near real-time reporting/micro-batching
06:25 — See it in action
08:28 — Processing large amounts of data
09:42 — Namd replicas
10:34 — Query speed ups — clustered column store indexing
11:45 — What’s next for Clearent by Xplor?
12:26 — Wrap up
Link References:
Learn more about Clearent by Xplor and what they’re doing with Hyperscale at https://aka.ms/ClearentMechanics
For more guidance on implementing Azure SQL Database Hyperscale, check out https://aka.ms/MechanicsHyperscale
Unfamiliar with Microsoft Mechanics?
We are Microsoft’s official video series for IT. You can watch and share valuable content and demos of current and upcoming tech from the people who build it at #Microsoft.
Keep getting this insider knowledge, join us on social:
Video Transcript:
– Up next, we meet with credit card processing firm Clearent by Xplor to see how they built a fast, scalable merchant transaction reporting system on Azure SQL Database Hyperscale. From their approach with micro-batching to continuously bring in billions of rows of transactional data from their on-premises payment fulfillment system at scale, as well as their optimizations for near real-time query performance using clustered columnstore indexing for data aggregation and much more. So today, I’m joined by Zach Fransen, who’s the VP of data and AI at Xplor. So welcome to Microsoft Mechanics.
– Thanks. It’s great to be on the show.
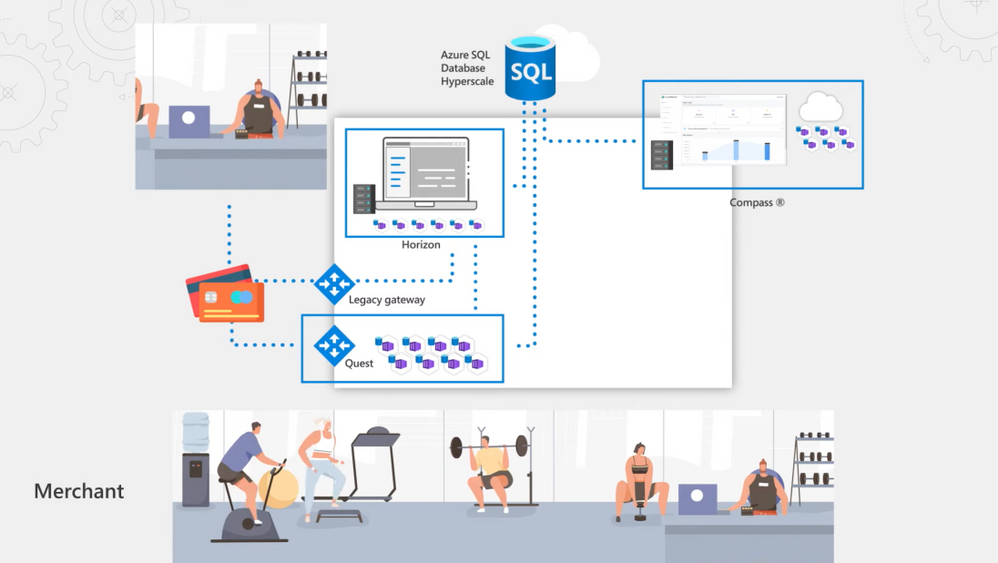
– Thanks so much for joining us today. It’s really great to have you on. So if you’re new to Clearent by Xplor, they’re a US-based payment solution provider that enables merchants and retailers to accept credit card payments from anywhere. They process over 500 million transactions per year. And since their inception in 2005, they’ve built several intelligent solutions to reduce credit card processing fees and significantly speed up the fulfillment of credit card payments with next day funding. Now key to this has been connecting their back-end payment fulfillment system with their transaction reporting system. In fact, they’ve recently completed an app and data modernization effort using Azure SQL Database Hyperscale. Their new Compass Online Reporting Suite gives their customers unprecedented and concurrent access to sales transaction data stored on Azure SQL Hyperscale for near real-time views of revenue, sales trends, and much more. So Zach, to put this effort into context, can you help us understand where you were coming from?
– Sure. So when we started this effort, we were fully on-premises. We had two monolithic legacy apps, Horizon and Compass, running off the same Clearent database. Payments from merchants came in from a legacy third-party mainframe payment gateway and landed in Horizon as flat files. Horizon takes care of qualification, billing, and settling merchant payments. Part of our value add is to pay our merchant customers ahead of the credit agencies. When merchants batch in their sales at the end of the day, the system qualifies the nature of the transaction by checking things like if the transaction was made online or from a card reader via a chip, magnetic strip, or a rewards card. These are all things that determine the cost of the transaction and the fees charged by Visa, Mastercard, Amex and other credit agencies. We also charge a derivative fee based on that, so this is an intricate process to get right. In parallel, our Compass reporting system running on IIS had a SQL Server always on cluster on the same Clearent database back-end that would pull data from Horizon using a stored procedure to transform the data into reporting schemas for merchants to get visibility into their transactions.
– Okay, so how often were you able to pull the data for reporting?
– Well, we did a two-day lookback once a day, so we were having to process two full days of data every day for reporting and we were always a day behind. There was also contention because we were using the same database for processing transactions and reporting. And as our data and customers grew, our run times for processing the data coming into Horizon took longer. Also, concurrent customer queries in Compass would sometimes fail.
– That’s not too surprising. Large database operations like these are prone to performance issues and storage limitations. Plus, you had to find a better way to aggregate the data and make it more available for reporting as well. So what approach then did you take to remediate some of these issues?
– Well, we adopted a hybrid approach which allowed us to keep our data on-premises but migrate the data that we needed for reporting into the Cloud. As our foundation was SQL Server, we wanted to continue to use that skill set and choose an option where we didn’t have to worry about storage limits or syntax changes. We went with the Azure SQL Database Hyperscale service tier that scales to up to 100TB of storage as the reporting back-end for our new Compass Online Reporting Suite. We also modernized the Compass App, taking an extensible microservices-based approach. We built an angular app that calls dozens of services that sit both on-prem and in the Cloud, depending on what it’s trying to do. And we also fragmented our data model to match our service topology. Then, to more consistency bring data in, we built our own payment gateway called Quest, which comprises a consistent set of APIs to pull in merchant data from physical credit card terminals, e-commerce, or integrated payment systems in use by our merchant customers. In fact, as we made it easier to bring data in and broke the Compass app and data monolith apart, Hyperscale’s role in providing a single hub pulling all the data together became even more important. Additionally, we only keep active data on premises, so Hyperscale is critical in keeping a persistent record of all our historical data and to maintaining a lower data footprint on-prem in those transactional systems.
– Okay, so now you’ve got a more scalable and agile app and data layer, but with so many transactions that are happening at any one time, how would you solve for getting the data then into Hyperscale fast enough to support near real-time reporting for your merchants?
– So the game changer for us was adopting low-latency, intraday batch processing, and data streaming. We’ve split our Hyperscale instance into two logical layers, comprising an Operational Data Store and an Enterprise Data Warehouse. And we shifted from once-a-day batch processing to micro-batch processing where we use SQL Server’s Change Data Capture feature to poll our disparate systems for the latest change in data every two minutes. We have data extractors running on our on-premises databases reading our change capture tables, and we have a set of configuration tables sitting in our operational data store that tells it what columns to read. The raw data along with the change history for every table is then loaded into Hyperscale over Express Route into our ODS. And we only extract and load the delta tables in our Enterprise Data Warehouse for reporting and analytics. At the same time, as a credit card transaction is made, Quest immediately places it on a queue, and we use the SQL Server JSON parsing capability to extract out the pieces of information from the message that we are interested in, such as the date, time, and amount of the transaction, and then stream it directly into our star schemas in Hyperscale for reporting so that the data is available to merchants right away.
– This really sounds like a great solution. Can we see it in action?
– Sure. So here is the Compass Online Reporting Suite. On the homepage, you get a quick summary of all of your activity from the last recent deposit through to trends in sales volume. From there, you can drill in to see the detail. I’ll click into one of my deposits. For example, one thing that is useful for merchants is being able to deconstruct a deposit that may just show up as one line item on their bank account statement. In Compass, they can drill in to see the detail behind the deposit whether that’s multiple terminals or multiple batches because Hyperscale is bringing all that data together. Now let me show you what happens as soon as the transaction is made. We’re in the transaction view within a batch. I can see all my recent transactions in this batch. Now I’ll show the process of running a transaction along with where we can view it. I’m in the virtual terminal built on Quest, but this could be a physical terminal or another integrated payment system. I’ll make a credit card transaction. And you’ll see it succeeds in the virtual terminal in under a second. Now I’ll hop over to Compass into our batch view, hit refresh, and you’ll see the payment is pending right away. That’s made possible by Hyperscale instantaneously consuming the data from our messaging queue. Finally, I’ll hop over to my query in SQL Server Management Studio and I’ll query this batch in our Hyperscale database, and you’ll see the results are also instantly available. Next, if we look into our list of settled transactions, you’ll see that once the merchant batches in at the end of the day if they click into a deposit, it shows the amounts and fees along with the net deposit amount and when payment will be posted. I’ll click in to see transactions in this batch. Transaction data is also enriched by the data from our micro-batch processing, as you can see here by optional column views available. I’ll select Product and POS Entry Mode. You’ll see that information show up in our view and these are critical elements that determine the fees for the transaction.
– Okay, so this is an example then of just one transaction, but what if you have maybe 50,000 or more merchants that are running millions of transactions a day?
– Yeah. We process around 1 billion rows of data per month on our Hyperscale implementation right now. As you can see here in the portal, this has amounted to over 28TB. And a big advantage of Hyperscale is that the compute is independent to the size of your data. Let me give you another view from our monitoring tool. Here, the green chart represents Hyperscale. It’s processing a large quantity of billing information as the micro-batch comes in at intervals. It’s actually spiking up to almost 100% utilization, which is around 200,000 IOPS, and incidentally this is only using 8 cores right now which is a relatively small amount of compute. We can elastically scale compute when we need to process a large amount of data or build an index on a giant table with all the history and to scale it up. It only takes a few minutes. Also in Hyperscale, backups are near instantaneous. It’s constantly taking snapshots of your data, which helps significantly with data restore. Through PowerShell, we’ve automated restore when we do full-scale load testing, and that only takes like an hour, even though it’s a 28TB database.
– Okay, so how else then have you configured your Hyperscale implementation?
– Secondary replicas. Not just read-only replicas, but named replicas have been game changing for us. This allowed us to keep our primary instance for our compute intensive ETL and data processing. We can then assign name replicas for specific purposes like analytics and reporting. These tap into a copy of the same data, but have their own dedicated compute. If you recall, when I showed you the slider screen, we had a secondary replica configured for customer traffic, which is part of a scalable pool of replicas for load balancing. If I switch tabs, you can see that we also have a named replica configured to handle analytics traffic. Routing traffic to these replicas is as simple as changing the connection string. This means that critical customer workloads are not interrupted by our compute intensive analytic operations.
– So with such massive amounts of data that are coming in, beyond assigning the right amount of compute, are you doing anything special then to speed up query operations?
– Yes, we do a few things. For example, one of the things we’ve really taken advantage of is clustered columnstore index for data aggregation. A big advantage of Azure SQL Hyperscale is that it’s very flexible. It can handle a variety of different types of traffic and does really rapid aggregation. Here, we have an example of an analytical workload where we are going to take a very large number of records and produce some aggregates. In this particular table, we have a little over 3 billion rows of data. To see some trending, I have a query that will produce a time series by collecting data from different months, which in this case, are in different partitions in a clustered columnstore index. When I run it, you can see it is able to aggregate records across three months in 2021, and it’s almost instantaneous. Another way to look at the data is to look at a cross-section using dimensional slices, like a state. And here, we see the total number of transactions in New York and Washington. So we’re able to look across billions of rows of data and pull these aggregates together in fractions of a second.
– That’s super impressive. And now you’ve transformed then your app and data stack for reporting with Azure SQL Database Hyperscale, but what’s next then for Clearent by Xplor?
– So given our recent merger with the transaction services group to form Xplor, we are taking our Clearent platform international to deliver a service called Xplor Pay with Azure SQL Database Hyperscale as our reporting back-end. And now that we’ve got our data infrastructure to this level of maturity, the next logical step is to leverage Azure Machine Learning. This will help offer additional value-added services to our customers, such as helping them to understand when to run specific promotions based on existing sales.
– Thanks so much, Zach, for joining us today and also giving us the deep dive on your Hyperscale implementation. In fact, to learn more about Clearent by Xplor and what they’re doing with Hyperscale, check out, aka.ms/ClearentMechanics. And for more guidance on implementing Azure SQL Database Hyperscale, check out aka.ms/MechanicsHyperscale. Of course, don’t forget to subscribe to our channel if you haven’t already. Thanks so much for watching. We’ll see you next time.
by Contributed | May 4, 2021 | Technology
This article is contributed. See the original author and article here.
Modernize your existing data at scale, and solve for operational efficiency with Azure SQL Managed Instance. Azure SQL MI is an intelligent, scalable, cloud database service and fully managed SQL server.
Nipun Sharma, lead data architect, joins Jeremy Chapman to share how the Australian subsidiary of large equipment manufacturer, Komatsu, built a scalable and proactive sales and inventory management and customer servicing model on top of Azure SQL Managed Instance to consolidate their legacy data estate on-premises. See what they did to expand their operational visibility and time to insights, including self-service reporting through integration with Power BI.
QUICK LINKS:
00:30 — Komatsu’s background
03:28 — Komatsu’s modernization path
04:12 — Consolidating data to one source
05:50 — Data migration and consolidation of 3 core systems
08:20 — Example reports
09:49 — Self-service reporting
11:17 — Built-in auto tuning
12:45 — What’s next for Komatsu?
13:45 — Wrap up
Unfamiliar with Microsoft Mechanics?
We are Microsoft’s official video series for IT. You can watch and share valuable content and demos of current and upcoming tech from the people who build it at Microsoft.
Keep getting this insider knowledge, join us on social:
Video Transcript:
– Up next, we’re joined by Lead Data Architect Nipun Sharma, to learn how the Australian subsidiary of large equipment manufacturer, Komatsu, built its scalable and proactive sales and inventory management and customer servicing model on top of Azure SQL Managed Instance to consolidate their legacy data estate on premises and drive more self-service reporting with Power BI. So Nipun, welcome to Microsoft Mechanics.
– Thanks for having me here. It’s a pleasure to be on the show.
– And thanks so much for joining us all the way from Australia today. So before we get into this, if you’re new to Komatsu, they’re a leading manufacturer of mining and earth moving equipment for construction around the world. In Australia alone, Komatsu has more than 30,000 machines in daily operation. And as a company, they’re at the forefront of several leading edge solutions in their industry, including smart and autonomous self-driving machinery. Incidentally, the Australian subsidiary spans three different countries in seven regions. So Nipun, with all the expansive area of coverage, what were you trying to solve for?
– So the short answer is operational efficiency. When we started down a modernization path, we were struggling with getting an accurate and timely view of parts, demand, and inventory requirements to meet a customer’s specific needs. Our customers are mainly in mining and construction industries. The uptime of their machines is of critical importance for them and for us. So having the right part at the right place at the right time is vital for operations. From an aftermarket care perspective, to get ahead of inventory requirements we needed more perspective and insight into the drivers behind what customers are requesting. Secondly, on the resource planning side, machine servicing is based on usage. Heavy usage, for example, will accelerate service milestones. At the same time, beyond sourcing the parts needed for servicing, we need to make sure the right skilled technicians are also available. So we wanted to be able to plan those needs more proactively.
– And Komatsu has been around for a long time, but can you tell us what were some of the established systems that were already in play?
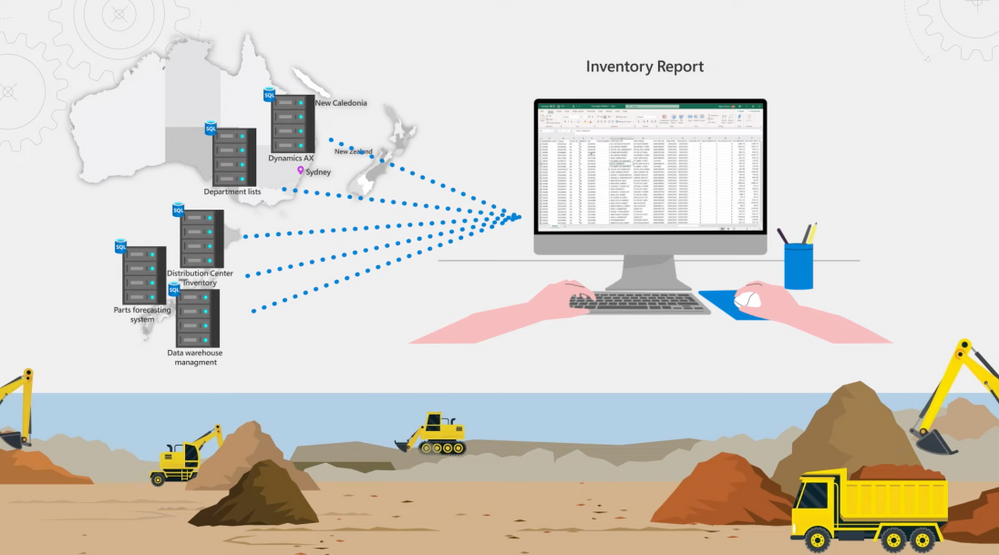
– So yes, this year in fact marks our hundredth anniversary. As you can imagine, we had a blend of legacy and modern applications in our environment used by the business. All systems are fully on-premises. There are around two dozen different source business systems that spans across our Australian subsidiary and our headquarters in Japan. In Japan, we manufacture our machinery. We have systems hosting our satellite telemetry data for our customer machines and other source systems that has component and equipment information, machine contracts, distribution center inventory, and parts ordering systems. Our warehouse management system, including one for stock forecasting and other for planning and logistics is also in Japan. In our Australian subsidiary, we have various ERP systems and customer relationship management systems in use for aftermarket sales and operations. And we have various source systems for field servicing to deploy technicians, local on-board machine systems for diagnostics, branch stock, service meter reading, and more. We maintain a global equipment master system and keep our financial data in SAP. Additionally, when we started there were several dozen Access and SQL server databases in use for file-based source systems. This was managed by our business teams to collate spreadsheets and query volumes of data for weekly snapshot and KPIs.
– Right, that’s a huge amount of data spread across oceans and multiple distributed systems that you were managing.
– Right, we had terabytes of data distributed everywhere, but nothing was connected or available in a consistent manner. People were connecting to data sources through Excel, loading data and files manually for reporting. Pulling a report to get an accurate view of our parts inventory, for example, would require connecting to five different source systems across Japan and our Australian subsidiary, with different schema and different tooling. And the hard part was out-of-date reporting. We were limited to running a batch process once a week. It took 8 to 10 hours. So we ran it on Saturday to avoid impacting our business transactions during the week.
– And these systems were baked into your everyday operations, but what was your approach then that you took for modernizing all of this?
– To move fast, we took a hybrid approach to consolidate our data to a single source of truth across our data estate. We wanted to move to Azure for its data and AI platform capabilities. And we chose Azure SQL Managed Instance for two reasons. The first was compatibility with our SQL implementations. There was almost no code changes, and we were able to leverage the existing skills within the team. We also took advantage of SQL MI VNet support to access the environment from an on-prem network. The second was performance, cost, and dynamic scale. So we could comfortably scale to our needs without any concerns. For example, you can see here, scaling is very easy. We can independently scale, compute and storage. So during our normal business hours, we allocate 16 cores and we can manually scale up for ad hoc needs like data refreshes without interrupting our daily operations. We have also built custom event-based automation in PowerShell. This adds more compute as we load the data for overnight refreshes. It is a simple scripted procedure that we can use on schedule. See, if I do a Get-Command, you’ll see I’m at eight cores. And if I do a set command, you will see it takes a moment to scale up to 24 cores. In our case, we scale up to 24 cores at 9:00 PM each day, so we don’t interfere with business traffic. The data from our source systems is refreshed before the start of the workday, and we scale down in morning at 4:30 AM.
– Okay, so now you had a lot of systems that were in use, but where did you focus then your data migration and consolidation efforts?
– We started by identifying three core systems and we brought this data into Azure SQL MI.
– Okay, so how did these systems then provide an initial foundation for your reporting needs?
– They were instrumental. Our Dynamics AX system holds the key insights for understanding our customer demands for parts. Then our ICT telemetry systems contains satellite data on machine usage, as well as data from onboard systems for specific alerts, events, and warning codes. And it also brings basic time-series data. So based on the hours of usage for a specific machine, we can determine how close it is for specific recommended service milestone. And the actual machine usage shows up in our reports as a Service Meter Reading. Specific events on the machine helps us identify potential failures and proactively support our customers. To add to that, our CMS system, which collects lab data on our oil samples, also provide valuable information about machine health. All this data feeds into our Power BI service via the Power BI gateway, which we set up to provide self-service dashboards, analytics and reporting. And we also use a logic app to refresh our data models once the data is loaded into SQL MI.
– Okay, so how quickly then were you able to expand beyond this kind of core set of services?
– It was radical. Within six to seven months, we started to expand further. We were able to go from almost a working day to pull reports to just 20 minutes with our first iteration. And now by caching the data in Power BI, we can do this in seconds. Since the initial implementation, we have added 17 more business systems without worrying about scaling or performance. We were also able to bring in data from various file sources available only within departments. And we went from 300 gigs to 6 terabytes of data quickly, and from a hundred users to over a thousand consumers of information. In fact, you can see the types of reports the users are generating here. All of these reports were not even possible before. We are streamlining data sets, sources and models so that everyone is working from one source of the truth. We now have around 70 Power BI citizen developers sitting across business teams, building reports around the same data. And we can refresh and pull reports in just a few seconds now.
– Nice, so can we see some of the reports then that you’re now able to build?
– Sure, let me pull up a few for you. Here’s an example. I can see upcoming service milestones by equipment type and location and required parts for the same. If I want to know how many excavators are due for their thousand hour service, I can click here in the excavator bar. Here I can see the regions where the machines are running and the parts required for them. This is something that was not possible before, because the data was either locked into our system or just not available.
– How does this now help with your inventory reporting?
– Oh, we have completely transformed the visibility we had. So let me show you. Here’s an inventory report that our business team were able to create to track parts on hand for customer service requests. The data from this report is sitting across multiple sources and all put together in SQL MI. We can see part stock levels per region represented by DC, Distribution Center values. I can drill into parts available for specific machine type, like excavator, and see quickly the status of this machine. Now the teal color means we’re covered, but doesn’t tell the entire story because some of the parts categories don’t need inventory on hand. If I filter the national demand ranking here to look at the top ranked parts indicated by A, you see we have nothing to worry about, we have a healthy supply.
– And of course, the dashboard is only half the story. So what are you doing then to support this type of self-service reporting?
– Right, the amazing thing for us is having the data in one source. And depending on the question our business is trying to answer, we obviously prep the data and connect the dots at the backend. For example, here’s the backend data model behind these fields that our business users have created linking various tables. Even if you knew where to find the data as a business analyst, most of these tables and the underlying data fields don’t exist. My team implements the business logic to map the data into business semantic layer, to make it more consumable and consistent across the business. Let me give you an example of what goes into this. Here’s SQL Server Management Studio, we build custom views correlating data from different sources. In the first query and tab, we are pulling all the different sources where our inventory currently sits. Main indicates our primary inventory system. Then as I scroll down, you will see we are connecting related data from distribution center and also from branch locations. This paints an accurate picture of inventory across all our repos. Next, in the second tab, this query is all about calculating minimum inventory levels to ensure we have enough stock on hand. You can see here, we are also including incoming deliveries as you see with the items marked on order. This helps ensure that we keep the inventory in line with demand.
– So then, with so much growth then in your data, how were you able to maintain consistency in performance?
– So Azure SQL MI has built-in auto tuning. It will automatically index your main updates and your queries. But there’s also optimizations that you can do to help auto tuning to work better for you. When indexes are created, tables need to be republished. Otherwise the ordering of data on the disk becomes fragmented, impacting your IOPS. To solve this, we update the statistics by prioritizing which tables are most required at the semantic layer for querying. The nice thing with SQL MI is that management is very consistent compared to SQL server running on a physical or a virtual machine. We have a diagnostic script that we can run and list out all big tables and look at the percentage of fragmentation and page counts. If fragmentation is over 80%, we can run another script to fix the fragmentation. To automate this process, we run a stored procedure to defragment the index tables weekly. This is a standard script from Microsoft, and we’ve just added a filter for our biggest schema called DSA for our semantic querying layer. This re-indexes and reformats the table and updates the stats to keep everything under 70% fragmentation. These procedures run every Saturday morning and it takes few hours, but afterwards, all the big tables are tuned for best performance.
– I’m going to say great work from you and the team to really modernize data and the operations at Komatsu. So where do the things then go from here?
– The great thing about being in the cloud is that our implementation grows with us. As you saw, our data has grown 20x and our users 10x, and we have added additional managed instances to support the demand. We also have a great option to grow as we need in Azure. And the next journey is more ad hoc exploration and predictive analytics. We are looking at Azure Synapse Analytics to take advantage of data warehousing as our data footprint grows, especially with our increased investment in IoT and connected machinery at the Edge. Here, you’re seeing the data we have pulled in, and these are the linked services that we are using with Synapse. We have already started experimenting with bringing in our source system data, like SAP HANA, to integrate across data sets and even better insights and data exploration. And we’ll continue to use Azure SQL MI for new apps that we build on Azure.
– Thanks so much Nipun, for joining us today and also sharing Komatsu’s story and implementation for Azure SQL Managed Instance. And also for more hands-on deep dives like this, keep checking back to Microsoft Mechanics. Subscribe to our channel if you haven’t yet, and we’ll see you soon.
by Contributed | May 4, 2021 | Technology
This article is contributed. See the original author and article here.
The .NET Azure IoT Hub SDK team released the latest LTS (Long-Term Support) of the device and service SDKs for .NET. This LTS version, tagged lts_2021-2-18, adds bug fixes, some improvements, and new features over the previous LTS (lts_2020-9-23), such as:
– Handle twin failures using AMQP.
– Make the DeviceClient and ModuleClient extensible.
– Install the device chain certificates using the SDK.
– Make DPS class ClientWebSocketChannel disposable.
– Use CultureInvariant for validating device connection string values.
– Reduce memory footprint of CertificateInstaller.
– Add an API to set a callback for receiving C2D.
– Make set desired property update method thread safe.
– Add support for disabling callbacks for properties and methods.
– Expose DTDL model Id property for pnp devices.
– Make payload in the invoke command API optional.
– Add APIs to get attestation mechanism.
– Improved logging for noting when the no-retry policy is enabled, in the MQTT/AMQP/HTTP transport layers, in the HttpRegistryManager, and in the AmqpServiceClient.
For detailed list of feature and bug fixes please consult the comparing changes with previous LTS: Comparing lts_2020-9-23…lts_2021-3-18 · Azure/azure-iot-sdk-csharp (github.com)
The following NuGet versions have been marked as LTS.
- Microsoft.Azure.Devices: 1.31.0
- Microsoft.Azure.Devices.Client: 1.36.0
- Microsoft.Azure.Devices.Shared: 1.27.0
- Microsoft.Azure.Devices.Provisioning.Client: 1.16.3
- Microsoft.Azure.Devices.Provisioning.Transport.Amqp: 1.13.4
- Microsoft.Azure.Devices.Provisioning.Transport.Http: 1.12.3
- Microsoft.Azure.Devices.Provisioning.Transport.Mqtt: 1.14.0
- Microsoft.Azure.Devices.Provisioning.Security.Tpm: 1.12.3
- Microsoft.Azure.Devices.Provisioning.Service: 1.16.3
More detail on the LTS 2021-03-18 version can be found here.
Enjoy this new LTS version.
Eric for the Azure IoT .NET Managed SDK team
by Contributed | May 4, 2021 | Technology
This article is contributed. See the original author and article here.
Take a closer look at Microsoft Dataverse, a managed service that securely shapes, stores, and manages any data across your business apps, from ERP systems to user generated Power Apps. Dataverse empowers citizen developers to quickly develop apps at scale, and pro developers to easily create apps that interoperate across multiple systems. Marc Mercuri, engineering lead, joins Jeremy Chapman to show how Dataverse is a great data backend for any app and any developer — without the need to architect, implement or manage it.
Dataverse for Microsoft Teams:
- Provides the data layer behind the Power Apps integration with Teams.
- As you build data rich apps, it places text and file based data in the right data store.
- Great for everyday, no-code apps built in Teams.
- Scales to a million rows, or 2GB.
Dataverse in Power Apps Studio:
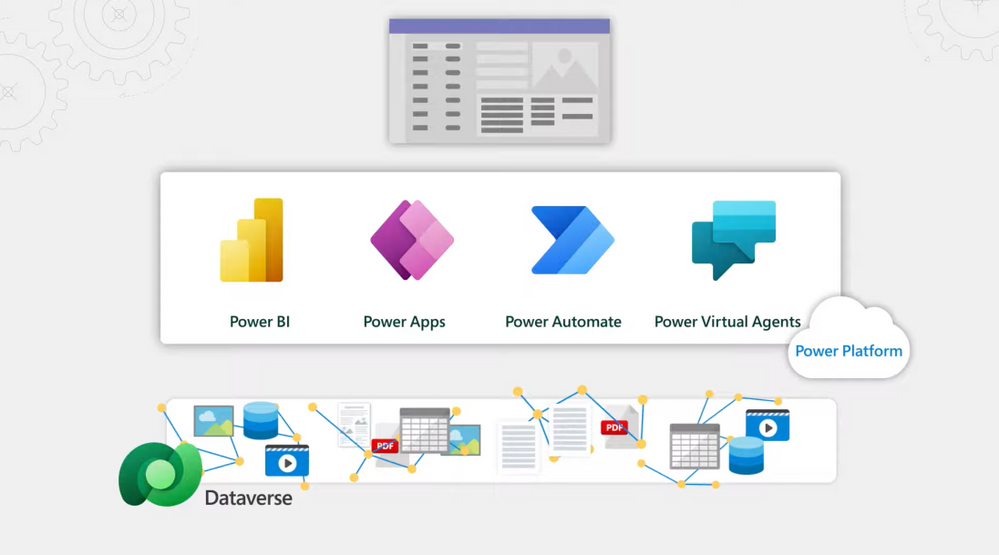
- Works as the backend service that powers Power Apps, Power Automate, Power Virtual Agents and Power BI.
- More capacity, control and capabilities.
- Built on additional enterprise-grade Azure services for larger scale, data integration, relevance search, off-line support and more granular security.
- Scales to 4TB or more.
Dataverse Pro-Dev:
- Easily bring in existing data for an app.
- Use virtual tables to directly call your remote data without importing or moving it.
- Greater control and security options.
- Build search into your apps and even into your processes or bots.
Video Transcript:
– Up next, we’re joined by engineering lead Marc Mercuri to take a closer look at Microsoft’s Dataverse service that provides a scalable and secure managed data layer through user-generated Power Apps built in Teams all the way through to business systems built on the Power platform. So Mark, welcome back to the show.
– Thanks, it’s great to be back.
– Thanks for joining us today. So Charles Lamanna was on a few months back and he recently introduced Dataverse for Teams which greatly simplifies the maker experience by taking care of the data backend for your apps. But that said, I think a lot of people might be surprised to know that Dataverse is a broader service, it’s full service in its own right and you can also upgrade to Dataverse from Teams and it can also be used independent of Teams with the Power Platforms as your apps scale out.
– That’s right. Dataverse is a managed service for your data that supports any app and any developer, whether you’re a citizen developer, a little bit more seasoned or a pro dev. It removes the complexity for managing your data backend, so you can focus just on building your app. Now as you pointed out, there really are two flavors of Dataverse. First, Dataverse for Teams. Here, as you build data rich apps, it knows to place your text and file-based data in the right store. You don’t need to think about it. It scales to a million rows or two GB, and it’s great for no-code apps that might be built in Teams. Second, if you want more capacity, control or capabilities, we call the three C’s, we have the Dataverse service that works as the backend and sits under the Power Platform for Power Apps and Power Automate and Power Virtual Agents. This is built on additional enterprise-grade Azure services under the covers for data integration, relevant search, offline support, more granular security. And that scales to four TB or more. Now, let me tell you a story where this is really powerful. We recently had a customer where they wanted to have a mobile app extended to pull data in from a database, also include images. They wanted to add relevant search and have the app call a single API which they planned to create themselves. Now this required them to work with four different services, different APIs, each with their own scalability, resiliency, considerations, and metering. Now all this extra work was eliminated by using Dataverse, because it uses the same great Azure service behind the scenes and exposes it via a single API. And so they’re only using a single service.
– Got it, so this is pretty turnkey data management. Instead of placing together all the different å la cart components, it’s one cohesive managed service. But can you show us how to get it and the types of things that you can do once you’re using Dataverse?
– Sure. You can easily get started with Dataverse by using Dataverse for Teams, which is included as part of Teams enterprise licenses. I’m going to go ahead and build a simple data entry app for invoicing in just a few minutes. All you need to do to get to it in Teams is build a Power App. Now in my case, I already have installed Power Apps in Teams and have it pinned on the left rail. Now earlier I created the Distributors table and we’ll be using this in a minute. But I’ll create a brand new app by clicking new and then I’ll click app. And we’ll call it Northwind Invoices. And I’m going to click this button to create a new table. And then we’ll name it the same as the app. This is the visual table editor. You can see it’s out of the default column. I’m going to rename that to invoice ID. Now there’s a distributor that will be assigned to this invoice. You can see I have all these different data types to choose from. I’ll go ahead and add a lookup to the table named Distributors. Behind the scenes it’s also creating a relationship between my new table and distributors. So when I click into this column you’ll see the values from the other table. Now I’ll add a column for amount and we’ll use a decimal data type for that. And finally, we want to track the status. I’ll name this Invoice Status, and I’ll select the field type choice and enter three options. First I’ll do paid and I’ll associate a green color with it. Then outstanding with yellow and finally overdue with red. Now let me add a couple of rows of data. I’ll add an invoice ID. Distributor is Woodgrove. Amount of 25,000, and the invoice status equals paid. I’ll add another for Contoso for 100,000 and overdue. I’m going to close my table. Boom, look at that. Not only do I have my table but it’s automatically bound to the controls in the app. I can see what I just entered into the table and easily create a new record with the new record button. So with just a few minutes I created an app that can handle my invoices right within Teams.
– Now that seemed all pretty simple to set up and get all the data entry parts working. But what’s happening then under the covers?
– Yeah, behind the scenes when we created the table, it’s building out a table in SQL. Now when I did a lookup, it created a relationship for me between my Northwind invoices table and the distributors table automatically, and also behind each field is an entire security layer for authentication, with identity and access management. Now, if we go back into Teams and click build, then see all it’ll take me to my solution explorer. Now I’ll click into the tables, select the Northwind invoices just built, and you saw me build four columns. But if I change the view to all you’ll see both the ones I created and a set of system-generated columns. So with these additional columns you can see who created each record, when, when was it last modified, and much more. And so these columns are very useful when you want to build reports based on activities like how many records were entered in a time period or how many did a specific person enter? It also automatically built relationships between different tables. If I wanted to create additional ones, I can do that here. Many to one, one to many, or many to many.
– All this unlocks all the querying potential in your data, adding metadata that you might not have thought about all automatically. Of course you might be building the next killer app though that gets super popular in your company. So can we take a look at what the broader Dataverse service then would give you?
– Sure, and you can easily upgrade to the Dataverse service if that’s the case. To give you an idea of what you can gain, I’ll show you another scenario that’s more advanced than our last one. Here I have an order management system. You can see our app front-end for orders and behind it there is data for invoices, customers, employees, products, shippers, suppliers, orders, purchase orders, inventory transactions, and more. We also have more relationships behind the scenes. In fact, there are 152. For what we’re trying to do, you can see that the Dataverse service in this case is the right choice. This is because, going back to our three C’s, from a capacity perspective, we have a lot of images and we’re targeting more than a million orders. And so this exceeds the capacity of Dataverse for Teams. Then from a capability perspective, we want to add things like business rules, search capabilities for a bot that we’re building. And we also want to be able to run the app outside of Teams. And for control, we’re taking advantage of fine-grain security controls like custom role-based access to manage data.
– On that last point, if you want to learn more about what controls are available for security and governance with Dataverse and also the broader Power Platform, we’ve covered that on our recent shows with Charles Lamanna and also Julie Strauss that you can check out at aka.ms/PowerPlatformGovernance. So can you walk us through though the additional things that you can do with the Dataverse service?
– Sure. First thing, going back to the table there you can see we’ve got a lot more options in Dataverse: business rules, forms, dashboards, charts, keys, and data. Before I showed you columns and relationships but let’s take a look at business rules. You also want to be able to execute logic against your data. And we have a number of options in Dataverse, with business rules, for low-code no-code and capabilities like plugins for pro dev. But here let’s build a new business rule. In this case, we’ll create a simple one. If the amount is over 25,000, we’ll make shipping free. Now in the business rules designer, you can see that there is already a condition here. We’ll create a rule called Check Order Amount. And here we’re checking if the value of amount due to see if it is greater than 25,000. If it is, we’ll take an action to apply discount for our shipping and we’ll set the amount to zero. Then we’ll hit apply and now there’s a business rule.
– Now that logic by the way will be automated and keep running in the future. And you mentioned though that the app has more than a million rows or will have more than a million rows. So how easy is it then to bring in existing data that you might have already into Dataverse?
– Well, there are a lot of ways to bring data in and we’ll start with the most popular way, which is using Dataflows. I’ll create a new one and start from blank. I’ll call it Order import. And there are a ton of options here for both structured and unstructured data from common sources and types. You see file, database, Power Platform, Azure online services and others including things like SharePoint lists. In my case though, I’ll use a CSV. I’ll paste in the path of the file. You’ll see it parse the columns and everything looks good. So I’ll go ahead and hit transform data. From here, I can edit the table further, but I’ll keep it as is. And if you notice this is the original access data set from Northwind traders from 25 years ago. Still works though in our case so we’ll use it. We’ll go ahead and hit next. If I had an existing table I wanted to import the data into, I could specify it here. In my case, I’ll load it to a new table, give it a name Orders, and use the same display name, and then type in a description. It’s found the data types for each column and for anything it can’t match it will choose text, which can be changed if you want. I’ll keep what’s here and hit next. Here if the data is continuously refreshed, I can setup polling intervals and I’ll define when to start. Or I can go ahead and choose specific days and times. In my case, I’ll choose daily at 5:00 PM and hit create. So now the data’s imported and it will continue refreshing on my defined schedule. And while I showed options for importing, it’s important to know you can also use what’s called virtual tables to directly call your remote data without importing it or moving it. And you can learn more about them at aka.ms/virtualtablemechanics.
– Okay, so it looks pretty easy then to bring data in and create business rules. But you also mentioned there’s built-in search as part of Dataverse as well. How do you integrate then search as part of an app experience?
– So yes, Dataverse let’s you tap into Azure search under the covers. And you can use that to build search directly into your apps, even into your processes or bots. In fact, I’m going to show you search in the context of building a chatbot. To do that, we’ll use Power Virtual Agents. Now in our case, I’m building a simple bot to find people and contact them. The logic behind the bot in this case uses Power Automate. And the data in search will use Dataverse. Let’s hop over to our cloud flow and Power Automate. This starts with our bot input as a trigger and it’s passing in the value to result variable which will be used to store our results. And here in the search rows action, I’m passing it by search input, which would be a person’s name. And in our case, we can leave the default until we get the table filter items. We’ll only focus on tables where we can find people, like customer, account, employee and contact. The we’ll loop through the list of rows that come back from the search. We’ll parse each of them. And we’ll add them to the value that will be returning to the bot. Now because we’re building a results table, we need to define the column headers for that response. If I add current row from search results, these are all the values we want to display in our table. You’ll see search, score, full name, email, and telephone. Finally, we’ll pass those values back to our bot. Let’s try it out. I’ll initiate the conversation with help me find someone. It’s going to ask me what’s the name of the person you’re looking for? And I’m going to type Helen Wilcox. Now it’s running our cloud flow and it returns two results. Helena Wilcox and Helen Garrett. The score is higher as you’ll see for Helena even though I spelled her name wrong. And from here, I can even use the fields in the table to email or call her. See if I click here, it’ll even start a Teams call. And that’s how easy it is to include search into chatbots, Power Apps, and even your custom code using a flow.
– Great, so now you’ve shown us how you can actually progress from an app that’s built in Teams to a robust business system and have Dataverse manage the entire backend, in addition to supporting some enterprise capabilities like search, all with low- to zero-code. But how would you then use Dataverse if you’re a professional developer?
– So as a professional developer, Dataverse, as I mentioned earlier, gives you a single API to connect to the service. This API can also be extended with your own methods. This is useful, for example, if you’re in the retail industry and you might want to expose a reusable function for something like calculating tax, and you can do this without having to create or host your own API. Dataverse also gives you an event pipeline. You can use what we call plugins to insert custom C# code before and after an operation is performed. And we’ve got some great code samples to help you get started. You can find those at aka.ms/DataversePlugins. Now there are four places in the pipeline where you can use plugins. We first receive an API request. Validation handlers can throw custom exceptions to reject specific operations, such as rejecting incorrectly formatted information like an email address. Then before the data operation is executed, pre-operation handlers can apply logic, such as applying a discount based on the properties of an order. Post-operation handlers can modify responses or take action after the operation, such as communicating with the web service for our fulfillment system. And then you have async handlers and they can perform automation after the response is returned. For example, it can send an order confirmation to the customer. Everything we talked about happens in the context of a pipeline but you may want to do some things asynchronously. Dataverse also supports event integration with Service bus, Event hub, and Webhooks to integrate with any app you may have. You can trigger Azure functions which supports many of the most popular enterprise languages. So you could do that same web service call to our fulfillment system using Java.
– Awesome stuff. And it really looks like a great data backend really for any app and any developer without the need to architect and implement and manage it. So if you’re new to Dataverse though, what’s the best way to get started?
– I would recommend that you start building Power Apps, whether that’s in Teams or right from Power Apps Studio. If your app grows and you started in Teams you can easily upgrade to Dataverse. We’ve also got a ton of guidance and tutorials available for you. You can find those at aka.ms/DataverseMechanics.
– Thanks so much for joining us today, Marc. And by the way, keep watching Microsoft Mechanics for all the latest updates. Subscribe, if you haven’t yet. And we’ll see you soon.

Recent Comments