by Scott Muniz | Jun 30, 2021 | Security, Technology
This article is contributed. See the original author and article here.
CISA has released a new module in its Cyber Security Evaluation Tool (CSET): the Ransomware Readiness Assessment (RRA). CSET is a desktop software tool that guides network defenders through a step-by-step process to evaluate their cybersecurity practices on their networks. CSET—applicable to both information technology (IT) and industrial control system (ICS) networks—enables users to perform a comprehensive evaluation of their cybersecurity posture using many recognized government and industry standards and recommendations.
The RRA is a self-assessment based on a tiered set of practices to help organizations better assess how well they are equipped to defend and recover from a ransomware incident. CISA has tailored the RRA to varying levels of ransomware threat readiness to make it useful to all organizations regardless of their current cybersecurity maturity. The RRA:
- Helps organizations evaluate their cybersecurity posture, with respect to ransomware, against recognized standards and best practice recommendations in a systematic, disciplined, and repeatable manner.
- Guides asset owners and operators through a systematic process to evaluate their operational technology (OT) and information technology (IT) network security practices against the ransomware threat.
- Provides an analysis dashboard with graphs and tables that present the assessment results in both summary and detailed form.
CISA strongly encourages all organizations to take the CSET Ransomware Readiness Assessment, available at https://github.com/cisagov/cset/.
by Contributed | Jun 30, 2021 | Technology
This article is contributed. See the original author and article here.
The Azure Maps team is happy to announce that the Azure Maps Android SDK is now generally available. The team worked hard to ensure good alignment of the core feature set in the Azure Maps Web SDK to create a consistent developer experience. If you don’t have an Azure Maps account, sign up now for free. Some of the key improvements added to this update include:
- Data-driven style expressions
- Vector tile support
- Additional rendering layers
- And much more!
Data-driven style expressions
Azure Maps SDK’s leverage the Mapbox style specification and uses MapLibre GL based libraries as an underlying rendering engine. Data-driven style expressions allow you to add business logic to individual styling options which take into consideration the properties defined on each shape in a data source. Data-driven styles can greatly reduce the amount of code required to write and define similar business logic using if-statements and monitoring map events. Additionally, these allow the business logic to be processed at render time and offloaded to the GPU for better performance.
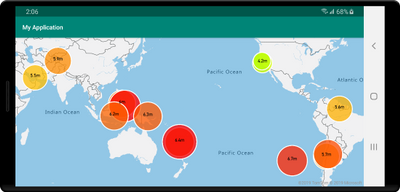
As an example, take into consideration earthquake data. Each data point has a magnitude property. To show the related magnitude of each data point on a map we might want to draw scaled circles using the BubbleLayer when the larger the magnitude of a data point, the larger the radius of the circle. The following code demonstrates how to apply data-driven style to the radius option in the BubbleLayer, which will scale the radius based on the magnitude property of each data point on a linear scale from 2 pixels, magnitude of 0 to 40 pixels, and the magnitude is 8.
BubbleLayer layer = new BubbleLayer(source,
      bubbleRadius(
             interpolate(
                   linear(),
                   get("magnitude"),
                   stop(0, 2f),
                   stop(8, 40f)
             )
      )
);
We could also apply a similar data driven style which defines the color of each circle and generate a map that looks like the following.
The Azure Maps Web SDK has similar style expression support, although in a JSON format. These JSON formatted expressions can be used with the Android SDK as well by serializing them as a string and passing them into Expression.raw method which will parse it for you. For example, the following two expressions do the same thing:
//Native Android expression class
Expression exp = Expression.get("title")

//Parsing a stringified JSON expression.
Expression exp = Expression.raw("['get','title']")
See the documentation to learn more.
Vector tile source support
Vector tiles are a newer geospatial data format that makes it fast and easy to render massive datasets on an interactive map while having full control of styling and interactions locally within the map.
Vector tile layers use the same tile pyramid system as tile layers but contain raw compressed vector data while tile layers render raster imagers. The data in a vector tile contain geographic features in the form of points, lines, and polygons. There are several advantages of using vector tile layers instead of raster tile layers:
- The file size of a vector tile is typically much smaller than an equivalent raster tile. As such, less bandwidth is used. It means lower latency, a faster map, and a better user experience.
- Since vector tiles are rendered on the client, they adapt to the resolution of the device they’re being displayed on. As a result, the rendered maps appear more well defined, with crystal clear labels.
- Changing the style of the data in the vector maps doesn’t require downloading the data again, since the new style can be applied on the client. In contrast, changing the style of a raster tile layer typically requires loading a new set tiles from the server.
- Since the data is delivered in vector form, there’s less server-side processing required to prepare the data. As a result, the newer data can be made available faster.
Azure Maps adheres to the Mapbox Vector Tile Specification, an open standard. See the documentation to learn more.
Additional rendering layers
The Azure Maps Android SDK already provides rendering layers for symbols, lines, polygons, and tile layers. With this update several additional rendering layers have been made available.
Bubble layer – easily render points as scaled circles on the map. Documentation
 Map showing points on a map
Heatmap layer – show the density and “hot spots” of a set of points on the map. Documentation
 Map showing points as a heat map
Polygon extrusion layer – vertically stretch polygons to create bar charts or buildings. Documentation
 Map with extruded polygons or state boundaries
Image layer – overlay georeferenced images as a layer on the map. Documentation
 Map with an image of overlaid on top
Additional improvements
The following are some additional improvements that have been added.
- Clustering of point data in a data source.
- Easily import GeoJSON file into a data source.
- Improved traffic incident integration based on vector tiles for better performance. Also the ability to filter traffic incidents by category and magnitude.
- UI controls for zooming, pitching, and rotating the map, as well as a control for toggling traffic overlays on and off.
- New popup class similar to Web SDK.
- Easily modify the color of the built-in marker icon.
- Improved documentation with examples in Java and Kotlin.
We want to hear from you
We are always working to grow and improve the Azure Maps platform and want to hear from you. We’re here to help and want to make sure you get the most out of the Azure Maps platform.
- Have a feature request? Having an issue getting your code to work? Have a topic you would like us to cover on the Azure blog? Ask us on the Azure Maps forums.
- Looking for code samples? There’s a plethora of them on our Azure Maps Code Sample site. Wrote a great one you want to share? Join us on GitHub.
To learn more, read the Azure Maps documentation

by Contributed | Jun 30, 2021 | Technology
This article is contributed. See the original author and article here.
Meet Kiki, a 6-year-old Southern Resident orca living in the Salish Sea. She is a member of the Southern Resident orca population which has been declining in numbers to the point of being listed as an endangered species. What are the factors contributing to this decline? Let’s use data explore this question.
Orca swimming just under the surface of the water. Image courtesy of Karoline and Gary Cullen.
Data science is an essential 21st century skill and one of the fastest growing fields. Through the Day of Data program, introduce your students to important data skills using engaging interdisciplinary subjects. With Day of Data: Orcas, coming soon on World Orca Day (July 14th), students engage with data to better understand Kiki, her family, and factors contributing to the decline of the Southern Resident orca population. These self-contained, standards-aligned lessons are suitable for in class, remote, and hybrid learning.
“We need to teach data literacy in order to prepare our students for the future workforce.”
Middle School Educator
Using the Day of Data: Orcas lessons, students will learn transferrable data literacy skills. Students conduct data-driven research and analysis while interacting with multiple sources of data including data types powered by Wolfram. Students use this information to provide evidence for explanations and to generate new questions that can be answered using data.
Today’s learners will enter a world defined by data. Analyzing and extracting key insights from data will become necessary and expected skills for the workforce of the future. Prepare your students by tapping into their creativity and curiosity with Microsoft Hacking STEM – go swimming with the orcas!

by Contributed | Jun 30, 2021 | Technology
This article is contributed. See the original author and article here.
Welcome to the monthly Healthcare and Life Sciences blog recap, June edition! Check out the highlights below:
Azure API for FHIR
- Supporting CMS Interoperability and Patient Access Final Rules: Learn how the Azure API for FHIR now has features that will help customers achieve compliance for the Interoperability and Patient Access final rule. Click here to read the post.
Power BI
- Power BI Premium Gen 2 Webinar: Learn how the Premium Gen 2 service update increases the value your organization gets from Power BI Premium. Watch the webinar here.
- Free Power BI Training: Interested in hands on Power BI learning for business users? Click here to register.
- Planning for Secure and Scalable Power BI Enterprise Architecture with Sensitive Data: Learn best practices for planning secure and scalable Power BI Enterprise Architecture with Sensitive Data at the core. Click here to learn more.
COVID-19
- COVID-19 Healthcare App Challenge: IQVIA and Microsoft have partnered on sponsoring the COVID-19 Healthcare App Challenge Hackathon. The hackathon is open to participants worldwide and provides a great opportunity to assist with the medical community by also compete for prizes. Click here to learn more.
- Vaccine Volunteer Management: Learn how to create role-based scheduling with Shifts in Teams and the Power Platform. Click here to read the post.
Microsoft Viva
- How Microsoft Viva Can Enhance Your Employee Experience: Interested in learning more about Microsoft Viva? In this webinar, learn how Viva Connections, Viva Topics, Viva Learning, and Viva Insights can enhance your employee experience. Click here to watch.
Confessions of Health Geeks
- The Future of Nursing 2020 to 2030 Health Equity: On this episode, Dr. Vickie Tiase, Director of Research at New York Presbyterian Hospital discusses how technology can help achieve the goals outlined in the 2020 to 2030 Health Equity report. Watch the episode here.
- Jaimie Fox – Top 50 Technical Visionary by Intercon: Learn how Jaimie Fox has helped a large EMR company leverage the Microsoft Clouds and how she earned the Top 50 Technical Visionary Award by Intercon. Click here to learn more.
- Meet the Microsoft Managing Director of the Health and Life Sciences Industry Team: In this episode, Kathy Van Enkevort shares her extensive health background and a few of her ideas on how to transform healthcare. Click here to watch.
MidDay Café
- PowerPoint Live in Teams, PowerPoint Recording, and More: On this episode, the MidDay Café crew breaks down some of the cool things you can do with Microsoft PowerPoint in Teams presentations. Click here to watch.
- Accessibility: Learn about Microsoft accessibility features including the Microsoft Immersive Reader, Dictation in Microsoft Outlook and Word in iOS, and accessibility settings within Microsoft Windows and Power BI. Click here to learn more.
- Operator Connect for Microsoft Teams: In this episode, learn how to connect to existing phone carriers with Microsoft Operator Connect in Teams. Click here to watch.
HLS Show Me How
- Leveraging Rich Media in Microsoft Viva Connections: Learn how to kick your next generation Intranet up a notch by adding video from Microsoft Stream and YouTube to your Microsoft Viva Connections portal. Click here to watch.
Surface Podcast Series
- The New Surface Podcast Series: Join in weekly to learn about the current state of Surface hardware and how it fits into the world of Health and Life Sciences. Click here to learn more.
January’s HLS Blog Contributors:

Michael Gannotti, Principal Technical Specialist, Microsoft Teams

Claire Bonaci, Director, Business Development, Health and Life Sciences

Vasu Sharma, Senior Customer Success Manager, Microsoft Teams

Kendra Burgess, Senior Technical Specialist, Business Applications

Linishya Vaz, Product Marketing Manager, Health and Life Sciences

Greg Beaumont, Senior Technical Specialist, Intelligence

Alfred Ojukwu, Senior Surface Specialist, Health and Life Sciences
Thanks for reading and let us know how else our Microsoft team can help!

Erin Spencer, Technical Specialist, Microsoft Teams

by Contributed | Jun 30, 2021 | Technology
This article is contributed. See the original author and article here.
Welcome back to Reconnect, the biweekly series that catches up with former MVPs and their current activities.
This week we are thrilled to be joined by none other than 10-time MVP titleholder Jonathan Kehayias! Based in Tampa, Florida, Jonathan counts more than 10 years of experience in database design, development, administration, virtualization, performance tuning, disaster recovery and consolidation.
Currently, Jonathan is employed as a Principal Consultant and Trainer for SQLskills, one of the best-known and most respected SQL Server training and consulting companies in the world.
Jonathan is a performance tuning expert for both SQL Server and hardware, and has architected complex systems as a developer and business analyst. He also has extensive development (T-SQL, C#, and ASP.Net), hardware and virtualization design expertise, Windows expertise, Active Directory experience, and IIS administration experience.
Jonathan is also keen to share this knowledge with the local community, with current projects including speaking at public events local to Tampa and taking part in the Tampa SQL Users Group.
Outside of tech, Jonathan is a Drill Sergeant in the US Army Reserves and is married with two young children. On most nights he can be found at the playground, in a swimming pool, or at the beach with his kids.
For more on Jonathan, check out his blog and Twitter @sqlpoolboy

Recent Comments