Update 2103 for Microsoft Endpoint Configuration Manager current branch is now available
This article is contributed. See the original author and article here.
Update 2103 for Microsoft Endpoint Configuration Manager current branch is now available. Microsoft Endpoint Manager is an integrated solution for managing all your devices. Microsoft brings together Configuration Manager and Intune into a single console called Microsoft Endpoint Manager admin center.
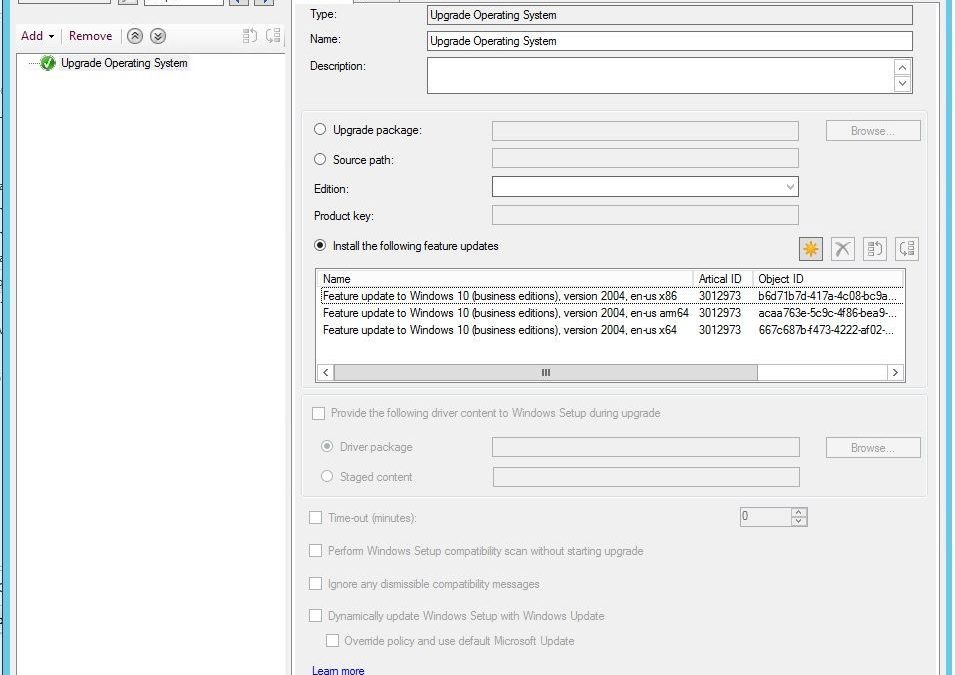
You can now upgrade a client’s Windows OS by using a feature update deployed with a task sequence. This integration combines the simplicity of Windows servicing with the flexibility of task sequences. Servicing uses content that you synchronize through the software update point. This process simplifies the need to manually get, import, and maintain the Windows image content used with a standard task sequence to upgrade Windows.
 feature update with task sequence
The size of the servicing ESD file is generally smaller than the OS upgrade package and WIM image file. You can also use Windows features such as Dynamic Update and Delivery Optimization. This type of task sequence extends support to Windows 10 on ARM64 devices.
For more information, see the following articles:
- For scenario guidance and planning, see Upgrade Windows to the latest version.
- For prerequisites, see Create a task sequence to upgrade an OS.
- For the new setting on the task sequence step, see About task sequence steps: Upgrade OS.
This release also includes:
Microsoft Endpoint Manager tenant attach
Display all applications for a device in Microsoft Endpoint Manager admin center – The Applications view for a tenant attached device in Microsoft Endpoint Manager admin center now displays more applications from Configuration Manager. Displayed applications include applications that are:
- Deployed to the device
- Deployed to a user that’s logged in to the device, primary user of the device, and applications previously installed for the user
The option, An administrator must approve a request for this application on the device, is no longer required to be set on the device available deployment for applications to be listed in the admin center. This improvement allows you to review when application installations are expected to occur on a device.
Tenant attach: Antivirus policy exclusions merge – When a tenant attached device is targeted with two or more antivirus policies, the settings for antivirus exclusions will merge before being applied to the client. This change results in the client receiving the exclusions defined in each policy, allowing for more granular control of antivirus exclusions.
Site infrastructure
Allow exclusion of organizational units (OU) from Active Directory User Discovery – You can now exclude OUs from Active Directory User Discovery.
New prerequisite checks
When you install or update to version 2103, there are several new warning prerequisite checks.
- Enable the site for HTTPS-only or enhanced HTTP – If your site is configured to allow HTTP communication without enhanced HTTP, you’ll see this warning. To improve the security of client communications, in the future Configuration Manager will require HTTPS communication or enhanced HTTP. Plan to configure the site for HTTPS only or to Use Configuration Manager-generated certificates for HTTP site systems.
- Deprecated Azure Monitor connector – We continue to see broad adoption of native Azure Monitor log query groups as customers shift more of their workloads to the cloud. Because of this reason, starting in November 2020, the Configuration Manager feature to synchronize collections to Azure Monitor was deprecated.
When you update to this release, this check warns about the presence of the Log Analytics connector for Azure Monitor. (This feature is called the OMS Connector in the Azure Services wizard.) This connector is deprecated, and will be removed from the product in a future release. At that time, this check will be an error that blocks upgrade.
- SQL Server Express version – If you have a secondary site that uses SQL Server Express edition, this check warns if the version is earlier than SQL Server 2016 with service pack 2 (13.0.5026.0). Microsoft recommends that you keep SQL Server Express up to date.
Collections
Improvements to the collection relationships viewer – Starting in version 2010, you can view dependency relationships between collections in a graphical format. The relationships for a collection were presented as two hierarchical trees, one for dependents and the other for dependencies. In this release, you can view both parent and child relationships together in a single graph. This change allows you to quickly see an overview of all the relationships of a collection at once and then drill down into specific related collections. It also includes other filtering and navigation improvements.
Improvements to query preview – You now have more options when using the collection query preview. The following improvements have been made to previewing collection queries:
- Limit the number of rows returned.
- Omit duplicate rows from the result set.
- Review statistics for the query preview such as number of rows returned and elapsed time.
Improvements to collection evaluation view – The following improvements were made to the collection evaluation view:
- The central administration site (CAS) now displays a summary of collection evaluation status for all the primary sites in the hierarchy.
- Drill through from collection evaluation status queue to a collection.
- Copy text to the clipboard from the collection evaluation page.
- Configure the refresh interval for the collection evaluation statistics page.
Software Center
Change foreground color for Software Center branding – Software Center already provides various controls for you to customize the branding to support your organization’s brand. For some customers, their brand color doesn’t work well with the default white font color for a selected item. To better support these customers and improve accessibility, you can now configure a custom color for the foreground font.
Improved user experience and security with Software Center custom tabs – Since current branch version 1906, you can add up to five custom tabs to Software Center. These custom tabs let you give your users easy access to common web apps and other sites. Previously, to display websites Software Center used the Windows built-in Internet Explorer browser control.
Starting in this release, Software Center can now use the Microsoft Edge WebView2 browser control. The WebView2 browser control provides improved security and user experience. For example, more websites should work with these custom tabs without displaying script errors or security warnings.
Application management
Disable application deployments – You can now disable application deployments. Other objects already have similar behaviors:
- Software update deployments: Disable the deployment
- Phased deployments: Suspend the phase
- Package: Disable the program
- Task sequence: Disable the task sequence
- Configuration baseline: Disable the baseline
For device-based deployments, when you disable the deployment or object, use the client notification action to Download Computer Policy. This action immediately tells the client to update its policy from the site. If the deployment hasn’t already started, the client receives the updated policy that the object is now disabled.
Operating system deployment
Windows 10 Servicing dashboard changes – We’ve simplified the Windows 10 Servicing dashboard to make it more relevant. The new Quality Update Versions chart displays the top five revisions of Windows 10 across your devices. The Latest Feature Update chart shows the number of devices that installed the latest feature update. The Windows 10 Usage chart, showing the distribution of Windows 10 major releases, was renamed to Feature Update Versions. Servicing plan and Windows 10 ring information were removed from the dashboard.
Task sequence error shows more check readiness details – The task sequence progress can now display more information about readiness checks. If a task sequence fails because the client doesn’t meet the requirements configured in the Check readiness task sequence step, the user can now see more details about the failed prerequisites.
Encryption algorithm to capture and restore user state – The task sequence steps to Capture User State and Restore User State always encrypt the USMT state store. Previously, Configuration Manager configured USMT to use the 3DES algorithm. Starting in this release, both steps now use the highest supported encryption algorithm, AES 256.
Protection
Improvements to BitLocker management – In current branch version 2010, you can manage BitLocker policies and escrow recovery keys over a cloud management gateway (CMG). This support included a couple of limitations.
Starting in this release, BitLocker management policies over a CMG support the following capabilities:
- Recovery keys for removable drives
- TPM password hash, otherwise known as TPM owner authorization
This release also provides support for the following features:
- Enhanced HTTP
- The recovery service on management points that use a database replica.
Software updates
Approved scripts for orchestration groups – You can now select from scripts that have already been approved when configuring pre and post-scripts for an orchestration group. When in the Create Orchestration Group Wizard, you’ll see a new page called Script Picker. Select your pre and post scripts from your list of scripts that are already approved. You can still add scripts manually on the pre and post-script pages. Additionally, you can also edit scripts that you pre-populated from the Script Picker.
Change default maximum run time for software updates – Configuration Manager sets the following maximum run time for these categories of software updates:
- Feature updates for Windows: 120 minutes
- Non-feature updates for Windows: 60 minutes
- Updates for Microsoft 365 Apps (Office 365 updates): 60 minutes
All other software updates outside these categories, such as third-party updates, were given a maximum run time of 10 minutes. Starting in this release, the default maximum run time for these updates is 60 minutes rather than 10 minutes. The new maximum run time will only apply to new updates that are synchronized from Microsoft Update. It doesn’t change the run time on existing updates.
TLS certificate pinning for devices scanning HTTPS-configured WSUS servers – Further increase the security of HTTPS scans against WSUS by enforcing certificate pinning. To enable this behavior:
- Ensure your software update points are configured to use TLS/SSL
- Add the certificates for your WSUS servers to the new WindowsServerUpdateServices certificate store on your clients
- Verify the Enforce TLS certificate pinning for Windows Update client for detecting updates software updates client setting is set to Yes (default).
Community hub
Download Power BI report templates from Community hub – Community hub now supports contributing and downloading Power BI report template files. This integration allows administrators to easily share and reuse Power BI reports. Contributing and downloading Power BI report template is also available for current branch versions of Configuration Manager.
Access the top queries shared in the Community hub from CMPivot – You can now access the top CMPivot queries shared in the Community hub from on-premises CMPivot. By leveraging pre-created CMPivot queries shared by the broader community, CMPivot users gain access to a wider variety of queries. On-premises CMPivot accesses the Community hub and returns a list of the top downloaded CMPivot queries. Users can review the top queries, customize them, and then run on-demand. This improvement gives a wider selection of queries for immediate usage without having to construct them and also allows information sharing on how to build queries for future reference.
Configuration Manager console
Centralized management of console extensions
Configuration Manager now supports a new style of console extensions that have the following benefits:
- Centralized management of console extensions for the site from the console instead of manually placing binaries on individual consoles.
- A clear separation of console extensions from different extension providers.
- The ability for admins to have more control over which console extensions are loaded and used in the environment, to keep them more secure.
- A hierarchy setting that allows for only using the new style of console extension.
The old style of console extensions may start being phased out in favor of the new style, which is more secure and centrally managed.
Add a report as a favorite – Configuration Manager ships with several hundred reports by default, and you may have added more to that list. Instead of continually searching for reports you commonly use, you can now make a report a favorite. This action allows you to quickly access it from the new Favorites node.
Improvements to the product lifecycle dashboard – This release includes improvements to the product lifecycle dashboard to make it more actionable for you.
- Customize the timeframe on the charts for your preference.
- Search, sort, and filter the data.
- View a list of devices with products that are near or at end of support, and you need to update.
Support Center
Improvements to Support Center – Support Center is now split into the following tools:
- Support Center Client Data Collector: Collects data from a device to view in the Support Center Viewer. This separate tool encompasses the existing Support Center action to Collect selected data.
- Support Center Client Tools: The other Support Center troubleshooting functionality, except for Collect selected data.
Support Center Viewer, Support Center OneTrace and Support Center Log File Viewer are still a part of Support Center.
OneTrace support for jump lists – Support Center OneTrace now supports jump lists for recently opened files. Jump lists let you quickly go to previously opened files, so you can work faster.
There are now three methods to open recent files in OneTrace:
- Windows taskbar jump list
- Windows Start menu recently opened list
- In OneTrace from File menu or Recently opened tab.
Other
For more information on changes to the Windows PowerShell cmdlets for Configuration Manager, see version 2103 release notes.
For more details and to view the full list of new features in this update, check out our What’s new in version 2103 of Microsoft Endpoint Configuration Manager documentation.
Note: As the update is rolled out globally in the coming weeks, it will be automatically downloaded, and you’ll be notified when it’s ready to install from the “Updates and Servicing” node in your Configuration Manager console. If you can’t wait to try these new features, see these instructions on how to use the PowerShell script to ensure that you are in the first wave of customers getting the update. By running this script, you’ll see the update available in your console right away.
For assistance with the upgrade process, please post your questions in the Site and Client Deployment forum. Send us your Configuration Manager feedback through Send-a-Smile in the Configuration Manager console. Continue to share and vote on ideas about new features in Configuration Manager.
Thank you,
The Configuration Manager team
Additional resources:
- What’s New in Configuration Manager
- Documentation for Configuration Manager
- Microsoft Endpoint Manager announcement
- Microsoft Endpoint Manager vision statement
- Evaluate Configuration Manager in a lab
- Upgrade to Configuration Manager
- Configuration Manager Forums
- Configuration Manager Support
- Report an issue
- Provide suggestions

 for Gallery to make it convenient and meet growing demand for organizing, sorting, managing all workbook types – templates and your workbooks.


Recent Comments