by Contributed | Mar 22, 2021 | Technology
This article is contributed. See the original author and article here.
If you’ve ever wondered how news anchors or public speakers can stay on point and present their topics in a crisp and concise way, within a limited timeframe, chances are they are using a teleprompter.
In today’s work-from-home tip, Jeremy Chapman, from the Microsoft 365 team, will show you how you can use Microsoft Word to easily convert any document into something that works perfectly as a teleprompter. Then we’ll show you how to use Microsoft Teams as a way to project this teleprompter screen to a remote presenter or a second device like a phone screen.
Jeremy’s camera and prompter setup:
- Sony A7 II camera with F1.8 55mm lens
- Elgato Cam Link 4k USB 3.0 HDMI capture device
- Padcaster Parrot Teleprompter Kit
- Microsoft Surface Dial to scroll prompter text
- Feelworld FW568 5.5 inch 1080p HDMI Camera Field Monitor
- Shure MV7 microphone
- Blue Compass microphone boom arm
QUICK LINKS:
00:51 — Converting a Word document for teleprompter use
03:00 — Positioning the prompter screen for eye contact to the camera
03:54 — Using a Microsoft Teams meeting on a phone to send the prompter screen
04:52 — Using the Microsoft Teams web app to join a second meeting to view the prompter for in-person or remote co-presenters
05:41 — Closing remarks
Link References:
Use Microsoft Teams on the web to join a second meeting for sharing the teleprompter feed at https://teams.microsoft.com
Find more shows in our work from home series at https://aka.ms/WFHmechanics
Unfamiliar with Microsoft Mechanics?
We are Microsoft’s official video series for IT. You can watch and share valuable content and demos of current and upcoming tech from the people who build it at Microsoft.
Video Transcript:
If you’ve ever wondered how news anchors or public speakers can stay on point and present their topics in a crisp and concise way all within a limited timeframe, the chances are they’re using a teleprompter. Now, if you’re not used to using a teleprompter, with a little practice reading into your camera a teleprompter can help get your presentations or speeches to the next level.
So in today’s work from home tip, I’ll show you how you can use Microsoft Word to easily convert any document into something that works perfectly as a teleprompter and I’ll show you how you can use Microsoft Teams as a way to project this teleprompter screen to a remote presenter or a second device, like a phone screen, that can be placed directly under your camera so that your eyes stay close to the camera lens.
So in my case, I’m using Microsoft Word and what I’ll demonstrate today works more or less the same way whether you’re on a PC or Mac. Here I have a script that I’m presenting from right now and the first thing that you’ll want to do in the View tab is change the view from Print Layout to Web Layout. Now, this ensures that you can use the full width of the page and not need to scroll past page breaks, which can often appear mid-sentence.
Now, the next thing that you’ll want to do is disable the ruler at the top of the screen by unchecking this box. You can leave the page background white like mine is now, which is helpful if you’re using the screen to help with your camera’s lighting, but depending on your screen brightness or setup, the white background can also make your face too bright, or if you’re using an actual teleprompter device on your camera that works like a two-way mirror effectively, the white background sometimes can cause the image to look a little foggy or milky and to counter these effects you can easily change the background to black.
Now, to change the background color, first you’ll want to select all of your text by using Control + A. Then go to the Home tab and make sure that you font color is set to Automatic. Now, this ensures that your font color will flip to white once we change the page color to black. And to do that, just search in Word in the search box for page color, then set it to black. Now our document is looking much more like a teleprompter but the font is still pretty small and if your camera’s far away or you’re going to project this onto a small screen then you’ll want to make the font larger and you can do that easily by using the zoom control in the bottom-right corner to get a comfortable font size.
Now, the last thing, and a very key step that you’ll want to do in Word, is to switch on focus mode. Now, this will full-screen Word and make it so it looks like a teleprompter and now it’s ready to go. But let’s say we want to use this for a two-person presentation and want to get the attention of each speaker or punch up various parts of the script. Now, for that, you can use highlighting in Word to help grab attention. So, for example, if I’m presenting with Megan, I can mark her name, change the highlight, and my name, also change the highlight, and with those different colors I can grab attention of the different presenters. Or I can bold and underline the text if I really want to land a point.
Okay, so now I have my prompter complete, but another key aspect of doing this well is getting the screen with Word to be as close as possible to your camera. And if you’re just using the camera on top of your laptop or your monitor, you’ll be looking pretty far down to read your text. So in my case, I actually have a device called a Padcaster that’s attached to my Sony DSLR camera lens and under it there’s a 5 1/2-inch field monitor used as a second display over HDMI attached to my PC with the display flipped so that the text reads the correct way and the text is directly in front of the lens. So this is how you would use Word if you were in a studio environment, maybe with a second person driving the teleprompter under the display on a larger teleprompter. Now, chances are you don’t have that setup at home, but if you want something like that, I’ve put all the links in the description below to everything that I’m using to record this particular video.
Now, something that you probably do have is a mobile phone that can run Microsoft Teams or Skype and you can use screensharing to project your script inward to both your phone if you’re presenting solo as well as to a remote co-presenter using their phone or monitor to display your script in real time to them even as you scroll. Now, the phone screen has two benefits. It’s not too wide or too tall in its landscape orientation, so your eyes won’t be visibly moving too much left to right, and you can mount it either just below or behind your camera so that your eyes stay with the audience. Now, to mount your phone, the best option is really to use a mini tripod with a phone holder or you can tape it just below your camera to your monitor and that also works in a pinch.
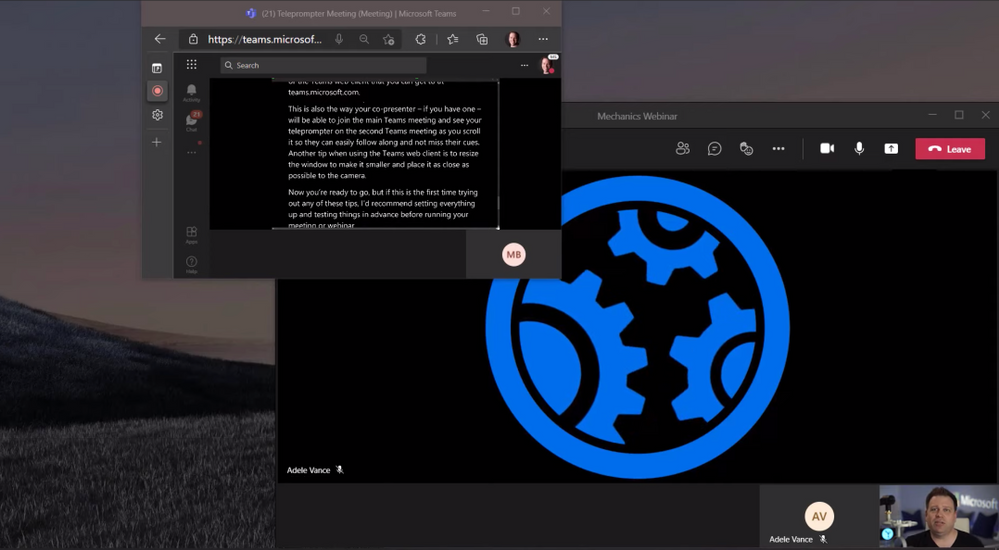
Now, let’s say this is a larger presentation, though, that’s running live and you’re presenting over Microsoft Teams and you don’t want people who are not presenting to see your teleprompter screen or to know that you’re reading from it. But a nice trick that you can use here is to join the main meeting or webinar using the Teams app that’s running on your PC or Mac and use a second meeting from the teleprompter using Teams on the mobile app on your phone or the Teams web client that you can get to at teams.microsoft.com. Now, this way, also your co-presenter if you have one will be able to join the main Teams meeting and also see your teleprompter on a second Teams meeting as you scroll so they can easily follow along and not miss their cues.
Now, another tip when using the Teams web client is to resize the window and make it smaller and place it as close as possible to the camera. So now you’re ready to go. But if this is the first time trying any of these tips out, I’d recommend setting everything up and testing things in advance before running your meeting or webinar. So those are just two tips that you can use when every word matters, whether you’re presenting on your own or to record a video like this one or on a larger Teams call or webinar.
To find more tips like this on Microsoft Mechanics, check out aka.ms/WFHMechanics. Subscribe to our channel if you haven’t already, and thanks for watching.
by Contributed | Mar 22, 2021 | Technology
This article is contributed. See the original author and article here.
By Tejas Shinde
JMeter is quite a versatile tool when it comes to Load Testing. Developers can use it to simulate various usage patterns; it also has various plugins that enable it to manipulate these usage patterns.
When we want to simulate the application load by using APIs, we think about targeted throughput. In such scenarios, typically, we want to load the system with specific throughput (requests per second) for a specified duration.
In this post, we will take a look at some JMeter plugins that we can use for controlling throughput and ways to use these plugins more efficiently.
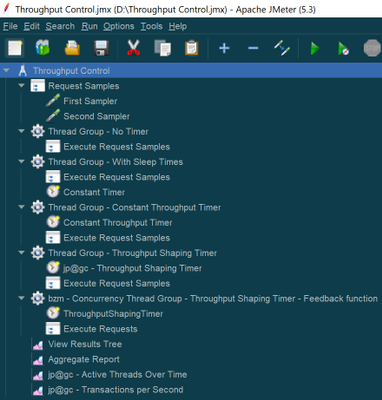
We will use the following JMeter plugins for this example:
- Dummy sampler – To simulate request samplers
- 3 Basic Graphs – To monitor the active threads and transaction rate (throughput)
- Custom Thread Groups – For Concurrency Thread Group
In the following example, we will try to simulate the load of ~20 req/sec. There are various ways you can control the rate at which you can generate the requests; the most commonly used ways are either introducing think time in between the requests or using any of the throughput controllers. The JMX solution can be found at the bottom of this article
Every thread group uses the same two samplers that are under the Test Fragment “Request Samples” using the module controllers.
For “First Sampler”, response time is set to “${__Random(3000,5000)}” and for “Second Sampler” it is set to “${__Random(5000,10000)}”
Throughout this test plan, all the thread groups are set to use 500 threads. And will be executed for ~5 minutes. Typically, the total number of threads needed to achieve a throughput can be calculated by using the following formula Throughput * Avg. Response Time / 1000. To be on the safer side, instead of Avg. Response Time, we use Maximum Response Time in the formula. However, for demo purpose, we are going to use 500 as thread count in the below examples
We will discuss the following cases:
- Without any throughput controlling measures
- With sleep time (Using Constant Timer)
- With Constant Throughput Timer
- With Throughput Shaping Timer
- With Concurrency Thread Group with Throughput Shaping Timer
Case 1: Without any throughput controlling measures
In this case, no throughput controlling is introduced. This gives us a rough idea about how much throughput we can achieve with 500 threads without having any throughput control.

Results:
When we run this thread group, the following are the results of the Aggregate Report:

In my case, JMeter was able to generate 81.2 requests/sec. (It may differ in your case based on the various factors)
Throughout the execution, 500 threads were active and sending the requests.
|
Throughput graph looks consistently distributed
|

|

|
As we can see, without using any throughput controlling measures, 81.2 req/sec were generated using 500 threads.
Case 2: With sleep time (Using Constant Timer)
In this case, throughput will be controlled by introducing sleep time in between threads. In this example, a Constant Timer with 15000 milliseconds is used for sleep time. You may need to try it out in a few runs to find the optimum value of sleep time to get the desired throughput.

Results:

Throughout the execution, 500 threads were active and sending the requests.
|
As we used sleep times, request generation happens in bursts where throughput will be balanced as a result of sleep times
|

|

|
Case 3: With Constant Throughput Timer
In this scenario, we will use Constant Throughput Timer. This timer will also work similarly to that of Constant Timer. It will pause the threads based on periodically based on the current value of throughput to match up the target throughput value. In this case, an advantage will be sleep time will be calculated automatically based on the target value.

*Note that the throughput value is in terms of req/min
Results:

Throughout the execution, 500 threads were active and sending the requests.
|
Throughput graph looks very much similar to the graph from the previous case, where we manually paused the threads
|

|

|
Case 4: With Throughput Shaping Timer
In this case, we are using a JMeter plugin – Throughput Shaping timer. This plugin also works similarly to Constant Throughput Timer, which pauses the threads based on the target Throughput. However, a couple of advantages are the request bursts are more consistent in nature, and the samples lie very close to the median value, as can be seen in the throughput graph. Also, this plugin will allow us to simulate various levels of throughput values over a period of time which is not possible in the case of Constant Throughput Timer as it can target only a specific value.

Results:

Throughout the execution, 500 threads were active and sending the requests.
|
With Throughput Shaping Timer, the graph looks more consistent, and the sample’s distribution is close to the median value of the throughput, which has been set as a target
|

|

|
Case 5: With Concurrency Thread Group with Throughput Shaping Timer
So far, in all of the previous cases, we have used 500 threads to generate the throughput of 20 req/sec. Depending upon the total number of requests and response time of those requests, it will be quite a calculation to identify the optimum number of thread count that is needed to generate the target output. In cases where the response time is quite low, we will need much less than 500 threads to generate that throughput. And similarly, in situations where response time is high, we may need more than 500 threads to generate the desired throughput.
To calculate the number of threads that are needed to generate the target throughput, we will use another plugin from JMeter in conjunction with Throughput Shaping Timer. Also, to generate the minimum amount of threads, we will use the Schedule Feedback function from JMeter, which will define the number of threads that should be running concurrently to generate the target throughput.
Following is the Concurrency Thread Group, which is from the “Custom Thread Groups” plugin. Target concurrency is defined using the feedback function that will work based on the feedback from Throughput Shaping Timer to provide the latest count of threads that are needed to achieve the target of the Throughput Shaping Timer.

Feedback function parameters can be explained as follows:
- ThroughputShapingTimer – Name of the element. In this case, the name of the Throughput Shaping Timer
- 5 – Number of threads at the start
- 500 – Maximum allowed threads
- 10 – Number of spare threads in the pool

Results:

So as you can see, by using less than 180 threads, we were able to generate a throughput of 19.1 (It’s less than 20 as a result of throughput ramp up and ramp down steps defined in Throughput Shaping Controller).
Maximum threads used during this run were less than 180.
|
Maximum threads used during this run were less than 180.
|

|

|
Caution:
- While using the concurrency thread group with Throughput Shaping Timer, makes sure that you specify the sufficient number of threads as if the number is not high, the plugin will show a warning message in the logs stating that there are not enough threads available in the pool to generate the target throughput
- Similarly, make sure that the specified thread count is not too high as it may result in a spike in throughput at the end of the test (as seen in the above throughput graph) while JMeter is shutting all the threads
Conclusion
Hopefully, this post has helped you learn how to control the throughput in your Load Test project by using the mentioned plugins. Please find references to the plugins and manual from JMeter below. You can also find an attachment containing the scenario that was used to write this article (JMX file).
Please leave us any questions or comments too. Thanks for reading!
References:
Attachment:
by Contributed | Mar 22, 2021 | Technology
This article is contributed. See the original author and article here.
Every year, for a number of years, Excel fans around the world test and develop their financial modeling skills through rounds of innovative challenges starting in the second half of the calendar year. The final round, usually towards the end of the year, tests the participants’ speed, ng theory, data and risk competence, and more—all on Excel. Read more here and here.
This year, Excel fans can get started earlier in the Financial Modeling World Cup (FMWC). FMWC started in January 2021, with monthly stages throughout the year. Each stage takes 2 hours to complete, over the span of 2 days. Read more about rules and schedules on the FMWC website.
“Financial Modeling World Cup brings together Excel users from all over the world, providing everyone an exceptional opportunity to promote their personal brand,” Andrew Grigolyunovich, CFA, FMWC Chairman
Stage 3 of FMWC is coming up on March 26-29. Register today to get started.
by Contributed | Mar 22, 2021 | Technology
This article is contributed. See the original author and article here.
You are reading the March issue of the Infrastructure + Security: Noteworthy News series! As a reminder, the Noteworthy News series covers various areas, to include interesting news, announcements, links, tips and tricks from Windows, Azure, and Security worlds on a monthly basis.
New region added to Azure HDInsight
Azure HDinsight is now generally available in UAE Central
Announcing Az Predictor
The Azure PowerShell modules expose over 4,000 cmdlets and, on average, ten parameters per cmdlet. Experienced PowerShell users will find the right cmdlet and parameter to achieve their goal but this can be more complicated for casual users.
Announcing Azure PowerShell 5.0
A major version is an opportunity to introduce several improvements that may not be compatible with the scripts that you have developed with a previous version. As always, we recommend that you read the migration guide to measure the impact of this new version on your environment. Az 5.0 introduces the following fundamental changes:
- Updated authentication
- A security update for Az.KeyVault
- Improved support for ACR (Azure Container Registry) and AKS (Azure Kubernetes Service)
- New default behaviors for Az.KeyVault and Az.Functions
Leveling Up Your Azure SQL Database Deployments | Data Exposed: MVP Edition
The Basic, Standard, and Premium service tiers fulfill a lot of customers’ needs. For some customers, though, the General Purpose, Business Critical, and Hyperscale service tiers offer additional performance and ability that is required for certain workloads. Even if you don’t require those abilities, the technology and infrastructure behind these are worth learning about! In this episode with Matt Gordon, we’ll discuss those service tiers as well as discussing the differences between Provisioned and Serverless deployments on the General Purpose tier. Come learn how to ramp up your Azure SQL Database experience!
AD Explorer v1.50, Disk Usage v1.62, VMMap v3.31 and Sysmon v12.02
- AD Explorer v1.50 – This release of AdExplorer, an Active Directory (AD) viewer and editor, adds support for exporting data from the “Compare” dialog and is now available for x64 and ARM64.
- Disk Usage v1.62 – This release of Disk Usage (DU), a tool for viewing disk usage information, now also accounts for the MFT (Master File Table), removes the MAX_PATH limitation and is now available for ARM64.
- VMMap v3.31 -This update to VMMap, a utility that reports the virtual memory layout of a process, fixes a Thread Environment Block bug on Windows 10 systems.
- Sysmon v12.02 – This update to Sysmon fixes several configuration parsing bugs.
- ARM64 ports – New ARM64 releases for AdExplorer v1.50 and DU v1.62. Download all ARM64 tools in a single download with the Sysinternals Suite for ARM64.
Announcing Windows Admin Center in the Azure Portal
This new capability allows you to manage the Windows Server OS running on Azure IaaS VMs seamlessly and at a more granular level. This in-built functionality provides the opportunity for greater oversight of your workloads right from the Azure Portal.
PowerShell support for Server Migration with Azure Migrate is now generally available
Automate migration of VMware virtual machines to Azure using Azure Migrate and Azure PowerShell.
Microsoft Endpoint Manager announces two new partner-led workshops
Microsoft is excited to announce the launch of two new partner-led workshops: Endpoint Management Workshop and Secure Work from Anywhere Workshop. Both workshops introduce customers to the core components of Microsoft 365 as the critical first step on the path to digital transformation.
Year two: Extended Security Updates for Windows 7 and Windows Server 2008
The Extended Security Update (ESU) program is a last resort for customers who need to run certain legacy Microsoft products past the end of support. Support for the following versions of Windows and Windows Server ended on January 14, 2020:
- Windows 7 SP1
- Windows 7 Professional for Embedded Systems
- Windows Server 2008 R2 SP1 and Windows Server 2008 SP2
- Windows Server 2008 R2 SP1 for Embedded Systems and Windows Server 2008 SP2 for Embedded Systems.
What’s new for IT pros in Windows 10, version 20H2
Windows 10, version 20H2 is now available through Windows Server Update Services (WSUS) and Windows Update for Business, and can be downloaded today from Visual Studio Subscriptions, the Software Download Center (via Update Assistant or the Media Creation Tool), and the Volume Licensing Service Center[1]. Today also marks the start of the 30-month servicing timeline for this Semi-Annual Channel release.
Simplifying on-premises deployment of servicing stack updates
To keep devices up to date, IT administrators who manage devices using on-premises methods must select and deploy the correct servicing stack update (SSU) with the latest cumulative update (LCU). In some cases, a specific version of the SSU must already be installed in order to install the latest LCU. If the device in question does not have the required SSU already installed, the LCU will fail to install.
What’s new in Azure Security Center- Oct 2020
Security Center is in active development and receives improvements on an ongoing basis. To stay up to date with the most recent developments, this page provides you with information about new features, bug fixes, and deprecated functionality.
Container Image Scanning Notification Playbook
Azure Container Registry (ACR) is a managed, private Docker registry service that stores and manages your container images for Azure deployments in a central registry. Azure Defender for container registries brings deeper visibility into the vulnerabilities effecting the container image. It scans every image for vulnerabilities and provides security recommendations using an integrated scanner powered by Qualys, the industry-leading vulnerability scanning.
Updates and Support Lifecycle |
Release information for updates to Microsoft 365 Apps
New Release notes for Microsoft 365 Apps for Enterprise (Previously Office 365 Pro Plus).
Azure Time Series Insights Gen2 Preview APIs Deprecated
The Azure Time Series Insights Gen2 public preview APIs have been deprecated. Read about the process for migrating onto the new generally available API version for Azure Time Series Insights Gen2.
Power BI dynamic M query parameter support
Power BI dynamic M query parameter allows users to explicitly inject filters at the designated place in the query and improve query performance by a few factors, especially when the report is built on top of a very big dataset, or using complex query logic.
Check out Microsoft Services public blog for new Proactive Services as well as new features and capabilities of the Services Hub, On-demand Assessments, and On-demand Learning platforms.
Thanks for reading!
Henry Phiri
Justin Barbalace
by Contributed | Mar 22, 2021 | Technology
This article is contributed. See the original author and article here.
If you are trying to setup Always On availability group between SQL instances deployed as SQL containers on Kubernetes platform, then I hope that this blog provides you the required reference to successfully setup the environment.
Target:
By end of this blog, we should have three SQL Server instances deployed on the Kubernetes aka k8s cluster. With Always On availability group configured amongst the three SQL Server instances in Read scale mode. We will also have the READ_WRITE_ROUTING_URL setup to provide read/write connection redirection.
References:
Refer Use read-scale with availability groups – SQL Server Always On | Microsoft Docs to read more about read scale mode.
To prepare your machine to run helm charts please refer this blog where I talk how you can setup your environment including AKS and preparing your windows client machine with helm and other tools to deploy SQL Server instances on AKS (Azure Kubernetes Service).
Environment layout:
1) To set this environment up, in my case I am using Azure Kubernetes Service as my Kubernetes platform.
2) I will deploy three SQL Server container instances using helm chart in a Statefulset mode you can also deploy this even using deployment mode.
3) I will use T-SQL scripts to setup and configure the always on availability group.
Let’s get the engine started:
Step 1: Using helm deploy three instances of SQL Server on AKS with Always on enabled and create external services of type load balancer to access the deployed SQL Servers.
Download the helm chart and all its files to your windows client, switch to the directory where you have downloaded and after you have done modification to the downloaded helm chart to ensure it is as per your requirement and customization, deploy SQL Servers using the command as shown below, you can change the deployment name (“mssql”) to anything that you’d like.
helm install mssql. --set ACCEPT_EULA.value=Y --set MSSQL_PID.value=Developer
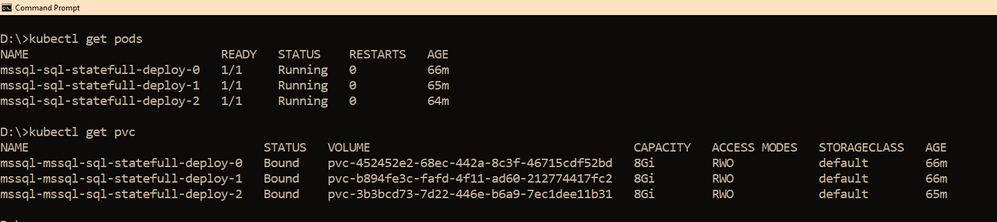
Within few minutes, you should see the pods coming up, the number of pods that would be started depends on the “replicas” value you set in the values.yaml file, if you use it as is, then you should have three pods starting up, as the replicas value is set to three. So you have three SQL Server instances using its own pvc’s up and running as shown below
We also need a way to access these SQL Servers outside the kubernetes cluster, and since I am using AKS as my kubernetes cluster, to access the SQL Server instances, we have created three services one each for the SQL Server pod. The yaml file for the services is also shared with the helm chart under the folder “external services” and the yaml file name is : “ex_service.yaml”. If you are using the sample helm chart, you can create the services using the command shown below:
kubectl apply -f "D:helm-chartssql-statefull-deployexternal servicesex_service.yaml"
Apart from the three external services, we will also need the pods to be able to talk to each other on port 5022 (default port used by AG for endpoints on all the replicas) so we create one clusterip service for each pod, the yaml file for this is also available in the sample helm chart under the folder “external services” and the file name is “ag_endpoint.yaml”. If you have not made any changes then you can create the service using the command:
kubectl apply -f "D:helm-chartssql-statefull-deployexternal servicesag_endpoint.yaml"
If all the above steps are followed you should have the following resources in the kubernetes cluster: 
Note: On our cluster, we already have a secret created to store sa password using the command below, the same sa password is being used by all the three SQL Server instances. It is always recommended to change the sa password after the SQL container deployment so the same sa password is not used for all three instances.
kubectl create secret generic mssql --from-literal=SA_PASSWORD="MyC0m9l&xP@ssw0rd"
Step 2: Create Certificates on primary and secondary replicas followed by creation of endpoints on all replicas.
Now it’s time for us to create the certificate and endpoints on all the replicas. Please use the External IP address to connect to SQL Server primary instance and run the below T-SQL command to create the certificate and endpoint.
--In the context of master database, please create a master key
use master
go
CREATE MASTER KEY ENCRYPTION BY PASSWORD = '<'mycomplexpassword'>';

--under the master context, create a certificate that will be used by endpoint for
--authentication. We then backup the created certificate
-- to copy the certificate to all the other replicas

CREATE CERTIFICATE dbm_certificate WITH SUBJECT = 'dbm';

BACKUP CERTIFICATE dbm_certificate TO FILE = '/var/opt/mssql/data/dbm_certificate.cer'
WITH PRIVATE KEY ( FILE = '/var/opt/mssql/data/dbm_certificate.pvk',ENCRYPTION BY PASSWORD = '<'mycomplexpassword'>');

--Now create the endpoint and authenticate using the certificate we created above.
CREATE ENDPOINT [Hadr_endpoint]
AS TCP (LISTENER_PORT = 5022)
FOR DATABASE_MIRRORING
(
 ROLE = ALL,
 AUTHENTICATION = CERTIFICATE dbm_certificate,
 ENCRYPTION = REQUIRED ALGORITHM AES
);
ALTER ENDPOINT [Hadr_endpoint] STATE = STARTED;
On the primary SQL Server instance pod, we should have the dbm_certificate.pvk and dbm_certificate.cer files at the location : /var/opt/mssql/data. As shown below
We need to copy these files to the other pods, you can use the kubectl cp commands to copy from the primary pod to your local client and then from the local client to the secondary pods. Sample commands are shown below
--Please ensure on the local machine you create the certificates folder and then run the --below command to copy the files from primary pod to the local machine
kubectl cp mssql-sql-statefull-deploy-0:/var/opt/mssql/data/dbm_certificate.pvk "certificatepvk"
kubectl cp mssql-sql-statefull-deploy-0:/var/opt/mssql/data/dbm_certificate.cer "certificatecer"
--Now copy the files from the local machine to the secondary pods
kubectl cp "certificatecerts" mssql-sql-statefull-deploy-1:/var/opt/mssql/data/dbm_certificate.cer
kubectl cp "certificatepvk" mssql-sql-statefull-deploy-1:/var/opt/mssql/data/dbm_certificate.pvk
kubectl cp "certificatecerts" mssql-sql-statefull-deploy-2:/var/opt/mssql/data/dbm_certificate.cer
kubectl cp "certificatepvk" mssql-sql-statefull-deploy-2:/var/opt/mssql/data/dbm_certificate.pvk
Post this the files should be available on every pod as shown below
Please create the certificates and endpoints on the secondary replica pods by connecting to the secondary replicas and running the below T-SQL commands:
--Run the below command on secondary 1&2 : mssql-sql-statefull-deploy-1 & mssql-sqlstatefull-deploy-2
--once the cert and pvk files are copied create the cert here on secondary and alsocreate the endpoint

CREATE MASTER KEY ENCRYPTION BY PASSWORD ='<'mycomplexpassoword'>';

CREATE CERTIFICATE dbm_certificate FROM FILE =
'/var/opt/mssql/data/dbm_certificate.cer'
WITH PRIVATE KEY ( FILE = '/var/opt/mssql/data/dbm_certificate.pvk',
DECRYPTION BY PASSWORD = '<'mysamecomplexpassword'>' );

CREATE ENDPOINT [Hadr_endpoint]
AS TCP (LISTENER_PORT = 5022)
FOR DATABASE_MIRRORING (
	    ROLE = ALL,
	    AUTHENTICATION = CERTIFICATE dbm_certificate,
		ENCRYPTION = REQUIRED ALGORITHM AES
		);
ALTER ENDPOINT [Hadr_endpoint] STATE = STARTED;
Step 3: Create the AG on the primary replica and then join the secondary replicas using T-SQL
On the primary replica run the below command to create the AG which has Read_only_routing_list configured and also has Read_write_routing_url configured to redirect connection to primary irrespective of the instance that you connect provided you pass the database name to which you want to connect.
--run the below t-sql on the primary SQL server pod
CREATE AVAILABILITY GROUP MyAg
     WITH ( CLUSTER_TYPE =  NONE )
   FOR
     DATABASE  test
   REPLICA ON
      N'mssql-sql-statefull-deploy-0' WITH
         (
         ENDPOINT_URL = 'TCP://mssql-mirror-0:5022',
         AVAILABILITY_MODE = ASYNCHRONOUS_COMMIT,
         FAILOVER_MODE = MANUAL,
         SEEDING_MODE = AUTOMATIC,
         SECONDARY_ROLE (ALLOW_CONNECTIONS = ALL, READ_ONLY_ROUTING_URL = 'TCP://104.211.231.206:1433' ),
         PRIMARY_ROLE (ALLOW_CONNECTIONS = READ_WRITE, READ_ONLY_ROUTING_LIST = ('mssql-sql-statefull-deploy-1','mssql-sql-statefull-deploy-2'), READ_WRITE_ROUTING_URL = 'TCP://104.211.231.206:1433' ),
         SESSION_TIMEOUT = 10
         ),
         N'mssql-sql-statefull-deploy-1' WITH
         (
         ENDPOINT_URL = 'TCP://mssql-mirror-1:5022',
         AVAILABILITY_MODE = ASYNCHRONOUS_COMMIT,
         FAILOVER_MODE = MANUAL,
		 SEEDING_MODE = AUTOMATIC,
         SECONDARY_ROLE (ALLOW_CONNECTIONS = ALL, READ_ONLY_ROUTING_URL = 'TCP://104.211.203.78:1433' ),
         PRIMARY_ROLE (ALLOW_CONNECTIONS = READ_WRITE, READ_ONLY_ROUTING_LIST = ('mssql-sql-statefull-deploy-0','mssql-sql-statefull-deploy-2'), READ_WRITE_ROUTING_URL = 'TCP://104.211.203.78:1433' ) ,
         SESSION_TIMEOUT = 10
         ),
         N'mssql-sql-statefull-deploy-2' WITH
         (
         ENDPOINT_URL = 'TCP://mssql-mirror-2:5022',
         AVAILABILITY_MODE = ASYNCHRONOUS_COMMIT,
         FAILOVER_MODE = MANUAL,
		 SEEDING_MODE = AUTOMATIC,
         SECONDARY_ROLE (ALLOW_CONNECTIONS = ALL, READ_ONLY_ROUTING_URL = 'TCP://104.211.203.159:1433' ),
         PRIMARY_ROLE (ALLOW_CONNECTIONS = READ_WRITE, READ_ONLY_ROUTING_LIST = ('mssql-sql-statefull-deploy-0','mssql-sql-statefull-deploy-1'), READ_WRITE_ROUTING_URL = 'TCP://104.211.203.159:1433'),
         SESSION_TIMEOUT = 10
         );
GO

ALTER AVAILABILITY GROUP [MyAg] GRANT CREATE ANY DATABASE;
Note: In the above command, please ensure that you pass the service names that you created in step 1 for the enpoint_url and you pass the external IP address of the SQL Server pods when configuring the read_write_routing_url option. Any error here can result in the secondary’s not able to join the AG.
Now on the secondary replicas please run the T-SQL command to join the AG, sample shown below
--On both the secondaries run the below T-SQL commands
ALTER AVAILABILITY GROUP [MyAg] JOIN WITH (CLUSTER_TYPE = NONE);
ALTER AVAILABILITY GROUP [MyAg] GRANT CREATE ANY DATABASE;
The AG should not be configured and the dashboard should look as shown below

Step 4: Read_write_routing_url in action
You can now try connecting to any of the secondary replicas and provide the AG database as the database context, you will automatically get routed to the current primary even without the presence of listener.


As you can see we are connecting to 104.211.203.78 which is the external IP address for pod: mssql-sql-statefull-deploy-1 which is secondary server, but the connection got re-routed to the current primary which is : mssql-sql-statefull-deploy-0 @ 104.211.231.206

To try manual failover, please follow the steps documented here.
Hope this helps!

Recent Comments