This article is contributed. See the original author and article here.
By Tejas Shinde
JMeter is quite a versatile tool when it comes to Load Testing. Developers can use it to simulate various usage patterns; it also has various plugins that enable it to manipulate these usage patterns.
When we want to simulate the application load by using APIs, we think about targeted throughput. In such scenarios, typically, we want to load the system with specific throughput (requests per second) for a specified duration.
In this post, we will take a look at some JMeter plugins that we can use for controlling throughput and ways to use these plugins more efficiently.
We will use the following JMeter plugins for this example:
- Dummy sampler – To simulate request samplers
- 3 Basic Graphs – To monitor the active threads and transaction rate (throughput)
- Custom Thread Groups – For Concurrency Thread Group
In the following example, we will try to simulate the load of ~20 req/sec. There are various ways you can control the rate at which you can generate the requests; the most commonly used ways are either introducing think time in between the requests or using any of the throughput controllers. The JMX solution can be found at the bottom of this article
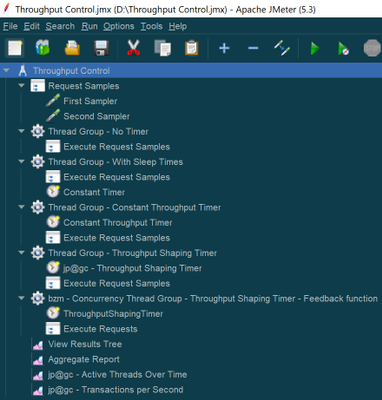
Every thread group uses the same two samplers that are under the Test Fragment “Request Samples” using the module controllers.
For “First Sampler”, response time is set to “${__Random(3000,5000)}” and for “Second Sampler” it is set to “${__Random(5000,10000)}”
Throughout this test plan, all the thread groups are set to use 500 threads. And will be executed for ~5 minutes. Typically, the total number of threads needed to achieve a throughput can be calculated by using the following formula Throughput * Avg. Response Time / 1000. To be on the safer side, instead of Avg. Response Time, we use Maximum Response Time in the formula. However, for demo purpose, we are going to use 500 as thread count in the below examples
We will discuss the following cases:
- Without any throughput controlling measures
- With sleep time (Using Constant Timer)
- With Constant Throughput Timer
- With Throughput Shaping Timer
- With Concurrency Thread Group with Throughput Shaping Timer
Case 1: Without any throughput controlling measures
In this case, no throughput controlling is introduced. This gives us a rough idea about how much throughput we can achieve with 500 threads without having any throughput control.

Results:
When we run this thread group, the following are the results of the Aggregate Report:

In my case, JMeter was able to generate 81.2 requests/sec. (It may differ in your case based on the various factors)
Throughout the execution, 500 threads were active and sending the requests. | Throughput graph looks consistently distributed |


As we can see, without using any throughput controlling measures, 81.2 req/sec were generated using 500 threads.
Case 2: With sleep time (Using Constant Timer)
In this case, throughput will be controlled by introducing sleep time in between threads. In this example, a Constant Timer with 15000 milliseconds is used for sleep time. You may need to try it out in a few runs to find the optimum value of sleep time to get the desired throughput.

Results:

Throughout the execution, 500 threads were active and sending the requests. | As we used sleep times, request generation happens in bursts where throughput will be balanced as a result of sleep times |


Case 3: With Constant Throughput Timer
In this scenario, we will use Constant Throughput Timer. This timer will also work similarly to that of Constant Timer. It will pause the threads based on periodically based on the current value of throughput to match up the target throughput value. In this case, an advantage will be sleep time will be calculated automatically based on the target value.

*Note that the throughput value is in terms of req/min
Results:

Throughout the execution, 500 threads were active and sending the requests. | Throughput graph looks very much similar to the graph from the previous case, where we manually paused the threads |


Case 4: With Throughput Shaping Timer
In this case, we are using a JMeter plugin – Throughput Shaping timer. This plugin also works similarly to Constant Throughput Timer, which pauses the threads based on the target Throughput. However, a couple of advantages are the request bursts are more consistent in nature, and the samples lie very close to the median value, as can be seen in the throughput graph. Also, this plugin will allow us to simulate various levels of throughput values over a period of time which is not possible in the case of Constant Throughput Timer as it can target only a specific value.

Results:

Throughout the execution, 500 threads were active and sending the requests. | With Throughput Shaping Timer, the graph looks more consistent, and the sample’s distribution is close to the median value of the throughput, which has been set as a target |


Case 5: With Concurrency Thread Group with Throughput Shaping Timer
So far, in all of the previous cases, we have used 500 threads to generate the throughput of 20 req/sec. Depending upon the total number of requests and response time of those requests, it will be quite a calculation to identify the optimum number of thread count that is needed to generate the target output. In cases where the response time is quite low, we will need much less than 500 threads to generate that throughput. And similarly, in situations where response time is high, we may need more than 500 threads to generate the desired throughput.
To calculate the number of threads that are needed to generate the target throughput, we will use another plugin from JMeter in conjunction with Throughput Shaping Timer. Also, to generate the minimum amount of threads, we will use the Schedule Feedback function from JMeter, which will define the number of threads that should be running concurrently to generate the target throughput.
Following is the Concurrency Thread Group, which is from the “Custom Thread Groups” plugin. Target concurrency is defined using the feedback function that will work based on the feedback from Throughput Shaping Timer to provide the latest count of threads that are needed to achieve the target of the Throughput Shaping Timer.

Feedback function parameters can be explained as follows:
- ThroughputShapingTimer – Name of the element. In this case, the name of the Throughput Shaping Timer
- 5 – Number of threads at the start
- 500 – Maximum allowed threads
- 10 – Number of spare threads in the pool

Results:

So as you can see, by using less than 180 threads, we were able to generate a throughput of 19.1 (It’s less than 20 as a result of throughput ramp up and ramp down steps defined in Throughput Shaping Controller).
Maximum threads used during this run were less than 180. | Maximum threads used during this run were less than 180. |


Caution:
- While using the concurrency thread group with Throughput Shaping Timer, makes sure that you specify the sufficient number of threads as if the number is not high, the plugin will show a warning message in the logs stating that there are not enough threads available in the pool to generate the target throughput
- Similarly, make sure that the specified thread count is not too high as it may result in a spike in throughput at the end of the test (as seen in the above throughput graph) while JMeter is shutting all the threads
Conclusion
Hopefully, this post has helped you learn how to control the throughput in your Load Test project by using the mentioned plugins. Please find references to the plugins and manual from JMeter below. You can also find an attachment containing the scenario that was used to write this article (JMX file).
Please leave us any questions or comments too. Thanks for reading!
References:
- JMeter plugins wiki – https://jmeter-plugins.org/wiki/Start/
- JMeter user manual – https://jmeter.apache.org/usermanual/
Attachment:
Brought to you by Dr. Ware, Microsoft Office 365 Silver Partner, Charleston SC.

Recent Comments