
by Contributed | Mar 25, 2021 | Technology
This article is contributed. See the original author and article here.
Eliminate passwords by users and their organizations with the latest authentication updates in Azure AD, now generally available. Joy Chik, Microsoft CVP from the identity engineering team, joins host Jeremy Chapman to review friction-free ways of going passwordless with the introduction of the new temporary access pass.
USERS:
- Azure AD now supports FIDO2 security keys as an authentication method for signing into operating systems, applications, and services
- FIDO2 keys — make life easier for frontline workers using shared devices
- Microsoft Authenticator app — never need to remember, or even type a password
- Secure and convenient, on-prem or in any cloud
IT:
- Easier to drive passwordless adoption
- Roll out passwordless authentication methods in Azure AD
- Automate the management of passwordless using PowerShell or our new Microsoft Graph APIs
- New reporting to help track how well your organization is doing
QUICK LINKS:
02:33 — Users: FIDO2 Security Key
03:41 — IT: Passwordless adoption
05:01 — See it in action
07:23 — How to enable experiences in Azure AD Portal
09:30 — Set up Temporary Access Pass
11:11 — How to issue a Temporary Access Pass to a user
12:57 — Wrap Up
Link References:
Register your key at https://aka.ms/mysecurityinfo
If you are a Microsoft 365 admin, use an interactive guide at https://aka.ms/passwordlesswizard
Unfamiliar with Microsoft Mechanics?
We are Microsoft’s official video series for IT. You can watch and share valuable content and demos of current and upcoming tech from the people who build it at Microsoft.
Video Transcript:
– Up next, a special edition of Microsoft Mechanics. We’re joined today by Microsoft CVP Joy Chik from the Identity Engineering team to review the latest authentication updates in Azure AD that are now generally available for eliminating the use of passwords by users and their organizations as well as more friction-free ways of going passwordless with the introduction of the new Temporary Access Pass. So Joy, welcome back into Microsoft Mechanics.
– It is great to be back on the show.
– And thanks so much for joining us today. So I remember the first time that you were on Mechanics back in Ignite 2018; you revealed Microsoft’s leadership role in eliminating the use of passwords as the main vulnerability both for security breaches as well as a primary data target when the perimeter has been breached. So, at that time passwordless methods, such as biometrics and Windows Hello for Business, they’d been around for a while and we launched the preview of the passwordless authentication method using the Microsoft Authenticator app. This experience now even works well on shared devices like Surface Hub. So a lot’s really happened since we started down this path but how far are you then in terms of reaching your goal of eliminating passwords?
– I would say we’re closer than ever to our goal of eliminating passwords. There has been a few stages along this journey. This includes, developing passwordless methods then growing the partner ecosystem for devices and improving the admin experience. But the good news is that as of today, everything Azure AD users need to go passwordless, is now generally available. So we expect to see much broader adoption moving forward. And as I will show you today we are now on the next step of this journey with the new Temporary Access Pass. This makes it even easier to introduce passwordless methods and it is in public preview today.
– This is one of those things where I think passwords are just so pervasive. You’re not going to be able to stop people using them overnight.
– You really can’t. But it’s encouraging that over the past year, with so many of us working remotely, the use of passwordless methods has really reached an inflection point. More than 200 million users are now using passwordless authentication across Azure Active Directory and Microsoft consumer accounts. So, hopefully it won’t be too long before passwords are a thing of the past.
– You mentioned that Azure AD users have now the pieces to implement passwordless and those are all generally available. What does that mean then in terms of both the user and the IT side?
– Well, we know that the easier we make it to stop using passwords the more users and services can get onboard. For users, beyond the methods that you mentioned Azure AD now supports FIDO2 security keys as an authentication method for signing into operating systems, applications, and services. Organizations can issue these keys to everyday information workers. And this approach can make life much easier for frontline workers using shared devices. It works by using industrial strength public private key technology. The FIDO device securely stores private keys. Which you can unlock via a biometric or pin. All authentication messages that are exchanged are signed by the private key and then validated by the public key that’s held in Azure AD. Which then sends a token, or a session cookie, to the device as a proof of authentication.
– And all of this happens by the way in just a fraction of a second. So it feels instantaneous and also convenient to the user.
– Right, and then for IT we have made it easier to drive passwordless adoption. This includes how you roll out passwordless authentication methods in Azure AD. You can automate the management of passwordless using PowerShell or our new Microsoft Graph APIs. We also have new reporting to help you track how well your organization is doing. And this really helps as you roll out new authentication methods and track their usage over time. And you can integrate these metrics with your apps using our APIs.
– Right, I have to really say this is a game changer for me because I use the Authenticator app and even though I frequently sign into lots of different machines and phones and cloud services, all I have to remember is my email address and I get a verification from my phone. So I never need to remember or even type a password.
– Yeah, it’s not only easy but also way more secure than using passwords. And it’s still two factors of authentication. And when users do not have a phone or a dedicated Windows 10 device they can use a FIDO security key. And in fact, we have worked as part of the FIDO Alliance to develop a simple common architecture for secure authentication with FIDO2.
– All right, so let me try this out. I’m going to start by using this method to sign into Windows 10. You can see here that I already have my profile on the device. So I’m going to go ahead and insert the USB key. Then I’m going to click on sign in options. And I’m going to choose the security key one in the middle and it’s going to ask me to touch the security key. So I’ll go ahead and do that. And so that’s going to use my fingerprint to authenticate. Now because we’re using seamless single sign on this authentication also carries forward within my session onto the browser. So I’m going to go ahead and go to myapps.microsoft.com and you’ll see that it just signs me in. Now this works with your Microsoft apps, but you can also see that the SaaS apps are configured here that are using Azure AD and Windows-based authentication. So here you can see, for example, that we have Box. And I also have my on-prem file share available and if I wanted to I could click into that and securely access linked resources that are on the internet or that are apps on-prem.
– Again, you do not need to enter a password. It is super secure and is super convenient. And you can connect to your resources whether they are on premise in the Microsoft cloud or in other clouds and services.
– Right, and this also works across devices. So your pin and biometric by the way are tied to that USB key so you can use it to sign into services with other devices as well. So for example here, my machine’s set up to dual boot to Linux. So it’s running Chrome, and in my case I’ll even try signing into myapps.microsoft.com one more time, this time on Ubuntu without even needing to type in my email address. I’ll click into the sign in options. Now it’s going to ask whether I want to use a security key or GitHub in this case. And again, I’ll choose security key. So I’ll go ahead and insert it. Then I’ll use my fingerprint. Now in my case, you can see that I have two accounts registered to this key. So I’m going to go ahead and choose my account. And similarly, you can see that I can get to the same resources that we saw earlier in the browser that are the apps and anything that supports Azure AD-based authentication.
– Right, it is fast and it’s secure. And the good news is that we are expanding the Microsoft Intelligent Security Association ecosystem of security partners. And these partners are developing a growing range of FIDO2 security keys. This includes a support for the use of NFC reader devices for passwordless sign-in.
– Right, so you also mentioned the admin updates earlier. So how easy is it to set all this up for your tenant? What are some of the changes that have been made?
– So, you enable these experiences in Azure AD portal. Just go to security settings then go to authentication methods. Here, you can see all of our new authentication methods including Microsoft Authenticator and the FIDO2 security key. I will quickly show you how to enable FIDO2 security keys by clicking in. You can scope it to all users or limit the scope to selected users or groups. And in my case, it is already enabled. I have already assigned the group FIDO Pilot and now I will add a new user, Megan Bowen. If I wanted, I could have broadened the scope by adding multiple users and groups. And finally I will hit save. And now Megan is ready for FIDO2 application.
– Okay, so now that Megan is set up what has to happen then for the FIDO key to be associated with her account?
– So Megan would need to register her key. Here I’m signed in as Megan, and I have already navigated to aka.ms/mysecurityinfo. And next I will choose add a method. And from the dropdown I will select security key and hit add. Here, I can choose a USB or NFC device type. And in my case, I will select USB. I will make sure my key is ready and then select next. Then when I continue Windows 10 will guide me through set up. So I will hit okay, and I hit okay again then tap my key to prove presence. Now I will set up the six-digit pin then I’ll re-enter it and click okay. Now I will give it a name, Feitian USBC, and then hit next, then done. And that’s it. My key is ready to use.
– Nice, so now you’ll be able to use this to sign into an Azure AD-joined PC, or like I showed before, you can use it at the browser level on PC, Mac, or Linux. And all of these capabilities are now generally available. But that said, you just released the public preview of Temporary Access Pass, so how does this help in terms of going passwordless?
– To be clear, if you already adopted MFA you have all the pieces in place to enable passwordless authentication quickly. With that said, for brand new employees who do not have a password or MFA that is where the new Temporary Access Pass comes in. This is the missing piece that we need to eliminate the use of passwords as scale. For example, most organizations have a process to prove that you are who you say you are. At the end of the process an administrator can issue a Temporary Access Pass to the verified user. And this Temporary Access Pass is a time-limited passcode that the user can apply to register their passwordless sign-in method, such as a FIDO key or the Microsoft Authenticator app. So let me show you how you would set this up. The Temporary Access Pass is configured as an authentication method. When I select it you see the same controls that we saw earlier. And in this case, I already have it enabled and I set the scope to all users. If I click into edit you will see all the available settings. I can set the minimum and a maximum lifetime as well as a default lifetime. In my case, it’s one hour. And then for the one-time use setting, we recommend you keep this setting to set no if you need to use it more than once during that timeframe. As you can see, it is a very simple process to get this up and running in your tenant.
– Great, so now this is all set up. How do you issue then a Temporary Access Pass to a user?
– So, when you need to generate a Temporary Access Pass in Azure AD just go to the user you want and then navigate to authentication methods. And next, choose add authentication methods and then select Temporary Access Pass. You can either keep the default duration, which is 60 minutes in this case, or choose a duration that you want. Then select add where display the Temporary Access Pass that you can copy and then send to the user. And this is just one way to do this. We also have APIs for this. So you can integrate this process into your own solutions. But Jeremy, we have created one just for you. Why don’t you show us the user experience?
– Okay, so I’ve received my Temporary Access Pass and not only can I register a FIDO key directly as we showed earlier, but I can also now set up passwordless phone sign in when I sign in directly to the Microsoft Authenticator app. Now, first I’m going to go ahead and open up the app. Then I’ll choose add account through authenticator. And now I’m going to choose a work or school account. Then sign in, then continue. And now I’ll type my email jeremy@wingtiptoysonline.com And then I will be asked to sign in with the Temporary Access Pass that you just gave me. So I’m going to go ahead and type that. As I type, you’ll see it’s comprised of special characters, upper and lower case letters. And I’m going to go ahead and tap sign in and that will authenticate to the service. Then I’ll hit finish and now passwordless auth will be working. So I can then use the Authenticator app to sign in.
– Right, now as a user you don’t need to worry about passwords anymore.
– Okay, so I can see this really simplifying things for both users and IT. But given everything that we’ve shown today where’s the best place then to get started?
– If you have MFA set up you have what you need to go passwordless today in just a few steps. And in fact, if you are a Microsoft 365 admin you can use an interactive guide at aka.ms/passwordlesswizard. With that said, if your organization is not using MFA you can try the public preview of Temporary Access Pass to set up passwordless authentication. So try passwordless today.
– Thanks so much for joining us today and also sharing the latest updates for passwordless authentication. Of course, be sure to keep watching Microsoft Mechanics for the latest updates. Subscribe, if you haven’t already and we’ll see you next time.

by Contributed | Mar 25, 2021 | Technology
This article is contributed. See the original author and article here.
This blog post is part 3 of the three-part series on Microsoft Teams and on-premises Exchange mailboxes.
Microsoft Teams and on-premises mailboxes: Part 1 – How do Teams and Exchange Server interact?
Microsoft Teams and on-premises mailboxes: Part 2 – Teams Calendar App Troubleshooting
In the first part of the series, I presented an overview of how Teams Backend Services and on-premises Exchange organizations interact. The second part of the series describes how the Teams Backend Services find the on-premises Exchange organization via AutoDiscover and what options you have to isolate sources of error when problems arise during this process, and the access to the calendar app.
This blog post covers Calendar Delegates for Teams meetings and the calendar-based presence status.
Troubleshooting Microsoft Teams and Calendar Delegates
The Calendar App displays your calendar to plan meetings or live meetings. If you want a delegate to create a Teams meeting on your behalf, the delegate must schedule the meeting in Outlook for desktop if both users have on-premises mailboxes. You can only plan a new Teams meeting if the Microsoft Teams AddIn is available in Outlook.
Another essential prerequisite is that you, as the mailbox manager, grant delegate access with Editor-permissions via the Outlook setup wizard for delegates. Assigning folder permissions on the calendar folder is not sufficient.
Creating a new team meeting by a delegate for a manager mailbox in an on-premises Exchange organization also uses the Exchange Web Services endpoint. Creating a new meeting by a delegate uses the following steps:
- The delegate selects the managers’ calendar in Outlook for Desktop and clicks New Team Meeting in the ribbon bar
- The Teams AddIn connects to the Teams Backend Services and queries the delegate permissions for the manager mailbox
- The Teams Backend Services uses AutoDiscover V2 to acquire EWS URL
- The Teams Backend Services establish an OAuth authenticated connection to the /EWS virtual directory of the on-premises Exchange Server
- The Teams Backend Services send a GetDelegate SOAP-Request for creating the Teams meeting in the manager mailbox
- Exchange Server returns the list of configured mailbox delegates and the corresponding mailbox permissions
- The Teams Backend Services sends the Teams meeting information as a response to the Teams Outlook AddIn, which adds the information to the Outlook meeting request

If you encounter problems creating a new Teams meeting invite as a delegate, you can check the following:
- Does the Teams Calendar App work as expected for the manager and the delegate?
- Execute a GetDelegate query using a SOAP client, i.e., SOAPe
- Again, use Fiddler for additional troubleshooting on the protocol level
- You receive a Teams error notification

- Verify the delegate permission, as direct folder permissions are not sufficient
- You receive a Teams error notification that a connection to the server is not possible

Check the EWS protocol log for the GetDelegate query
Check the IIS Frontend and EWS-Proxy logs for Teams Backend connections
Check the Exchange Server PartnerApplication-configuration
Another error source for connection issues to Exchange Server endpoints is user agent string filtering. If you use Layer 7 network devices that perform such filtering, configure them for bypass.
In part 2 of this mini-series, you learned the detailed steps for troubleshooting using the Exchange Server log files. Use the same procedures for troubleshooting the calendar delegate issues.
Troubleshooting Microsoft Teams and calendar-based Presence Status
Microsoft Teams can update the presence status to “In a meeting” based on calendar information in your mailbox. However, there are limits to this functionality in conjunction with an on-premises Exchange Server mailbox.
The Microsoft Teams client queries the presence status every six minutes from the Teams backend’s Presence Service. An Exchange calendar query can be done in two different modes:
- Pull-Mode
Calendar query based on a 1-hour interval
- Push-Mode
Subscription-based
The combination of Microsoft Teams with on-premises mailboxes supports Pull-Mode only.
The Presence Service uses the REST protocol when querying calendar information and performs the following steps:
- The Teams Backend Services uses AutoDiscover V2 to acquire REST URL
- The Teams Backend Services establish an OAuth authenticated connection to the /api virtual directory of the on-premises Exchange Server
- The Teams Backend Services try to create a new calendar event subscription
a. This action fails because a missing RPC endpoint
- The Teams Backend Services use a REST request to query calendar information and determine a calendar-based presence status
The options analyzing issues are the same that you have already learned about for AutoDiscover and calendar access:
- Does the AutoDiscover response contain the correct REST URL, and is the endpoint accessible from the internet?
- Again, Fiddler is your tool of choice for troubleshooting connection issues on the HTTPS layer
- If you have not yet installed the Exchange Server December 2020 Cumulative Updates or newer, check the web.config of the Frontend REST virtual directory
- Add the maxQueryStringLength attribute to the httpRuntime configuration
File path: $exinstallFrontEndHttpProxyrestweb.config
<httpRuntime maxRequestLength=”2097151″ maxUrlLength=”2048″ maxQueryStringLength=”4096″ requestPathInvalidCharacters=”<,>,*,%,,?” requestValidationMode=”2.0″ />
- Check the IIS Frontend and REST Proxy logs for Teams Backend connections
- Check the Exchange REST logs for proxied Frontend connections
As with the calendar delegate access, user agent string filters are also sources of error for presence status. If you use Layer 7 network devices to filter access to the REST endpoint, configure them for bypass or remove them from the access path for troubleshooting.
Links
Thomas Stensitzki is a leading technology consultant focusing on Microsoft messaging and collaboration technologies and the owner of Granikos GmbH & Co. KG. He is an MVP for Office Apps & Services and an MCT Regional Lead. As a user group organizer, he hosts the Microsoft Teams User Group Berlin and the Exchange User Group DACH.
Twitter: https://twitter.com/stensitzki
Blog: https://JustCantGetEnough.Granikos.eu
Teams User Group: https://TeamsUserGroup.berlin
Exchange User Group: https://exusg.de
To write your own blog on a topic of interest as a guest blogger in the Microsoft Teams Community, please submit your idea here: https://aka.ms/TeamsCommunityBlogger
by Contributed | Mar 25, 2021 | Technology
This article is contributed. See the original author and article here.
In the fast-changing world of remote work, having up-to-date technical skills that align with what’s in-demand is more crucial than ever for productivity, innovation, and growth. Last year, we observed two years of digital transformation take place across the globe in just a couple of months. From schools to corporations, governments, and small businesses, digital transformation suddenly became a matter of business continuation. That put an instant premium on necessary skills to support it, and having the right skills makes a measurable difference. An IDC study showed that trained and certified teams responsible for core IT activities are almost 20% more productive than less proficient staff.1 While a different study shared that IT professionals who have achieved a relevant role-based technical certification perform on average 26% better than their uncertified colleagues.2
Effective training can result in measurable benefits in three critical areas3:
- Timeliness: Well-trained cloud migration teams meet nearly 90% of their business and project milestones.
- Insight: 90% of the organizations with well-trained teams are satisfied or very satisfied with their ability to monitor, forecast, and optimize server, storage, and network resources.
- Business impact: 80% of the organizations with teams well-trained in automation and orchestration tools report being satisfied or very satisfied with the business impact of moving to the cloud.
The bottom line: Ensure you have the right skills for successful digital transformation. Microsoft Learn offers robust resources to deliver targeted training you need, including instructor-led training offered by Microsoft Learning Partners. Let’s take a look at these opportunities as well as how to get a quick training boost with Microsoft Virtual Training Days.
Everyone learns differently – at different paces, using different media, and with emphasis on different topics. At Microsoft, we take these variations into account to help you learn in a style that fits you best. In addition to free and interactive self-paced learning paths discoverable on Microsoft Learn, instructor-led training delivers in-depth, structured training to match your needs. Microsoft instructor-led training courses are delivered by Microsoft Certified Trainers, giving you flexibility to customize your training agenda and dedicated personal attention from technical subject matter experts who are available to help in real-time. They also provide local market expertise and language – an efficient way to advance your skills.
Microsoft Learning Partners: Make training relevant, personal, and timely
As you consider your instructor-led training options, one of your most valuable training resources will be Microsoft Learning Partners. They can help customize your training to meet your learning needs with the right blend of in-person, hands-on, and online experiences that can take place in a classroom, virtually, or at your company’s location.
Learning Partners can assess your level of knowledge and deliver a customized training plan to quickly advance your technical expertise. They’ll help you:
- Define your path to hone in on the technical skills that are right for you to achieve career or business goals.
- Tailor your training plan to match your requirements and deliver training that levels up your skills to meet your specific objectives and project needs.
- Ensure steady progress with individual and team-level reporting, skills assessments, and knowledge checks to inform any adjustments to your learning plan.
Microsoft Virtual Training Days: Digital training events to skill up
Microsoft Virtual Training Days are a great place to initiate and explore your training journey. They offer free, in-depth, virtual training on opportunities for career and organizational impact, and are available weekly. You’ll find digital training events to match every level and grow your technical skills for the fast-changing future. Virtual Training Days cover a wide variety of Microsoft technical skills including Microsoft Azure, Microsoft 365, Dynamics 365, and Power Platform.
The benefits of role-specific training go beyond performance and productivity boosts. It’s worth exploring instructor-led training, Microsoft Learning Partners, and Virtual Training Days to increase job satisfaction, team culture, and talent retention.
To discover more about these offerings, along with the wide range of other empowering, educational opportunities check out Microsoft Learn.
Related posts:
1IDC white paper sponsored by Microsoft, Business Value of Digital Transformation and the Contribution of a Growth Mindset in IT, May 2020
2IDC white paper sponsored by Microsoft, Benefits of Role-Based Certifications, June 2020
3IDC white paper sponsored by Microsoft, Leveraging Microsoft Learning Partners for Innovation and Impact, January 2021
by Contributed | Mar 25, 2021 | Technology
This article is contributed. See the original author and article here.
The following two procedures guide on how to properly collect a memory dump to study a process crash. This post complements my article about how exceptions are handled and how to collect memory dumps to study them.
Both tools below – ProcDump and DebugDiag – work similarly: they can attach themselves as debuggers to a process, then monitor and log exceptions for that process. Optionally, these tools can collect a memory dump for the monitored process under certain conditions – such as when specific exceptions occur.
Both tools need administrative rights to be run.
DebugDiag is the preferred tool, since it automates some steps, adds more explicit context, and includes automated memory dump analysis capabilities too.
Using the command-line ProcDump
ProcDump does not require installation. But one needs to be specific about the PID to which it is attaching. That PID needs to be determined prior to starting ProcDump. This may be tricky then the respective process is crashing and restarting frequently, with a different PID; such as when Asp.Net apps are causing their w3wp.exe to crash and restart. If the w3wp.exe is crashing very fast, then it is advisable to use the DebugDiag method.
- Download the tool and copy it on a disk folder, for example D:Temp-Dumps
https://docs.microsoft.com/en-us/sysinternals/downloads/procdump
- Open an administrative console from where to run commands.
Navigate to the disk folder above (D:Temp-Dumps).
- Find the process ID, the PID, of the IIS w3wp.exe worker process executing your application.
Use the AppCmd IIS tool to list processes for application pools:
C:WindowsSystem32InetSrvappcmd.exe list wp
- Execute the following command to collect dump(s):
D:Temp-Dumps> procdump.exe -accepteula -ma -e [PID]
You may want to redirect the console output of ProcDump to a file, to persist the recording of the encountered exceptions:
D:Temp-Dumps> procdump.exe -accepteula -ma -e [PID] > Monitoring-log.txt
Replace [PID] with the actual Process ID integer number identified at the step 2.
Please make sure that there is enough disk space on the drive where dumps are collected. Each process dump will take space in the disk approximately the same size the process uses in memory, as seen in Task Manager. For example, if the process’ memory usage is ~1 GB, then the size of a dump file will be around 1 GB.
- Start reproducing the problem: issue a request from the client (browser) that you know it would trigger the exception/crash.
Or simply wait or make requests to the IIS/Asp.Net app until the exception/crash occurs.
You should end up with a memory dump file (.DMP) in the location where ProcDump.exe was saved (example: D:Temp-Dumps).
- Compress the dump file(s) – .DMP – before uploading them to share for analysis.
Using the UI tool DebugDiag, Debug Diagnostics Collection
DebugDiag requires installation, but it is able to determine itself the whatever process instance – PID – happens to execute for an application pool at any point in time; even when that process may occasionally crash, hence restart with different PID. Data collected by DebugDiag is richer: along with the dump, we get a monitoring (txt) log with all other exceptions that occurred in the process.
1.
Download Debug Diagnostic and install it on IIS machine:
https://www.microsoft.com/en-us/download/details.aspx?id=49924 v2.2
https://www.microsoft.com/en-us/download/details.aspx?id=58210 v2.3
https://www.microsoft.com/en-us/download/details.aspx?id=102635 v2.3.1
2.
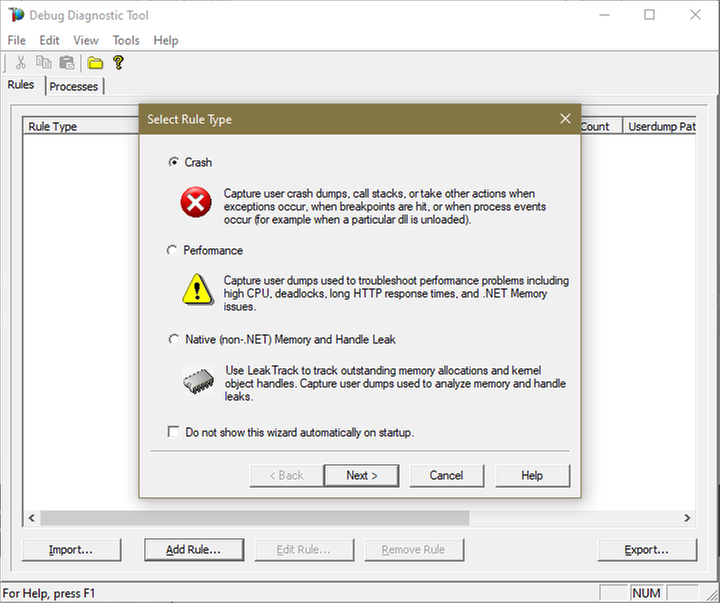
Open Debug Diagnostic Collection.
If a wizard does not show up, click Add Rule.
3.
Choose Crash and click next.
4.
Choose “A specific IIS web application pool” and Next.

5.
Select the application pool which runs the problematic application and then click Next.

6.
Lower the Maximum number of userdumps created by the rule to 3 (up to 5; there is no need to collect more).
Leave the Exceptions/Breakpoints/Events alone; don’t add any.

7.
Click Next and then configure the file location where the dump file(s) will be generated.
Please note that a dump file is a snapshot of the process memory, written in disk; size will be similar to process memory as seen in the Task Manager.
For example, if you see that w3wp.exe uses around 5 GB of memory in Task Manager, then the dump of that process will be around 5 GB on the disk; if you multiply by number of dumps, then… choose a disk with enough free space.
Do not choose a disk in network/UNC; choose a local disk.

8.
Click Next, select to Activate the rule now, and then Finish.
When a second-chance crashing exception is logged, a dump file should be created in the user dump location selected above.
Before sharing the dump file(s) for analysis, ZIP: it should greatly reduce the size (more than 5 times).
If several .DMP files are generated, then ZIP each collected dump individually; trust me, it’s better this way when uploading/downloading.
If we don’t get dumps, then we probably don’t have a crash. Remember my article about how exceptions are handled and how to collect memory dumps to study them. We can double check if a crash occurred or not: read about w3wp.exe crashes.
by Contributed | Mar 25, 2021 | Technology
This article is contributed. See the original author and article here.
To fix application exceptions, we have to understand them. Sometimes we need more than error messages or log entries, we need more context around them. Enter collecting memory dumps. This article is aimed for the less experienced engineers that need to collect data for analysis around exceptions.
Exceptions happen all the time in production applications hosted with IIS; they are more frequent than we think:
- Worst exceptions are crashing the IIS worker process – w3wp.exe – that is executing our web app; but because WAS would restart the process with a warning in Windows events, we quickly end up with a new w3wp.exe (new PID) and potentially degraded user experience (like sessions lost).
- Some exceptions are causing the infamous HTTP response code or pages “500, Server-side processing error”; mostly when the app code is not handling them, and they fall to be further handled by the Asp.Net framework.
- And some exceptions may even go unnoticed, but contributing to less-than-optimal performance, because the system is trying to recover after them, spending CPU cycles.
So how are things happening with exceptions? How do they cause the above behaviors? And how can we study them?
The exception handling in Windows
Every process has at least one code execution thread; often, more. Exceptions happen in process threads. As the thread is executing code, some unexpected situations happen. That occurrence is treated by Windows much like a hardware interrupt: code execution is suspended, and the exception is first reported, then recovery is attempted.
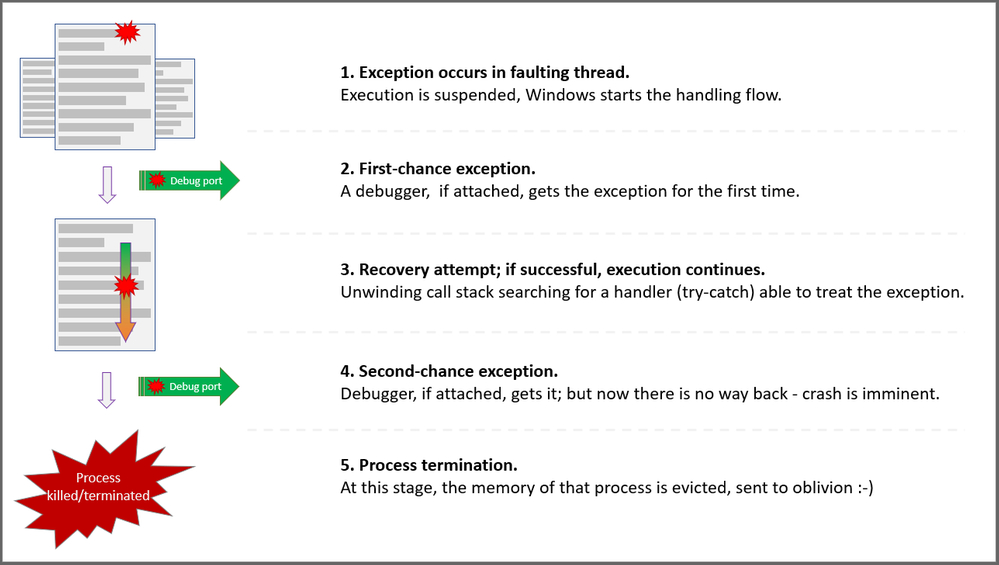
When a process is started, Windows creates associated ports for exceptions in that process: The Debug port, the Exceptions port. When an exception occurs, a few steps are taken in the attempt for recovery:
First chance
The exception is first reported to the Debug port. A debugger may be attached to that port of the process. The debugger has a first chance to look and possibly handle the exception. At this stage, we call it a First-chance exception.
Stack unwinding
If there is no debugger attached, Windows is inspecting the call stack – the succession of function calls – of the thread where the exception occurred. The aim is to find an exception handler – think of it as the try-catch C# construct – able to treat that exception. If the function at the top of the stack, the last one called, does not have the handler, we try with the previous one – N-1. If N-1 does not have the exception handler either, we try with N-2… and so on, until we find a handler for the exception. This process is called the “stack unwinding” and will consume CPU cycles.
Second chance
If the entire thread’s call stack was “un-winded” and we still haven’t found a handler for our exception, the exception will be reported by Windows in the Exception port. A debugger may be attached to that port. Now, the debugger would have its second chance to handle the exception. At this stage, we call it a Second-chance exception.
Process killed
If a debugger is not treating the now-called second-chance exception, the unexpected event is reported in the Exception port and then… Well, the operating system is handling the exception in its way: since system stability has to be kept and the exception has the potential to break other things, like causing data loss, Windows is terminating the process. The entire virtual memory of the process is evicted, and the process is killed. Traces of the event may be left in Windows events, Application log.
Will it crash or not
Because Windows is looking for an exception handler, we never know for sure if a first-chance exception will break the process or not. With Asp.Net applications, this uncertainty increases. Remember that the app runs on top of the Asp.Net framework. Even if the application’s code is not handling the exception, the framework may handle it. How? Well, if the exception happens in the context of processing an HTTP request, then Asp.Net would handle the exception by wrapping it with an error page, or HTTP error status code: “500, Server-side processing error”.
In fact, with Asp.Net, most of the exceptions will be handled by the framework. And so, these exceptions will not crash the executing process. Which makes sense: one of the primary goals of the framework is to continue serve requests, even if some of them fall victims due to exceptions and some users/clients may get a degraded experience.
If the exception happens in a non-request-executing context – like at the application startup or in the finalizer thread – then it has higher chances to reach the stage of second-chance exception, causing the crash of the process. We almost consider them synonyms: second-chance exception = process crash, abnormal termination.
A simplified view for exception handling and capturing
Options to study exceptions
The Asp.Net framework or the .NET runtime, when handling the exceptions, may report these occurrences in Windows events, in Application log. The events may even contain some context, like exception name, the HTTP request being executed, or the call stack of the faulting thread. What if this doesn’t happen? What if we don’t get these traces, or we need even more context about the exceptions? Well, meet the debuggers…
Remember that a debugger may be attached to the Debug port of a process? And that all exceptions are first reported on that port? Well, with a debugger attached, we can take actions on exceptions.
We won’t attach debuggers like Visual Studio one or “real”, “heavy” debuggers in production; frequently, we don’t have that luxury of installing or executing such tools. But there are simple debuggers able to take simple but powerful actions upon exception occurrences.
With a “simple” debugger we can watch all process exceptions, like displaying them on the console. This is the least invasive action; we could share these with the developers, to let them know what happens with their app when in production.
We can log the call stack of the faulting thread, for more context. Or we can tell the debugger to collect the full memory dump of the process at the precise moment when the exception occurs – and we get call stack, object heaps, down to the very processor registry values at that precise moment. With a memory dump, we get a lot of context. We can analyze the memory dump post-mortem to try understanding what the conditions were causing an exception.
Common tools to capture exceptions and context
When troubleshooting, when we realize we need to know and study an exception, we regularly use SysInternal’s ProcDump or Debug Diagnostics. These free tools from Microsoft act like debuggers. We attach them to processes, then take actions like above upon exception occurrence: record call stacks, trigger memory dump collection, etc.
These tools are a must when we investigate w3wp.exe process crashes – we can’t manually collect a memory dump on a second-chance exception / crash. Both ProcDump and DebugDiag can collect the memory dump just before the process and its memory get evicted due to a crash.
While DebugDiag offers a UI and a bit more flexibility, ProcDump is very small and requires no installation. ProcDump is the only option in Windows installations where we don’t have an UI. DebugDiag was created with IIS troubleshooting as a goal, so it has quite a few features helping on that. Oh, and it comes with the functionality of analyzing memory dumps for common issues; for Asp.Net apps based on the “full” .NET framework, it gets the enough actionable info in most cases.
How to: steps for collecting dumps
I’ll place a few illustrated guides, steps on how to use ProcDump and/or DebugDiag to collect memory dumps:
Memory dumps at process termination caused by second-chance exception
Simply have collect the committed memory of a process just before it gets evicted by the OS on killing the process.
Collect call-stack traces for first-chance exceptions occurring in an app
We would do that when we have several annoying exceptions and would need just a bit more context around them; we don’t really want a full “fat” dump for each of the first-chance exceptions.
Collect memory dump(s) for a first-chance exception, when it occurs
When the process is not actually crashing, ever; but we keep getting HTTP responses with “500” status, for same exception, and we need to study the deep context.
Memory dumps at process termination caused by second-chance exception, with optional first-chance dump too
Because we may have some first-chance exceptions building up the “right” context for a second-chance exception to occur.
In addition to collecting memory dumps to study exceptions, some performance-related issues can be studied with dump analysis too. Dumps are very useful when we see memory leaks, when requests are way too slow or the process is downright hanged – requests are piling up in the processing pipeline, and they stay there without a response being generated.
I’ll reference here the illustrated procedures for:
Dump series for hang and performance issues, using a “automated” approach
Have DebugDiag use ETW to monitor HTTP requests; when some are slow, trigger memory dump collection
Dump series for hang and performance issues, using a “manual” approach
Steps to collect memory dumps wen we can witness the slowness, or we can easily reproduce it
Collect memory dumps on high-CPU situations
With DebugDiag or ProcDump we can trigger dump collection on a process when the CPU consumption goes high
Collect series of memory dumps to study memory leaks
Have DebugDiag watching the memory size of a process, collect dumps at certain thresholds

Recent Comments