This article is contributed. See the original author and article here.
The following two procedures guide on how to properly collect a memory dump to study a process crash. This post complements my article about how exceptions are handled and how to collect memory dumps to study them.
Both tools below – ProcDump and DebugDiag – work similarly: they can attach themselves as debuggers to a process, then monitor and log exceptions for that process. Optionally, these tools can collect a memory dump for the monitored process under certain conditions – such as when specific exceptions occur.
Both tools need administrative rights to be run.
DebugDiag is the preferred tool, since it automates some steps, adds more explicit context, and includes automated memory dump analysis capabilities too.
Using the command-line ProcDump
ProcDump does not require installation. But one needs to be specific about the PID to which it is attaching. That PID needs to be determined prior to starting ProcDump. This may be tricky then the respective process is crashing and restarting frequently, with a different PID; such as when Asp.Net apps are causing their w3wp.exe to crash and restart. If the w3wp.exe is crashing very fast, then it is advisable to use the DebugDiag method.
- Download the tool and copy it on a disk folder, for example D:Temp-Dumps
https://docs.microsoft.com/en-us/sysinternals/downloads/procdump
- Open an administrative console from where to run commands.
Navigate to the disk folder above (D:Temp-Dumps).
- Find the process ID, the PID, of the IIS w3wp.exe worker process executing your application.
Use the AppCmd IIS tool to list processes for application pools:
C:WindowsSystem32InetSrvappcmd.exe list wp
- Execute the following command to collect dump(s):
D:Temp-Dumps> procdump.exe -accepteula -ma -e [PID]
You may want to redirect the console output of ProcDump to a file, to persist the recording of the encountered exceptions:
D:Temp-Dumps> procdump.exe -accepteula -ma -e [PID] > Monitoring-log.txt
Replace [PID] with the actual Process ID integer number identified at the step 2.
Please make sure that there is enough disk space on the drive where dumps are collected. Each process dump will take space in the disk approximately the same size the process uses in memory, as seen in Task Manager. For example, if the process’ memory usage is ~1 GB, then the size of a dump file will be around 1 GB. - Start reproducing the problem: issue a request from the client (browser) that you know it would trigger the exception/crash.
Or simply wait or make requests to the IIS/Asp.Net app until the exception/crash occurs.
You should end up with a memory dump file (.DMP) in the location where ProcDump.exe was saved (example: D:Temp-Dumps).
- Compress the dump file(s) – .DMP – before uploading them to share for analysis.
Using the UI tool DebugDiag, Debug Diagnostics Collection
DebugDiag requires installation, but it is able to determine itself the whatever process instance – PID – happens to execute for an application pool at any point in time; even when that process may occasionally crash, hence restart with different PID. Data collected by DebugDiag is richer: along with the dump, we get a monitoring (txt) log with all other exceptions that occurred in the process.
1.
Download Debug Diagnostic and install it on IIS machine:
https://www.microsoft.com/en-us/download/details.aspx?id=49924 v2.2
https://www.microsoft.com/en-us/download/details.aspx?id=58210 v2.3
https://www.microsoft.com/en-us/download/details.aspx?id=102635 v2.3.1
2.
Open Debug Diagnostic Collection.
If a wizard does not show up, click Add Rule.
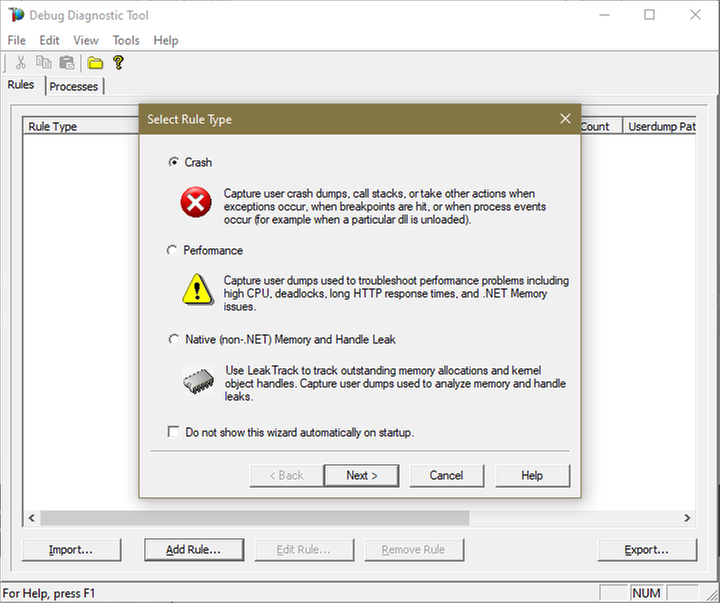
3.
Choose Crash and click next.
4.
Choose “A specific IIS web application pool” and Next.

5.
Select the application pool which runs the problematic application and then click Next.

6.
Lower the Maximum number of userdumps created by the rule to 3 (up to 5; there is no need to collect more).
Leave the Exceptions/Breakpoints/Events alone; don’t add any.

7.
Click Next and then configure the file location where the dump file(s) will be generated.
Please note that a dump file is a snapshot of the process memory, written in disk; size will be similar to process memory as seen in the Task Manager.
For example, if you see that w3wp.exe uses around 5 GB of memory in Task Manager, then the dump of that process will be around 5 GB on the disk; if you multiply by number of dumps, then… choose a disk with enough free space.
Do not choose a disk in network/UNC; choose a local disk.

8.
Click Next, select to Activate the rule now, and then Finish.
When a second-chance crashing exception is logged, a dump file should be created in the user dump location selected above.
Before sharing the dump file(s) for analysis, ZIP: it should greatly reduce the size (more than 5 times).
If several .DMP files are generated, then ZIP each collected dump individually; trust me, it’s better this way when uploading/downloading.
If we don’t get dumps, then we probably don’t have a crash. Remember my article about how exceptions are handled and how to collect memory dumps to study them. We can double check if a crash occurred or not: read about w3wp.exe crashes.
Brought to you by Dr. Ware, Microsoft Office 365 Silver Partner, Charleston SC.

Recent Comments