
by Contributed | Apr 5, 2021 | Technology
This article is contributed. See the original author and article here.
You may have heard that the Kubernetes v1.20 release deprecated dockershim. Our friends in the community published a DON’T PANIC blog that does a great job of clarifying, since a lot of people kind of freaked out.
Jim Linwood, CC BY 2.0, via Wikimedia Commons
This didn’t quite do the trick, so they wrote a FAQ too. Still, the message hasn’t landed everywhere it needs to. And none of these publications address the specialness that is Windows head-on. So, we felt we need to share what this means to you as a user of Windows Server containers in Kubernetes (K8s). As dockershim slowly exits Kubernetes, building containers is no different. For both Windows and Linux, containers built with different toolsets can be run with different runtimes. This is no different for Kubernetes. Containers built with Docker will run without modification in Kubernetes with containerd. Microsoft contributes to containerd to ensure that running those containers on Windows takes advantage of the latest and greatest the platform has to offer. For fun, we thought we’d share some of the myths about what all this means for Windows containers and bust (dispel) them for you.
Myth – the K8s docker shim deprecation will break my Windows container builds for Kubernetes!
Busted – Docker Desktop for Windows will continue to build containers! That is what Docker makes it to do! Kubernetes can run those containers using containerd. (The small print: if your containers depend on Docker sockets (aka docker in docker), you’re out of luck.)
Myth – Docker Desktop for Windows uses containerd already!
Busted – Docker Desktop for Windows uses Docker Engine which is built on moby. Moby, as of this writing, partially depends on containerd. There is ongoing work to adapt moby to use more of containerd on Windows.
Myth – All of my Docker CLIs I depend on my local machine for build process are broken!
Busted – Docker CLIs on your dev box are not being affected, and you may continue to use them to build container images. All this works thanks to the way Docker, containerd, and other tools conform to the Open Container Initiative (OCI) – a set of standards which help ensure tools used to build, publish, and run containers all interoperate together.
Myth – If I upgrade my Azure Kubernetes Service (AKS) cluster to Kubernetes v1.24 (when dockershim is currently planned for removal from kubelet) my Windows containers won’t run!
Busted – Your upgrade will deploy the new containerd runtime on the Windows nodes. But the containers will run just fine.
Myth – I must rebuild all my containers and K8s clusters to use containerd!
Busted – The containerd change is only on the host runtime. Container images build with Docker and other tools that are OCI compliant do not require you to rebuild. You can still use the same container image to run with Kubernetes and containerd. If you are using AKS, all you need to do is deploy your workload on a host which has containerd runtime. For more detail read the Don’t Panic blog.
Myth – I’m running my own DIY (do it yourself – unmanaged) K8s cluster and not using a distro and removing dockershim will break me!
Busted – The K8s community has tested the containerd container runtime for both Linux and Windows to ensure that containers that work with the Docker Engine runtime work with the containerd. Before the should replace your docker runtime on both Windows Server nodes and Linux nodes with containerd. You can find instructions on how to configure runtimes in the community documentation.
Myth – My air-gapped Kubernetes cluster will break with the move to containerd!
Busted – Air-gapped k8s operation still requires your container images to be available to the Windows host in the same way, either from a local container registry, or baked into the OS image’s local containerd image store. This is no different whether you are using dockershim or not.
Finally, a note for customers looking into adopting AKS-HCI: The current preview release uses dockershim as the runtime on Windows. Containerd will be the default runtime in a future release and just like AKS, customers can expect a smooth transition – along with documented instructions on how to upgrade.
As a part of the Kubernetes community, we are working to make sure you are covered. Docker and other tools that build OCI containers will work with the containerd runtime in Kubernetes. These topics, and more, are covered in the Kubernetes Special Interest Group for Windows (SIG Windows) where all are welcome. Please reach out to us if you have questions or feedback.
by Contributed | Apr 5, 2021 | Technology
This article is contributed. See the original author and article here.
Detecting anomalies in your data can be a very powerful and desired functionality. Within Azure Monitor we provide a really easy method to alert on Anomalies if they are coming from Metrics (Creating Alerts with Dynamic Thresholds in Azure Monitor – Azure Monitor | Microsoft Docs). But what if the anomalies you want to detect are not a metric but sit in Application Insights or Log Analytics. Well, that’s where the Kusto query language comes to the rescue.
Detecting Anomalies with Kusto
Kusto has anomaly detection built in using series_decompose_anomalies.
series_decompose_anomalies() – Azure Data Explorer | Microsoft Docs
Now I’m not going to lie, the first time I read the above article I came away a little confused. But once you’ve built a query a few time using this then it becomes fairly simple.
Some of the key things you need to do to utilize this is:
- You need to pull the data that you want to detect anomalies on
- You need to order the results.
- You need to then create either a list or series before you use the series_decompose_anomalies
- Create a new column that detect the anomalies.
I think the best way to show this is to walk through a scenario.
Scenario
We want to look at the number of events occurring on each of our servers in the System event log. We want to detect any anomalies where more events than normal happen on a server. To make this query even more useful we’ll take the list of servers that have had anomalies and chart them by eventid.
Step 1: Pulling the Data
Step one is to get the data that you want to detect anomalies on. What the below query will do is filter to only event in the “System” log and then create a count of events for each server in 30 minute aggregates.
Event
| where TimeGenerated >= ago(7d)
| where EventLog == 'System'
| summarize EventCount=count() by Computer, bin(TimeGenerated,30m)
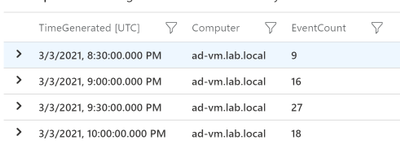
So the output from just this query would look something like this:
Step 2: Order the results
Before we create a list or series we need to order the results by the time generated. This is the simplest step but essential if you want accurate results! Just add the following line to your query:
| order by TimeGenerated
So now our query looks like this.
Event
| where TimeGenerated >= ago(7d)
| where EventLog == 'System'
| summarize EventCount=count() by Computer, bin(TimeGenerated,30m)
| order by TimeGenerated
Step 3: Make a List
Now we have everything ready to create the list in Kusto. Below is the line you need to add to your query. This will make a list of both the TimeGenerated field and the EventCount field. So what we’ll end up with is a single line for each server with a list of the TImeGenerated and EventCount fields.
| summarize EventCount=make_list(EventCount),TimeGenerated=make_list(TimeGenerated) by Computer
So the query looks like this
Event
| where TimeGenerated >= ago(7d)
| where EventLog == 'System'
| summarize EventCount=count() by Computer, bin(TimeGenerated,30m)
| order by TimeGenerated
| summarize EventCount=make_list(EventCount),TimeGenerated=make_list(TimeGenerated) by Computer
And the output should look something like this:

Step 4: Detect Anomalies
We have our query setup to detect the anomalies, we just need to pass the “EventCount” field to series_decompose_anomalies and create a new column with the results:
| extend outliers=series_decompose_anomalies(EventCount)
So the outliers filed will contain 3 values
0=Normal
-1=less events than normal
1=more events than normal
So our query would now look like this:
Event
| where TimeGenerated >= ago(7d)
| where EventLog == 'System'
| summarize EventCount=count() by Computer, bin(TimeGenerated,30m)
| order by TimeGenerated
| summarize EventCount=make_list(EventCount),TimeGenerated=make_list(TimeGenerated) by Computer
| extend outliers=series_decompose_anomalies(EventCount)
And the output should look something like this:

As you can see, we have some anomalies that got detected.
Extra Credit
When I get to this point I always like to look at where the anomalies were detected and make sure that I would consider them anomalies. I won’t go into it in this article but you can adjust how sensitive the calculations. For me to easily see where the anomalies were detected I’ll use mvexpand on any of the list that we’ve made:
| mv-expand TimeGenerated, EventCount, outliers
Then look at the results to make sure where I see a 1 (we’ll later filter to only positive anomalies) it makes sense:

I’d also check on the ones that stay at 0 to make sure the EventCounts are pretty close:

Step 5: Get Useful Information
Not saying what we have right now isn’t useful but I like to use the anomalies info to get more detailed information. So in this case we detected anomalies for the number of events on a server. Now that we know the server had an anomaly maybe we want to graph that by the EventId to determine what caused the anomaly. Lets start by expanding the list like before but then filtering to only outliers that equal 1
| mv-expand TimeGenerated, EventCount, outliers
| where outliers == 1
This will give us every outlier detected by each server. What I really need is a list of each server that has had at least one anomaly. So I just at the following:
| distinct Computer
I want to feed the results into another query so let me set a variable called “Computers” using the let command. So our completed initial query looks like this:
let Computers=Event
| where TimeGenerated >= ago(7d)
| where EventLog == 'System'
| summarize EventCount=count() by Computer, bin(TimeGenerated,30m)
| order by TimeGenerated
| summarize EventCount=make_list(EventCount),TimeGenerated=make_list(TimeGenerated) by Computer
| extend outliers=series_decompose_anomalies(EventCount)
| mv-expand TimeGenerated, EventCount, outliers
| where outliers == 1
| distinct Computer;
So now I can in my next query I can filter down to just these computers using “| where Computer in (Computers)” where Computers is fed in from the above query.
….(prev query)
Event
| where TimeGenerated >= ago(7d)
| where EventLog == 'System'
| where Computer in (Computers)
| extend ChartName = strcat(Computer,'-',EventID)
| summarize EventCount=count() by ChartName,bin(TimeGenerated, 30m)
| render timechart
The only thing different I did here is create a “ChartName” field that is a combination of the Computer and the EventID. I’m using the same time period (7d) and the same aggregation (30m) for both the anomaly detection and this second query. That way you’re looking at the same data for both.
Below is the complete query:
let Computers=Event
| where TimeGenerated >= ago(7d)
| where EventLog == 'System'
| summarize EventCount=count() by Computer, bin(TimeGenerated,30m)
| order by TimeGenerated
| summarize EventCount=make_list(EventCount),TimeGenerated=make_list(TimeGenerated) by Computer
| extend outliers=series_decompose_anomalies(EventCount)
| mv-expand TimeGenerated, EventCount, outliers
| where outliers == 1
| distinct Computer;
Event
| where TimeGenerated >= ago(7d)
| where EventLog == 'System'
| where Computer in (Computers)
| extend ChartName = strcat(Computer,'-',EventID)
| summarize EventCount=count() by ChartName,bin(TimeGenerated, 30m)
| render timechart
Here are the results in my environment.

I just have one server in my environment so charting it makes sense. I would probably analyze the data in a table if I had a bunch of servers. But you can see really quickly I can see that EventID 7036 is the one that is causing the anomalies for this server. The rest of the events are staying stable, but that event varies a good bit on the server.
If you’re interested in another scenario where this same process can be useful check out my previous blog about “Detecting Azure Cost Anomalies.”
Summary
Once you get the hand of “series_decompose_anomalies” it can be a very useful tool in your toolbelt. I covered using this to visualize anomalies in the number of events occurring in the System event log. As long as you can follow the steps above (Get the data you want, order the data, make a list or series, and then detect anomalies) you can explore your data for anomalies. Just like we can visualize the data we can also setup alerts through Azure Monitor.
by Contributed | Apr 5, 2021 | Technology
This article is contributed. See the original author and article here.
Welcome back to my series about the Microsoft Graph Fundamentals learning path on Microsoft Learn. This is part 2; if you did not read part 1 yet, this is your chance to catch up! I will stay here and wait for you with a coffee :hot_beverage:
This module is called Configure a JavaScript application to retrieve Microsoft 365 data using Microsoft Graph and we start with an
intro
We are still sticking to the business scenario from module 1: We want to create an app that can access email, chats, files, meetings. To authenticate users, Microsoft 365 uses Microsoft Identity, and we will need to use Microsoft Identity and Microsoft Graph to get the data we want to display in our app by using Microsoft Authentication Library(MSAL).
Wait, what? Don’t worry if you did not completely understand this. We will do this step-by-step.
Understand the role of Azure Active Directory with Microsoft Graph
OK, we already understood that Microsoft Graph is THE API to access data in Microsoft 365 – but of course, this data needs to be secured because we don’t want everyone to access them, right? This is what we need Microsoft Identity platform for. Microsoft identity ensures that only authorized users (delegated permissions) and apps (application permissions) access data stored in Microsoft 365. The challenge now is to link Microsoft Identity (of which we will use Azure Active Directory) to our Microsoft Graph powered app. The module explains in detail how you register your app in Azure AD and retrieve your application ID. Later on, you will add this ID into the MSAL (Microsoft Authentication Library)’s code of your app to link to your Azure Active directory.
But before we do this in an exercise, we will learn some theoretical stuff that we need later on.
Understand Microsoft Graph permissions and consent
Crucial to understand that a user or admin needs to consent before the app requests permission to access Microsoft 365 data via Graph, which is why we need to know a little bit more about:
Scopes
All resources have specific scopes, like User.Read (lets you read the profile of the signed-in user) or User.Read.All lets you read the profiles of all users present in this directory. Of course, you will want only to allow scopes that are necessary for the application. You can look up scopes for each request in the official documentation and also learn about them while trying out requests in Graph Explorer.
Permission types
We can perform requests on behalf of a user (delegated permission), and we can run background processes like creating, reading, updating, or deleting events of all calendars without the requirement of a signed-in user. This means that an admin will need to pre-consent to these permissions.
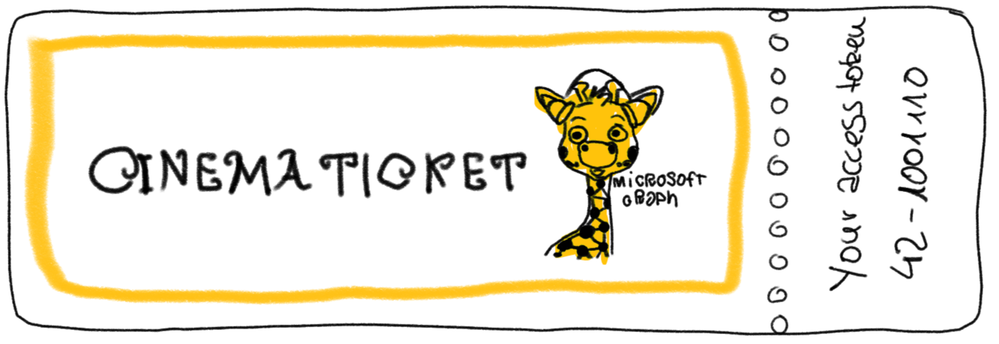
Access tokens
The unit also describes how the magic with an access token works – and uses a great comparison for that! An access token is like a movie ticket – but your application gives it to Graph to show it has permission to access the requested data in Microsoft 365. LOVE this explanation so much!
We use this movie ticket/access token in the Authorization header of our HTTP request.
Register an application with Azure Active Directory
In this unit, you learn which account type you can select when registering an app in AD and that web and single-page apps will require a redirect URI so that identity platform redirects and sends security tokens after authentication.
In case you wondered: There is a big difference between authentication and authorization.

Exercise – Register an application with Azure Active Directory
This exercise walks us step by step through registering an app in Azure AD- I highly recommend following this unit if you never registered an application before:

Let’s now
Retrieve an access token using MSAL
MSAL will make Token interaction more effortless for you because we can acquire tokens from the identity platform to authenticate users and access Microsoft Graph.

Now that we understood the authentication flow, it’s time to get our hands dirty with
Exercise – Retrieve an access token using MSAL
To get this straight – you will clone a repository either using git or downloading a zip file. After opening this in Visual Studio Code (or any other editor), you will need to replace two placeholders with tenant ID and app ID from your Azure app registration.
The unit walks you through some crucial parts of your app and lets you map this code to the authentication flow.

Congratz! – you made it!

Conclusion
I loved this module – even if I already knew how to register applications and what Microsoft Graph does – it clarified the authentication flow once again and walked me nicely through some crucial parts of the code that I cloned from the MSLearn repository. Some basic understanding of JavaScript was beneficial to let the app run and know WHY and HOW it runs.
by Contributed | Apr 5, 2021 | Technology
This article is contributed. See the original author and article here.
Detecting and recognizing faces in videos is a common task. Models are trained to detect the general attributes of the human face, as well as delicate details that are the unique features that make each one of us one of a kind. With the right algorithms and sufficient training models can detect a face in the video, and even, when trained for it, assign the correct name to each face.
What about an animated character? Can the human-based models detect a cartoon version of a human, or even a talking fork? The answer is that in most cases, no. Animated characters have their own unique features, and not only that they are different from humans, but they also differ a lot between themselves.
The animated characters detection and recognition task is indeed a big challenge for the Data Science community. The Video Indexer DS team has been dealing with this task in the past year and half, and today we release a big milestone of improvement in these models. The final goal of this task is to recognize the animated character by its name and specify all its appearances in the video. This is a big task that is separated to three sub models.
Example of Animated Characters Recognition
We would like to create a model that recognizes the characters in the video [1]. Since there is only one episode for this video, to demonstrate that the recognition of characters works on parts of the video that were not used for training the recognition model, I trimmed the video to two parts – part 1 of ~3 minutes, and part 2 – the rest of the video.
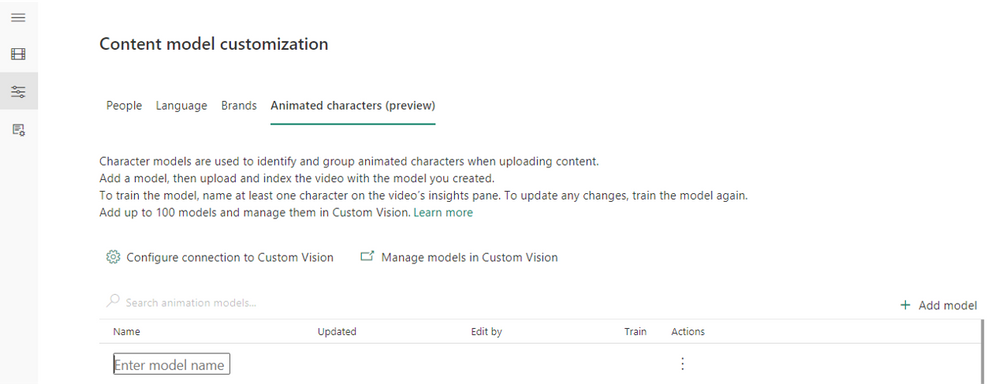
We start from creating an empty animation model:
Go to Model Customization (the left arrow), and to the “Animated characters (preview)” tab. Press on the “Add model” (red arrow), and enter a model name.
Pic 1: screenshot from Video Indexer website creating a custom model for animated characters.

Pic 2: screenshot from Video Indexer website after creating a custom model for animated characters.
Next, we index the first part of the video using the “Animation models (preview)” option, and our new model:

Pic 3: screenshot from Video Indexer website uploading a video selecting an animation characters custom model
This is how the video looks after indexing:

Pic 4: screenshot of Video Indexer player page, showing the detected animated characters of the indexed video [1]
We see that 5 characters were detected in the video, and I’m interested in creating a model for the characters Big Buck Bunny, Rodent1, Rodent2, Rodent3 and Butterfly:

Pic 5: Representative images of the characters that were detected and grouped when indexing the video [1]
I edit the relevant group names in Video Indexer website, and they are automatically shown in the Custom Vision website for the model, with all the images behind each character.

Pic 6: screenshot of custom vision website showing the group of one of the characters [1]
I go over the groups in the Custom Vision website, and delete images that were grouped wrongly, or contain multiple characters in the same image:

Pic 7: screenshot of custom vision website showing the group of one of the characters when images are being deleted [1]
I train the model from the Video Indexer website. It is important to train the model from Video Indexer and not from Custom Vision website.
I then index the second part video with the trained model:

Pic 8: screenshot of the player page of video indexer website. Rodent3 was recognized.[1]
We see that all 5 characters were recognized:

Pic 9: screenshot of the insight panel of video indexer website, showing all 5 characters were recognized successfully. [1]
The black lines below the recognized character indicate the places in the video that this character appears at.
Getting the best results from your animation model
To get good results, we recommend following these guidelines:
- For the initial training, each should be preferably longer than 15 minutes.,. If you have shorter episodes, we recommend uploading at least 30 minutes of video content before training to ensure variability of the training. The multiple videos will contribute to more angles, versions, backgrounds, and outfits of the different characters, and will enable better recognition later.
- Before naming a group, view its images in the Custom Vision website to make sure it’s a good group.
- Remove images that are mistakenly placed in a group. For example, if an image contains multiple characters, it is recommended not to leave it in the group. In addition, an image that is very blurred, or contains an object that is not the wanted characters, should be deleted. This can be done in the Custom Vision website, by checking the images and pressing “Delete”.
- If an image is mistakenly grouped with the wrong character, it is recommended to change its group. This can be done by checking the image, pressing “Tug Images”, writing the correct group’s name, and removing the incorrect one.
- Merge groups of the same character by giving them the same name in Video Indexer.
- Do not leave groups that are smaller than 5 images.
Once you have completed this initial work on the model’s output you are ready to train the model and start using it for recognition.
How does it work?
The first step is detecting that a specific object in the video is indeed an animated character, and not a still object. A character in animation videos can be anything from a girl to a talking car, therefore the detector has a difficult and wide mission. The animation detector was built a year ago and was incorporated in Video Indexer successfully.
The second step is grouping all the instances of the same animated character together. This is in fact a clustering problem, which is an unsupervised task. Our work here included analyzing many animation videos of different types, manually tagging the characters’ images to their assigned groups, and searching for the best algorithmic solution that fits the widest range of animation types. The input for the clustering is an embedding representing the detected animated characters – a numeric representation of each image by a vector of numbers, which is the output of the first step – the detector. We take the embedding, fit it to our needs and apply the clustering algorithm to it, to find the groups of images that represent the same character. Our solution relies on an algorithm of the density-based clustering family, which we trained and expanded for the animation specific needs.
Finally, comes the recognition of the character group that allows for naming the group. This is a step that you might know from using Video Indexer that can recognize hundreds of thousands of celebrities by their name, or any other person that you train your own custom models to recognize. The same can be done with animated characters. After indexing one or a few videos of the same series, the groups of character images that were found, can be named, and merged if necessary. You can then train your own animated model and index new episodes of the same series. The known (trained) characters will be recognized and named automatically.
The recognition step was also improved in the new version we released to be more precise.
 Pic 10: Illustration of the algorithmic process [1]
Learn More
Review the animated character’s model customization concept to learn how to upload animated videos, tag the characters’ names, train the model and then use it for recognition or use the how to guide.
In closing, we’d like to call you to Review the animated character’s model customization concept to learn how to upload animated videos, tag the characters’ names, train the model and then use it for recognition or use the how to guide. We are looking to get your feedback.
For those of you who are new to our technology, we’d encourage you to get started today with these helpful resources in general:
[1] Big Buck Bunny is licensed under the Creative Commons Attribution 3.0 Unported license. © copyright Blender Foundation | www.bigbuckbunny.org
by Contributed | Apr 4, 2021 | Technology
This article is contributed. See the original author and article here.
When protecting your network, you need to have full visibility on your assets. While traditional IT devices are well covered, IoT devices are becoming a bigger blind spot for security operators. IoT devices are added to environments without a proper security solution to protect and monitor them. These devices are becoming a weak spot in every environment, making the entire environment more vulnerable to attacks.
To address this issue, Azure Defender for IoT and Azure Sentinel have created a dedicated workbook, named: IoT Asset Discovery. The workbook includes identification of the IoT devices and their type, the countries those IoT devices are communicating with and if there is any malicious indication related to those devices. Using this dashboard will give a basic assessment of IoT devices and their security exposure.
Currently this feature supports only Fortinet FW logs.
Although this workbook discovers IoT assets, without the need to deploy Azure Defender for IoT. In order to gain a more comprehensive and complete solution for securing and monitoring your IoT environment, we recommend using Azure Defender for IoT. Defender for IoT is built to enhance the security capability of your entire IoT environment. Natively integrated with IoT Hub and Azure Sentinel, Azure Defender for IoT will enrich your environment with unprecedented comprehensive investigation, monitoring and response capabilities.
To explore more about security features on the IoT platform, Join IoT Security community.

Recent Comments