This article is contributed. See the original author and article here.
Introduction
As Microsoft Cloud Solution Architects, we get asked by Businesses, IT Managers and Cybersecurity Experts to accurately report on the Vulnerabilities and CVEs in our environments. This could be as easy as just deploying Endpoint Protection updates or as advanced as deploying every category and 3rd Party Updates using Microsoft Defender for Endpoint.
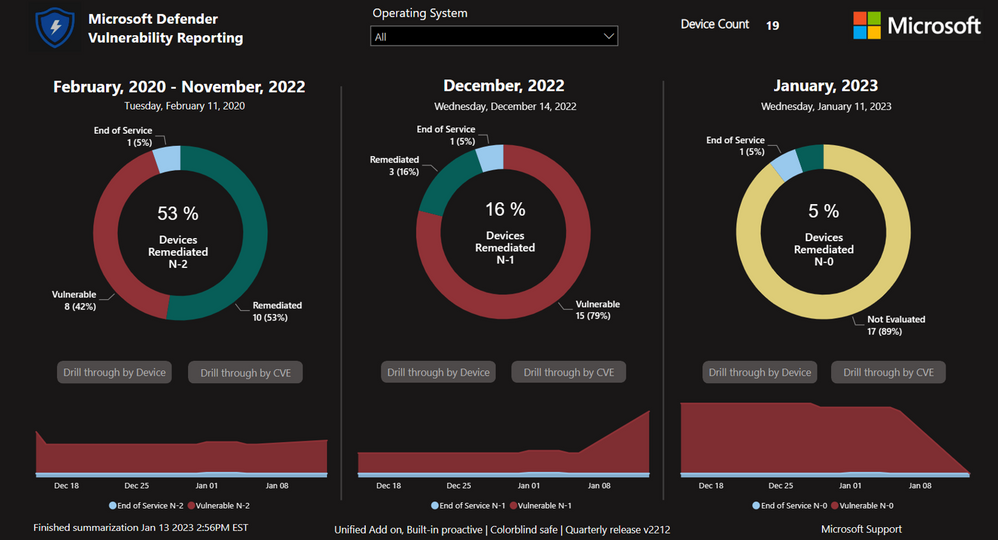
Microsoft Defender for Endpoint Vulnerability Reporting with Power BI – involves implementing a cloud-based reporting and visualization solution that brings exposure to active threats into sharp focus. It is intended to provide value to IT Leaders, Stakeholders, Security & Compliance teams, and Operations Teams that are responsible for mitigating CVE documented risks. The reports provide rich drill throughs that enable full understanding of an organization’s current data and trends. The data is sourced from Microsoft Defender for Endpoint using API calls, stored in a small serverless Azure SQL instance, and can be accessed from anywhere on any device.
Outcomes
Dashboard with summary view that shows CVE vulnerability status for the current month (n-0), the previous month (n-1), and all prior.
Customization options to exclude specific CVEs and classes of vulnerabilities.
Cloud installation that creates a small Azure serverless SQL instance, an Azure Automation Account, and an Azure Service Principal.
The Report
Conclusion
This solution will provide accurate reporting of your Vulnerabilities across the entire Defender for Endpoint Estate.
How do I book this engagement?
If you are a Microsoft Premier or Unified customer, you can reach out to your Customer Success Account Manager (CSAM) for more questions!
Special thanks to the Dev Team:
Chris Sugdinis, Ken Wygant, Michael Schmidt, Nathan Hughes, Shawn Rand, Todd Sterrett, Jon Ellis, Suhail Abdul Salam, Vikram Sahay, Werner Rall
Disclaimer
The sample scripts or Power BI Dashboards are not supported under any Microsoft standard support program or service. The sample scripts or Power BI Dashboards are provided AS IS without warranty of any kind. Microsoft further disclaims all implied warranties including, without limitation, any implied warranties of merchantability or of fitness for a particular purpose. The entire risk arising out of the use or performance of the sample scripts and documentation remains with you. In no event shall Microsoft, its authors, or anyone else involved in the creation, production, or delivery of the scripts or Power BI Dashboards be liable for any damages whatsoever (including, without limitation, damages for loss of business profits, business interruption, loss of business information, or other pecuniary loss) arising out of the use of or inability to use the sample scripts or documentation, even if Microsoft has been advised of the possibility of such damages.
This article is contributed. See the original author and article here.
Today, we’re announcing the general availability of Office 365 Government Secret cloud, which includes our first release of Office 365 Government capabilities including Exchange, Outlook, and Microsoft 365 Apps.
This article is contributed. See the original author and article here.
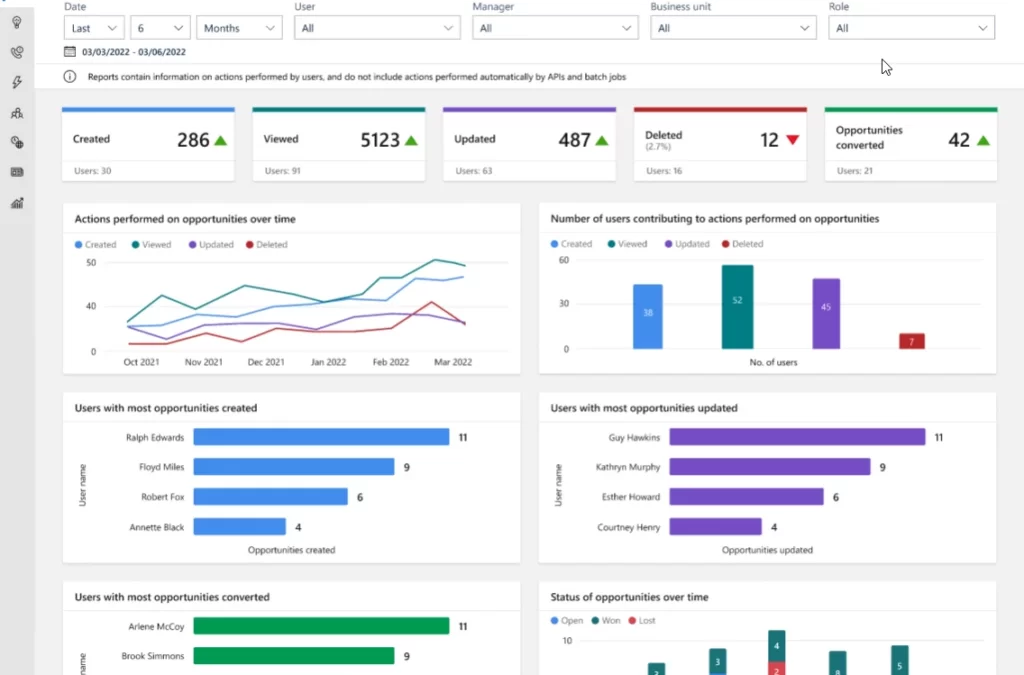
Data is one of the key resources to making informed, contextual decisions. Without data, without being able to measure telemetry and usage, it’s challenging to identify areas of improvement. But it’s not just the data itself that matters, it’s that this data is actionable, helping users understand not only the what, but also the how and why. With Dynamics 365 Sales product usage reports, we’re happy to offer administrators and sales managers the ability to get data at their fingertips.
The new feature allows sales managers and sales administrators to track the usage of Contacts, Opportunities, Leads and Accounts (COLA entities) by their sellers. With this information, they will be able to make critical decisions about the work processes within their teams. For example, they will be able to see which teams use the COLA entities less than others, and double-down on expanding CRM usage best practices to those teams. In another example, managers, with the help of product usage reports, will be able to easily identify the top performing sellers in terms of using the application, for rewarding or benchmark purposes.
Understand seller performance with product usage reports.
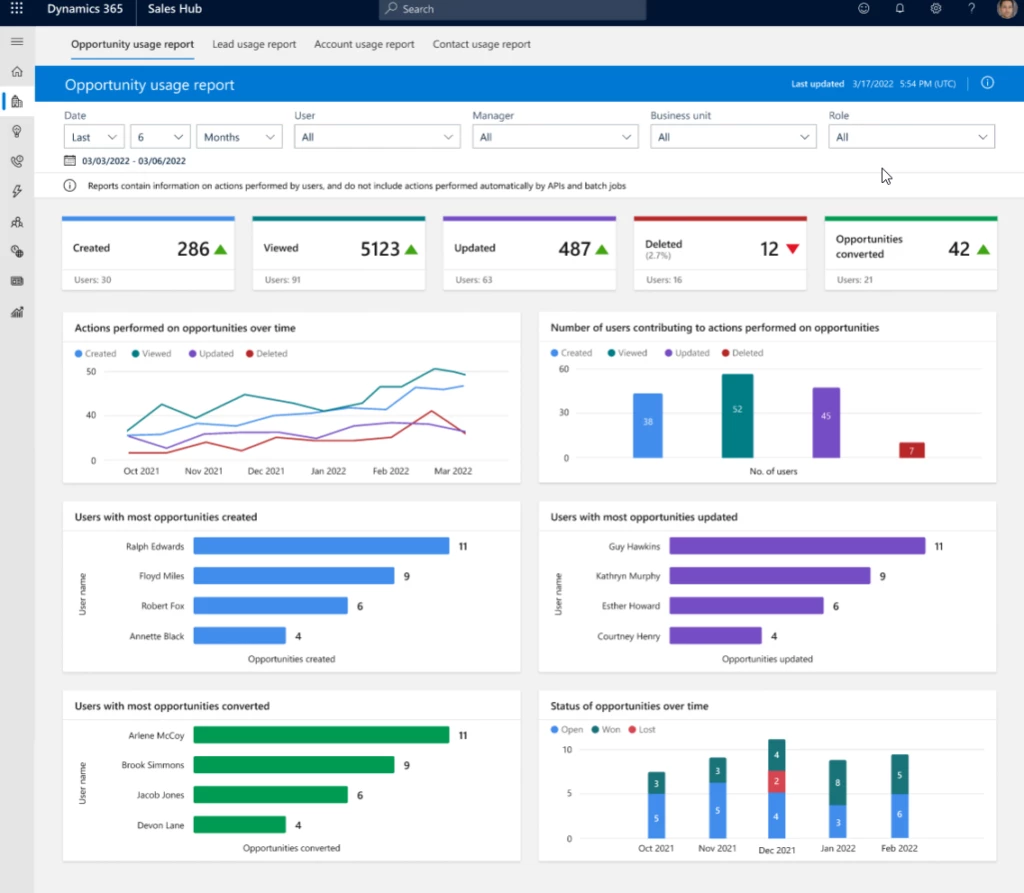
The Dynamics 365 Sales product usage insights are Power BI embedded dashboards, that allow sales managers, sales administrators and other users to view the usage of COLA entities within the application. They can easily understand and assess the performance of sellers with respect to various transactional sales entities.
Sales managers can easily access the dashboards with a simple enable switch. Sales administrators or managers can also provide permissions to access these dashboards further to other users, based on configuration.
At this stage, we are releasing the following dashboards:
Opportunity usage
Lead usage
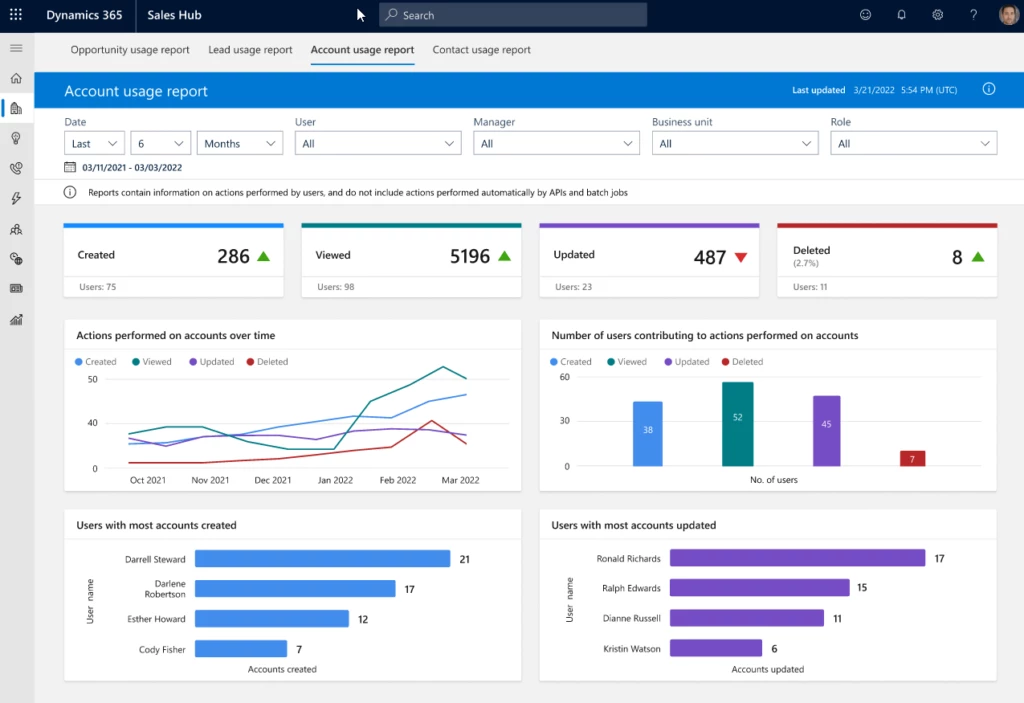
Account usage
Contact usage
Each dashboard can be divided into three broad sections.
Filters Slice and dice the data to have different views. Filtering parameters include data range, business unit, roles, manager name etc.
KPI charts Summarize KPIs for the specified date and the percentage change during the period. This view includes a trend to show how the KPI is doing in the selected timeframe compared with the previous timeframe. A green upward triangle indicates an improvement in the score, and a red downward triangle indicates a decline in the score.
Metric charts A detailed view of the individual values of records. For example, created date, status, and who created and converted the record.
Lead usage report
Gain insights on how sellers work
On top of the benefits of the Dynamics sales usage reports to sales managers mentioned above, there are also benefits for sales administrators.
Sales administrators can analyze the Create, Read, Update, and Delete (CRUD) operations that sellers perform on their COLA entities. To help this analysis, the usage report dashboards have the following charts:
CRUD operations over a period To help the admin user to understand the usage of COLA entities by the sellers.
Users contributing to the CRUD operations To allow the admin user to easily find the usage of leads and opportunities by sellers or groups of sellers.
Top users contributing to CRUD operations To help the admin user to identify the top performing sellers in terms of using the sales entities.
Leads & Opportunity overtime chart To help understand the qualification/win rate of the entities over a period of time.
This article is contributed. See the original author and article here.
CISA released two Industrial Control Systems (ICS) advisories on January 24, 2023.These advisories provide timely information about current security issues, vulnerabilities, and exploits surrounding ICS.
CISA encourages users and administrators to review the newly released ICS advisories for technical details and mitigations:
This article is contributed. See the original author and article here.
We have heard feedback that with so many commands it can be challenging to remember the exact syntax or learn new cmdlets, so we are enabling a solution to make the experience easier.
We are excited to announce that we have enabled Predictive IntelliSense in PSReadLine and the predications from Azure PowerShell Az.Tools.Predictor module.
Beginning February 2023 Azure Cloud Shell uses the version of PSReadLine that has Predictive IntelliSense enabled by default. We’ve also installed and enabled the Azure PowerShell predictor Az.Tools.Predictor module. Together, these changes enhance the command-line experience by providing suggestions that help new and experienced users of Azure discover, edit, and execute complete PowerShell commands.
What is Predictive IntelliSense?
Predictive IntelliSense is a feature of the PSReadLine module. It provides suggestions for complete commands based on items from your history and from predictor modules, like Az.Tools.Predictor.
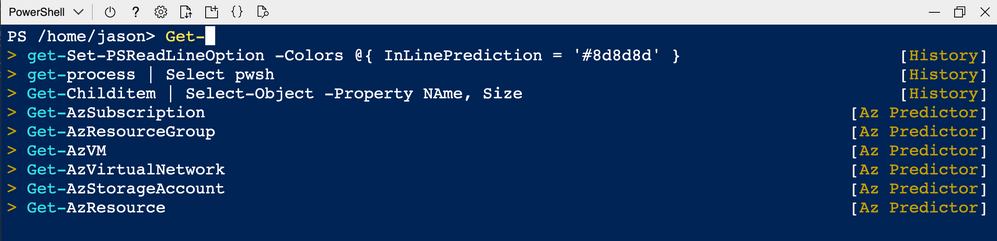
Prediction suggestions appear as colored text following the user’s cursor. The image below shows the default InlineView of the suggestion. Pressing RightArrow key accepts an inline suggestion. After accepting the suggestion, you can edit the command line before hitting Enter to run the command.
PSReadLine also offers a ListView presentation of the suggestions.
In ListView mode, use the arrow keys to scroll through the available suggestions. List view also shows the source of the prediction.
You can switch between InlineView and ListView by pressing the F2 key.
We welcome suggestions and feedback to your experience working with Azure Cloud Shell. Please help us learn your feedback by posting issues and suggestions to our Azure Cloud Shell GitHub.


Recent Comments