
by Contributed | Oct 28, 2020 | Uncategorized
This article is contributed. See the original author and article here.
Discover how the Microsoft Cloud for Healthcare and Microsoft Teams transforms virtual health and care team collaboration.
The post Microsoft Cloud for Healthcare helps empower care teams with better experiences, better insights, and better care appeared first on Microsoft 365 Blog.
Brought to you by Dr. Ware, Microsoft Office 365 Silver Partner, Charleston SC.

by Contributed | Oct 28, 2020 | Technology
This article is contributed. See the original author and article here.
In my work as an engineer on the Postgres team at Microsoft, I get to meet all sorts of customers going through many challenging projects. One recent database migration project I worked on is a story that just needs to be told. The customer—in the retail space—was using Redshift as the data warehouse and Databricks as their ETL engine. Their setup was deployed on AWS and GCP, across different data centers in different regions. And they’d been running into performance bottlenecks and also was incurring unnecessary egress cost.
Specifically, the amount of data in our customer’s analytic store was growing faster than the compute required to process that data. AWS Redshift was not able to offer independent scaling of storage and compute—hence our customer was paying extra cost by being forced to scale up the Redshift nodes to account for growing data volumes. To address these issues, they decided to migrate their analytics landscape to Azure.
Migrating Databricks to Azure was straightforward because Databricks is available as a first-party service on Azure via Azure Databricks. Regarding the database, Azure offers a variety of database services, so our customer had a few choices. The customer’s data size was not huge, it was around 500GB—which led them to wonder: should they choose PostgreSQL which would likely reduce the migration effort because Redshift is Postgres based? Their question was: would a single Postgres node give suitable performance? Or should they choose a pure analytical store, which might not be required and incur extra migration effort.
This post will walk you through our journey of considerations, tests, requirements, blockers and so on, as we helped our customer determine which database would ensure an optimal balance of increased performance and reduced cost—with the simplest migration off of Redshift, too.

Interactive analytics dashboard requires fast query responses
Prior to the data migration away from Redshift, the customer had been using the Redshift data warehouse to store and analyze data related to user events on their website, sales, marketing, support, and so on. This data was coming from various sources (applications) and the load was near real-time (every 1 hour). Hence, the Redshift data warehouse was a central piece of their analytics (OLAP) story.
They used the open source Metabase as the BI tool to generate dashboards and visualize all the data—and they had nearly 600 queries that needed to be migrated from Redshift. As dashboards are end-user facing, queries had to perform very well, i.e., with query response times in single digit seconds. In addition, the analytics dashboards were very interactive, i.e., their users could filter and slice/dice on over 20 different dimensions. There were around 200 Databricks jobs (aka Apache Spark) that transformed and cleaned the data stored in the data warehouse and made the data ready for querying from Metabase.
Would a single Postgres node deliver the required performance?
Since Amazon’s Redshift data warehouse is based on PostgreSQL (Redshift is a proprietary fork of Postgres) and our customer’s data size of ~500GB was not huge, the first thing the customer decided to test was vanilla PostgreSQL on a single server, to see if single-node Postgres database would make the cut. They tested with Azure Database for PostgreSQL – Single Server, the PaaS offering for Postgres on Azure. However, it turned out that a single Postgres server was not adequate for this customer’s application: SQL queries that had been running in single digit seconds on Redshift took over 40 seconds to complete on a single Postgres node. This is because even though Postgres offers Parallel Query feature that can parallelize a single query using multiple threads, it is restrictive in terms of what type of queries and what parts of the query plan can be parallelized. Hence we were not able to maximize the underlying hardware resources to improve query latency.
At this point, our team suggested that the customer try the Hyperscale (Citus) deployment option in Azure Database for PostgreSQL.
If you are unfamiliar with Citus, a quick primer: Hyperscale (Citus) is built from Citus, an open source extension to Postgres. On Azure, Hyperscale (Citus) transforms Postgres into a distributed database, so you can shard/partition your data across multiple nodes in a server group—enabling your Postgres queries to use all of the CPU, memory, and storage in the server group (i.e. in the distributed cluster.) Hyperscale (Citus) has built-in logic to transform a single query into multiple queries and run them asynchronously (in parallel) across multiple partitions (called shards) in an efficient way to maximize performance. The query parallelism offered by Citus extends to a variety of SQL constructs—including JOINs, subqueries, GROUP BYs, CTEs, WINDOW functions, & more.
An important prerequisite to scaling out Postgres horizontally with Hyperscale (Citus) is to decide what your distribution column will be. (Some people call the distribution column the ‘distribution key’, or the ‘sharding key.’) Most of the times picking a distribution column is very intuitive based on the application use case. For example with this customer, for the click stream workload that captures events from users visiting their website, we picked user_id as it is a natural sharding key because events are coming from users, and the dashboards are for analyzing and understanding user behavior. This architectural diagram for Hyperscale (Citus) is below:
 Diagram 1: A Hyperscale (Citus) distributed database consists of a coordinator node and worker nodes. Each node is a Postgres server with the Citus extension installed. The Citus coordinator orchestrates the Postgres queries to the right worker node, and the workers are where the actual data exists and the computation happens. Queries are either routed to a single worker and executed on smaller tables/indexes (called shards) (OR) are parallelized across worker nodes. The Citus architecture is very similar to a Massively Parallel Processing (MPP) database; the difference is that with Citus, you get the benefits of parallelization plus the benefits of PostgreSQL—JOINs, GROUP BYs, window functions, CTEs, JSONB, HLL, PostGIS, and so on.
Choosing Hyperscale (Citus) to power an analytics workload
Real-time analytics is a use case where Hyperscale (Citus) really shines. The MPP nature of a distributed Postgres database and close relationship with the PostgreSQL ecosystem makes Hyperscale (Citus) a compelling choice for migrations from Redshift.
The customer tested Hyperscale (Citus) and found an average ~2x performance improvement vs Redshift for similar sizing (hardware) on both sides. They went with a 2 worker-node Hyperscale (Citus) cluster with each worker having 8vcores (64GB RAM) and 512GB storage. So the total horse power of the database was 16vcores, 128GB RAM and ~3000 IOPs (3 IOPs/GB of storage). Below are some of the learnings from the migration process.
 Diagram 2: Architecture diagram of our customer’s analytics landscape. Includes different types of data sources including sales, marketing, user events, support, etc. Data gets ingested into Hyperscale (Citus). Azure Databricks is used as the ETL engine to clean and transform data to generate final datasets that will be visible to end-users via interactive Metabase analytics dashboards.
Query parallelism & Postgres indexes yielded a ~2x performance gain vs. Redshift
Query parallelism and indexes are a game changer in workloads where you need to filter on many different combinations of columns, where you can’t afford to scan the entire dataset for these queries. This ability to create indexes in Hyperscale (Citus) really helped. Redshift is not very flexible with indexes; you can’t run the CREATE INDEX command because Redshift is a columnar store. With Hyperscale (Citus), however, you get the same flexibility as Postgres in creating indexes. Even the CREATE INDEX and CREATE INDEX CONCURRENTLY are parallelized across worker nodes, which can lead to tremendous performance benefits. (CONCURRENTLY avoids blocking writes during index creation.) We have heard customers reporting close to ~5-10x performance improvement in creating indexes with Hyperscale (Citus).
In this customer scenario, we created more than 30-40 indexes to speed up their Postgres queries. Because of the interactive nature of their analytics application, there was a lot of dynamic filtering based on various dimensions—and using Postgres indexes definitely helped.
Use JSONB to store semi-structured data
Because Redshift doesn’t support the JSON/JSONB data types, our customer had been forced to store their large JSON documents as text columns in Redshift—and they also had to use the JSON functions that Redshift provides to parse through the JSON documents. The good news is that because Hyperscale (Citus) natively supports the Postgres JSON/JSONB data-types, you can store and query JSON documents, and you can use JSONB to store the JSON document in a binary format.
As a part of the migration process, we decided to use the JSONB data type in Hyperscale (Citus) instead of text, so our customer could reap the benefits of JSONB—a robust set of functions that Postgres natively supports for JSONB, as well as the ability to index JSONB columns with GIN type indexes. This not only helped in modernizing the application by using recent features of Postgres, but also led to significant performance gains—querying a JSONB directly is better than typecasting a text to a JSON and then querying it. If you haven’t yet tried JSONB in Postgres, I would strongly recommend trying it out—it’s been a game changer for many customers! 
The JSONB data type in Postgres can also give 6x-7x compression
An interesting phenomenon we observed was that the storage footprint in Hyperscale (Citus) was only slightly higher than that of Redshift (550GB in Hyperscale (Citus) vs 500GB in Redshift). Since Redshift stores data in a columnar format, it compresses really well. As Hyperscale (Citus) is a row-based store, we expected the Hyperscale (Citus) storage footprint to be significantly higher, but we were surprised to see a very low increase in storage footprint compared to Redshift, even with 30-40 Postgres indexes.
Using the JSONB datatype in Postgres, which inherently compresses the JSON documents (with toast), made the difference. As the size of a JSON document grows, the compression rates increase. We have seen over 7x compression with some customers storing large JSON documents (in MBs).
Migration effort from Redshift to Hyperscale (Citus) took ~2 weeks
As Redshift is also based on PostgreSQL, the migration effort was minimal. Overall, it only took around two weeks for the end-to-end migration from Redshift to Hyperscale (Citus). As I mentioned before, the first step was to pick the right distribution column(s) so you can inform Hyperscale (Citus) as to how you want your data sharded across all the nodes in the Hyperscale (Citus) cluster. The next step was to decide which tables should be distributed vs. which tables should be reference across all the nodes in the Hyperscale (Citus) cluster. Once that was done, code changes were made—including changes to some of the SQL queries and databricks jobs—followed by data migration using simple Postgres pg_dump and pg_restore utilities.
Some of the learnings from our migration journey from Redshift to Hyperscale (Citus) in Azure Database for PostgreSQL:
- Tables: 180 tables were migrated. Over 80 of them were distributed across worker nodes.
- Query migration:
- 80% of the queries were drop-in, with no modification!
- 18% of the queries needed Redshift->Postgres syntax changes to get benefits from to text->JSONB conversion. Instead of using functions that Redshift provides, we used native JSONB functions/operators provided by Postgres.
- 2% of the queries needed updates that were Hyperscale (Citus) related, i.e., distributed tables related.
- Databricks jobs: 200 Databricks jobs were nearly drop-in, with minimal changes, because the JDBC driver that Redshift uses is same as that for Postgres/Hyperscale (Citus).
Hyperscale (Citus) has a shared nothing architecture
Hyperscale (Citus) has a shared nothing architecture i.e. each node in the cluster has its own compute and storage. We let you scale up/down compute of coordinator and workers separately. If you wanted to just scale storage and not compute, you can do that as well by scaling storage on workers and coordinator independently. Our customer found this useful as a way of optimizing costs, especially because with Redshift they had not been able to independently scale storage.
Along with this we also give you the ability to horizontally scale out. You can easily add more servers to the Hyperscale (Citus) server group on Azure and rebalance data in an online way. By “online” I mean there is no downtime for reads and writes while rebalancing data from already existing servers to the new servers in the cluster (cluster = server group, I use those two terms interchangeable.)
Some sweet spots for migrations from Redshift to Hyperscale (Citus)
Based on our experience, Azure Database for PostgreSQL – Hyperscale (Citus) could be a compelling option for customers migrating from Redshift for certain workloads. As the case study above illustrates, below are some sweet spots for Hyperscale (Citus). If your workload has one (OR) more of these sweet spots, consider Hyperscale (Citus) as a good candidate for your analytics (OLAP) store.
- Interactive real-time analytics: Different variations of queries due to multiple permutations of column filters. An indicator of this is when your end-users need to ask questions with lots of different parameters, which means they need to query with many different column filters. One way I often describe it is: “Interactive Real-time Dashboarding/Analytics” vs “Pure Offline Analytics”.
- Mixed workloads with transactions & analytics: UPDATEs, DELETEs are a part of the workload along with INSERTs/COPY (common in mixed workloads such as htap, as seen in this SIGMOD demo).
- High concurrency: more than 50 end users querying the database at one time (a.k.a. interacting with the Metabase interactive analytics dashboard at once) along with concurrent ingest.
- Preference for Postgres: an affinity to stick to Postgres and use its latest features—JSONB, HLL, Partitioning, PostGIS/Geospatial etc.
by Contributed | Oct 28, 2020 | Technology
This article is contributed. See the original author and article here.
Microsoft CMMC Acceleration Program
We are actively building out our program by developing resources for both partners and DIB companies to leverage in their CMMC journey. These tools cannot guarantee a positive CMMC adjudication, but they may assist candidate organizations by improving their CMMC posture going into a formal CMMC review in accordance with CMMC Accreditation Body standards. While we plan to release resources and guidance in waves, please keep in mind we are dependent upon the CMMC Accreditation Body finalizing the CMMC guidance itself.
Here is a summary of current resources to help get you started.
Microsoft Compliance Manager with Assessment Templates
Compliance Manager
Microsoft Compliance Manager is a feature in the Microsoft 365 compliance center that helps you manage your organization’s compliance requirements with greater ease and convenience. Compliance Manager may helps you throughout your compliance journey, from taking inventory of your apparent data protection risks to managing the complexities of implementing controls, staying current with regulations and certifications, and reporting to auditors.
Note: Compliance Manager is only available in Commercial at the time of this writing and is reflective of existing CMMC guidance, which is subject to change and refinement by the CMMC Accreditation Body. The roadmap plan is to make Compliance Manager available in Microsoft 365 Government by end of the calendar year 2020.
Compliance Manager helps simplify compliance and reduces risk by providing:
- Pre-built assessments for common industry and regional standards and regulations, or custom assessments to meet your unique compliance needs.
- The Assessment Templates include NIST SP 800-171 and projected requirements for CMMC Levels 1-5.
- The Assessment Templates that are available to your organization depend on your licensing agreement. Review the details. HINT: You will need an E5 SKU.
- Workflow capabilities to help you efficiently complete your risk assessments through a single tool.
- Detailed step-by-step guidance on suggested improvement actions to help you comply with known CMMC standards and regulations that are most relevant for your organization. For actions that are managed by Microsoft, you’ll see implementation details and audit results.
- A projected risk-based compliance score to help you understand your compliance posture by measuring your progress in completing improvement actions.
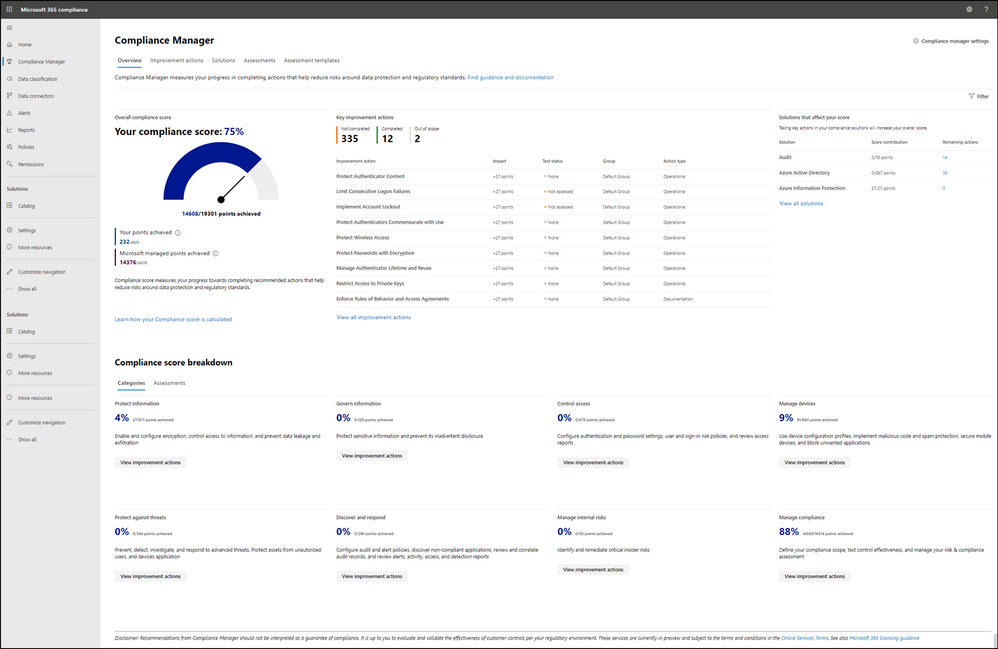
Your Compliance Manager dashboard shows your current projected CMMC compliance score, helps you see what needs attention, and guides you to key improvement actions. Below is an example of what your Compliance Manager dashboard will look like:

Please note, the Compliance Manager dashboard is a projection of your organization’s CMMC compliance profile based on all available information to date—Microsoft is not an accrediting body under the CMMC, and thus cannot guarantee any outcome under the formal CMMC review process.
Understanding your compliance score
Compliance Manager awards you points for completing improvement actions taken to comply with a regulation, standard, or policy, and combines those points into an overall compliance score. Each action has a different impact on your score depending on the potential risks involved. Your compliance score helps you prioritize which actions to focus on to improve your overall compliance posture.
Compliance Manager gives you an initial score based on the Microsoft 365 data protection baseline. This baseline is a set of controls that includes key regulations and standards for data protection and general data governance.
Azure Security Center with Azure Blueprints
Azure Security Center
Microsoft uses a wide variety of physical, infrastructure, and operational controls to help secure Azure, but there are additional actions you need to take to help safeguard your workloads. You may turn on the Azure Security Center to strengthen your cloud security posture:
- Assess and visualize the security state of your resources in Azure, on-premises, and in other clouds with Azure Secure Score;
- Simplify enterprise compliance and view your compliance against regulatory requirements such as NIST SP 800-171 and CMMC;
- Protect all your hybrid cloud workloads with Azure Defender, which is integrated with Security Center; and
- Use AI and automation to cut through false alarms, quickly identify threats, and streamline threat investigation.
You may assess the security state of all your cloud resources, including servers, storage, SQL, networks, applications, and workloads that are running in Azure, on-premises, and in other clouds. This includes the ability to visualize your security state and improve your security posture by using Azure Secure Score recommendations. You may view your compliance against a wide variety of regulatory requirements or company security requirements by centrally managing security policies to perform ongoing assessment and get rich, actionable insights and reports to simplify compliance.


Note: The Azure Security Center is available today in both Commercial and in Azure Government.
Azure Blueprints
Just as a blueprint allows an engineer or an architect to sketch a project’s design parameters, Azure Blueprints enables cloud architects and central information technology groups to define a repeatable set of Azure resources that implements and adheres to an organization’s standards, patterns, and requirements. Azure Blueprints makes it possible for development teams to rapidly build and stand up new environments with trust they’re building within organizational compliance with a set of built-in components, such as networking, to speed up development and delivery.
Blueprints are a declarative way to orchestrate the deployment of various resource templates and other artifacts such as:
- Role Assignments
- Policy Assignments
- Azure Resource Manager templates (ARM templates)
- Resource Groups
The Azure Blueprints service is designed to help with environment setup. This setup often consists of a set of resource groups, policies, role assignments, and ARM template deployments. A blueprint is a package to bring each of these artifact types together and allow you to compose and version that package, including through a continuous integration and continuous delivery (CI/CD) pipeline. Ultimately, each is assigned to a subscription in a single operation that can be audited and tracked.
With Azure Blueprints, the relationship between the blueprint definition (what should be deployed) and the blueprint assignment (what was deployed) is preserved. This connection supports improved tracking and auditing of deployments. Azure Blueprints can also upgrade several subscriptions at once that are governed by the same blueprint.
A blueprint sample for NIST SP 800-171 is available today. We are working to author a new CMMC Level 3 blueprint sample to be available by the end of calendar year 2020.
Compliance Manager and the Azure Security Center
You may observe there are two different compliance tools depending on the use of Microsoft 365 or Microsoft Azure. While there are currently two different tools, they are not mutually exclusive in use. Holistic compliance with CMMC requires the use of both the Compliance Manager and the Azure Security Center. You deploy the Compliance Manager with the Assessment Template for CMMC for coverage of Microsoft 365 products and features, such as Office 365 and Enterprise Mobility & Security. Generally speaking, this includes coverage for most SaaS offerings. You will also want to deploy the Azure Security Center with the Azure Blueprint sample for CMMC (roadmap) for coverage of Azure IaaS and PaaS offerings. We are working on integration between the two tools along with integration with Azure Sentinel in the future roadmap. In the meantime, you will need to leverage both panes of glass for CMMC compliance.
Zero Trust Architecture with Azure Blueprints
Zero Trust Architecture
Today, many of our customers in regulated industries are adopting a Zero Trust architecture – moving to a security model that more effectively adapts to the complexity of the modern environment, embraces the mobile workforce, and protects people, devices, applications, and data wherever they’re located.
Regardless of where the request originates or what resource it accesses, Zero Trust teaches us to “never trust, always verify.” In a Zero Trust model, every access request is strongly authenticated, authorized within policy constraints, and inspected for anomalies before granting access. This approach aids the process of achieving compliance for industries that use NIST-based controls including the DIB and government.
A Zero Trust approach should extend throughout the entire digital estate and serve as an integrated security philosophy and end-to-end strategy, across three primary principles: (1) verify explicitly, (2) enforce least privilege access, and (3) assume breach.
Azure blueprint for Zero Trust
We have developed a GitHub Repo for an Azure Blueprint sample enabling Configuration-as-Code for Azure subscriptions. The Azure Blueprint for Zero Trust enables application developers and security administrators to more easily create hardened environments for their application workloads. Essentially, the blueprint will help you implement Zero Trust controls across six foundational elements: identities, devices, applications, data, infrastructure, and networks.
Using the Azure Security Center and Azure Blueprints service, the Zero Trust blueprint sample will first configure your VNET to deny all network traffic by default, enabling you to extend it and/or set rules for selective traffic based on your business needs. In addition, the blueprint enforces and maintains Azure resource behaviors and configuration in compliance with specific NIST SP 800-53 security control requirements using Azure Policy.
The blueprint includes Azure Resource Manager templates to deploy and configure Azure resources such as Virtual Network, Network Security Groups, Azure Key Vault, Azure Monitor, Azure Security Center, and more. If you’re working with applications that need to comply with FedRAMP High or DoD Impact Level 4 requirements or just want to improve the security posture of your cloud deployment, the blueprint for Zero Trust is designed to help you get there faster.
The Azure blueprint for Zero Trust is currently in preview with limited support. To learn more and find instructions to deploy into Azure, see Azure blueprint for Zero Trust. For more information, questions, and feedback, please contact us at Zero Trust blueprint feedback.
We are also working on a new version of the Azure blueprint for Zero Trust to be released by the end of calendar year 2020. Once we have the updated version released, we will begin updates in support of NIST SP 800-171 and CMMC for availability in the first half of calendar year 2021.
CMMC Documentation
Microsoft Product Placemat for CMMC
The Microsoft Product Placemat for CMMC is an interactive view representing how Microsoft cloud products and services satisfy requirements for CMMC practices. The user interface resembles a periodic table of CMMC Practice Families. The default view illustrates the practices with Microsoft Coverage that are inherited from the underlying cloud platform. It also depicts practices for Shared Coverage where the underlying cloud platform contributes coverage for specific practices but requires additional customer configuration to satisfy requirements for full coverage. For each practice that aligns with Microsoft Coverage or Shared Coverage, verbal customer implementation guidance and practice implementation details are documented. This enables you to drill down into each practice and discover details on inheritance and prescriptive guidance for actions to be taken by the customer to meet practice requirements in the shared scope of responsibility for compliance with CMMC.
In addition to the default view, you may select and include products, features and suite SKUs to adjust how each cloud product is placed with CMMC. For example, you may select the Microsoft 365 E5 SKU for maximum coverage of CMMC where 18 of the CMMC practices are Microsoft Coverage, versus 72 practices are Shared Coverage. This is extraordinary as nearly 70% of the practices for CMMC Level 3 have coverage leveraging the spectrum of capabilities on the Microsoft cloud!

The Microsoft Product Placemat for CMMC is currently under development with a planned release by the end of calendar year 2020. CMMC Acceleration Program participants will be offered a private preview in the November timeframe.
CMMC Compliance Documentation
There are several artifacts we are working on for release by the end of calendar year 2020, to include:
- SSP: System Security Plan with customer scope of responsibility detailed
- CIS: Control Implementation Summary per environment (IaaS, PaaS and SaaS)
- SAR: Security Assessment Report from Microsoft’s C3PAO engagement
- Documented auditor observations based on pre-defined tenant configuration
Microsoft Cybersecurity Reference Architecture
The Microsoft Cybersecurity Reference Architecture (MCRA) describes Microsoft’s cybersecurity capabilities and how they integrate with existing security architectures. We have seen this document used for several purposes by our customers to include:
- Starting template for a security architecture – The most common use case we see is that organizations use the document to help define a target state for cybersecurity capabilities. Organizations find this architecture useful because it covers capabilities across the modern enterprise estate that now spans on-premises, mobile devices, many clouds, and IoT / Operational Technology.
- Comparison reference for security capabilities – We know of several organizations that have marked up a printed copy with what capabilities they already own from various Microsoft license suites (many customers don’t know they own quite a bit of this technology), which ones they already have in place (from Microsoft or partner/3rd party), and which ones are new and could fill a need.
- Learn about Microsoft capabilities – In presentation mode, each capability has a “ScreenTip” with a short description of each capability + a link to documentation on that capability to learn more.
- Learn about Microsoft’s integration investments – The architecture includes visuals of key integration points with partner capabilities (e.g. SIEM/Log integration, Security Appliances in Azure, DLP integration, and more) and within our own product capabilities among (e.g. Advanced Threat Protection, Conditional Access, and more).
- Learn about Cybersecurity – We have also heard reports of folks new to cybersecurity using this as a learning tool as they prepare for their first career or a career change.

The Microsoft Cybersecurity Reference Architecture is available here. Additional training resources are available here.
An update will be released by the end of calendar year 2020 to include the branding updates announced at Ignite 2020. Most notably, the use of the Microsoft Defender branding will be incorporated in the update to MCRA.
Microsoft Blog Posts on CMMC
Program Scaffolding for Managed Service Providers
Behind the scenes, we are actively working with our partner community, and in particular the Managed Service Providers (MSP), to deliver scaffolding in the construction of CMMC offerings. The CMMC Acceleration Program is comprised of many different components as described above, and several that are yet unannounced. The intent is to provide building blocks, or what we call “scaffolding”, to our partners in support of their CMMC offers. Our partners will be enabled in our partner marketplace with advance specializations for CMMC and their concentration on the Defense Industrial Base. In alignment with the commitments made in our original CMMC Announcement, our MSP partners will implement reference architectures and compliance solutions for CMMC.
Into the Future
Microsoft is actively engaged with customers, partners, the CMMC Accreditation Body, and multiple industry working groups to refine what resources we should develop and make available as part of the CMMC Acceleration Program. We have many grand ideas, and welcome to feedback from the community at large. Please don’t hesitate to reach out to us at cmmc@microsoft.com with your input and any interest you may have in learning more about the program.
Appendix
Please follow me here and on LinkedIn. Here are my additional blog articles:

by Contributed | Oct 28, 2020 | Technology
This article is contributed. See the original author and article here.
This Microsoft Tech Community Public Sector Blog post is an in depth response for the Defense Industrial Base (DIB) regarding compliance with the newly-established Cybersecurity Maturity Model Certification (CMMC) from the U.S. Department of Defense (DoD).
Please note that the information cutoff date for this post is April 2021, and that as of the date of this writing, CMMC developments and guidance are in progress. Additionally, as of the date of this writing, the CMMC Accreditation Body (CMMC AB) has not formalized guidance for Cloud Service Providers. As a result, the information herein, including our CMMC related offerings, are provisional and may be enhanced to align with future guidance from the DoD and CMMC AB. Microsoft is closely tracking developments related to the CMMC.
Cybersecurity Maturity Model Certification
The Defense Industrial Base (DIB) is subject to a significant number of regulations and standards protecting information systems for national security. Regulations include the Defense Federal Acquisition Regulation Supplement 252.204-7012 (DFARS 7012) mandating the implementation of National Institute of Standards and Technology (NIST) Special Publication 800-171 and U.S. Federal Risk and Authorization Management Program (FedRAMP) Moderate Impact Level for Cloud Service Provider (CSP) hosted cloud solutions.
Historically, the U.S. Department of Defense (DoD) has not required the Defense Industrial Base (DIB) to use independent third parties to audit and certify unclassified non-federal information systems, and instead relied on DIB companies to self-attest to their information protection and cybersecurity status.  This precedent is changing as the DoD believes that the cybersecurity posture will be improved by no longer allowing self-attestation of security and compliance. As a result, the DoD is rolling out a new framework called the Cybersecurity Maturity Model Certification (CMMC) requiring periodic audits from independent, CMMC AB certified third-party assessment organizations (C3PAO) beginning in the Winter of 2020. The CMMC builds upon DFARS 7012 and NIST 800-171 while adding a compliance audit and certification requirement. CMMC is the next stage in DoD efforts to properly secure the DIB by measuring and verifying a defense contractor’s ability to safeguard Federal Contract Information (FCI) and Controlled Unclassified Information (CUI). CUI includes categories of information such as International Traffic in Arms Regulations (ITAR) and Export Controlled data. In addition, CMMC introduces stronger accountability for the prime contractor to assess and manage that appropriate security requirements are met across their supply chain hierarchy including partners, contractors and suppliers. A prime contractor must validate appropriate levels of subcontractor compliance to reinforce security across the supply chain hierarchy prior to contract award.
CMMC certification is a pre-requisite for DoD contract award. CMMC requires an evaluation of the contractor’s technical security controls, process maturity, documentation, policies and processes to ensure security and resiliency. Pursuant to the CMMC framework, the DoD will assign a Maturity Level 1-5 to individual functions of each DoD procurement, starting with basic safeguarding of FCI at Level 1, moving to broad protection of CUI at Level 3, and culminating with reducing the risk from Advanced Persistent Threats (APT) and nation state activity at Levels 4 and 5. Each level is made up of practices and processes that a contractor must demonstrate to achieve that level of certification. Certification levels will be determined through assessments by C3PAOs with the intent to inform risk to the DoD. After implementation of the CMMC framework, the DoD will assign a maturity level to individual functions of each DoD procurement. These maturity levels will be listed in requests for proposals, or RFPs, and will serve as go/no-go evaluation criteria for the selection of contractors based on the maturity level they have achieved.
Note: The intention of CMMC is not to be a checklist of controls to implement and audit for, but rather serve as a framework for cybersecurity, improving the maturity of an organization as they progress from Level 1 to a Level 5.

CMMC Maturity Progression
Version 1.02 of the CMMC framework released in January 2020. Certification levels in requests for information, or RFIs, will be issued in Winter 2020 and in RFPs starting Spring 2021.
For more information on CMMC, please see https://www.cmmcab.org/cmmc-standard
Certifying with the Microsoft Cloud, how Microsoft products meet CMMC
Existing cybersecurity framework adoption
Microsoft has adopted NIST Special Publication 800-53 to demonstrate compliance with FedRAMP. Over a decade ago, Microsoft rebuilt and grounded its internal compliance frameworks to be based off NIST 800-53. All Microsoft cloud environments and products snap into this framework, streamlining the ability to demonstrate compliance with a multitude of global, government, industry and regional standards, certifications and accreditations. Microsoft clouds are audited bi-annually for NIST 800-53 compliance by a third-party assessment organization (3PAO).
Microsoft has also adopted the NIST Cybersecurity Framework (CSF). NIST CSF is a voluntary framework that consists of standards, guidelines, and best practices to manage cybersecurity-related risks. The developers of CMMC have used NIST CSF for many of the guidelines incorporated into the CMMC body of work.
Microsoft’s government cloud services meet the demanding requirements of the DoD Cloud Computing Security Requirements Guide (SRG). The SRG defines the baseline security requirements for CSPs that host DoD information, systems, and applications, and for DoD’s use of cloud services. It maps to the DoD Risk Management Framework and NIST 800-37/53. Microsoft has Provisional Authorizations for SRG impact levels 2 through 5, enabling customers to benefit from the rigorous security of the Microsoft Cloud. By deploying services into the US Sovereign Cloud including Azure Government, Microsoft 365 Government GCC High, and Dynamics 365 Government GCC High, customers can use a rich array of services demonstrating compliance at SRG IL4 and IL5.
In addition, Microsoft Government Cloud services help the DIB meet the Defense Federal Acquisition Regulation Supplement (DFARS) requirements as enumerated in the DFARS clauses of 252.204-7012 that apply to CSPs.
CMMC reciprocity
While the details are still being finalized by the DoD and CMMC AB, Microsoft is expected to allow some degree of reciprocity with FedRAMP, NIST 800-53, NIST CSF, and the DoD SRG with many of the CMMC security controls mapping directly to controls under these existing cybersecurity frameworks. As a result, Microsoft plans to take advantage of its existing certifications and security controls by demonstrating where customers running on the Microsoft cloud are eligible for any allowed reciprocity and have security controls inherited from the underlying cloud platform. Microsoft is currently mapping its existing cybersecurity controls and certifications with the CMMC controls that correspond with CMMC Levels 1-5 to identify how customers may achieve a program of reciprocity. Microsoft’s goal is to help strengthen cybersecurity across the DIB by continuing to have world-class cybersecurity technology, controls and best practices, and to put its cloud customers in a position to inherit Microsoft’s security controls and eventual CMMC certifications.
What cloud environments meet the requirements for CMMC?
One of the most common questions is, What cloud environments meet the requirements for CMMC? Cybersecurity frameworks are applied to all Microsoft cloud environments consistently across the spectrum of services. Cybersecurity ‘maturity‘ is often represented as the efficacy of process and automation of practices. There are specific control requirements that are unique to each cloud environment. For example, sovereign clouds such as Azure Government have controls in place for restricting access to only screened US persons with data processing and storage only within the Continental United States (CONUS). Sovereign clouds are more restricted in terms of the specificity of control requirements in relation to other cloud environments. Even though control requirements may vary from one cloud environment to another, each may demonstrate a level of cybersecurity maturity in alignment with CMMC. Accordingly, the current intent is to establish a program of reciprocity for all Microsoft cloud-based products and services that are in scope for DIB customers, alongside FedRAMP, NIST 800-53, NIST CSF, DoD SRG, etc.
Note: While commercial environments will be in scope, CMMC by itself will not be the decision factor on choosing which environment is most appropriate. Most DIB companies are best aligned with Azure Government and Microsoft 365 Government GCC High for data handling of Controlled Unclassified Information (CUI). For more information, please refer to:
Understanding Compliance Between Microsoft 365 Commercial, GCC, GCC-High and DoD Offerings
and
Microsoft US Sovereign Cloud Myth Busters – CUI Effectively Requires Data Sovereignty
Microsoft’s CMMC Acceleration Program, the plan to help customers get certified
Executive Summary
Microsoft’s CMMC Acceleration Program is a comprehensive package targeting the improvement of DIB customers’ cybersecurity maturity taking advantage of the inherent compliance native to Microsoft cloud services.
Microsoft is delivering a portfolio of CMMC resources and automated implementation tools custom-tailored to the DIB, providing education, architectural references and support during the adoption of Microsoft cloud services. In addition, Microsoft works closely with trusted partners to implement reference architectures and compliance solutions. For example, Microsoft industry partners may leverage Microsoft’s CMMC Acceleration Program to host pre-configured enclaves compliant with CMMC, DFARS 7012 and NIST 800-171. These solutions will include documentation (e.g., SSP, SAR, etc.) that may be used to significantly reduce the amount of work necessary for certification.
Microsoft’s goal is to provide the scaffolding with a baseline framework for compliance. The Microsoft baseline is expected to significantly close the gap for compliance of infrastructure, applications and services hosted in Microsoft Azure, Microsoft 365 and Dynamics 365. Any resource that is deployed to the enclave will inherit the native controls. Microsoft will work with trusted partners and customers to enable them to close their compliance gap and mitigate risks, assist tenants with their shared customer responsibility, and provide solutions ready for CMMC assessment and certification.
Shared responsibility for compliance
Customers using cloud services lessen their burden for compliance as the cloud represents a shared responsibility between the customer and the cloud service provider (CSP). For example, Microsoft as the CSP manages most controls for physical security and host infrastructure, so customers and partners don’t need to spend resources building and maintaining their own datacenters.

Shared Responsibility Matrix
The graphic above demonstrates the CSP responsibility in respective cloud models (On-Prem, IaaS, PaaS, SaaS) with light blue aligning with CSP and dark blue aligning with customer responsibility.
In the context of CMMC, each customer will be responsible for its own certification but are expected to save time, money and other resources leveraging a program of reciprocity and inheriting Microsoft’s existing security controls and certifications.
DIB organization profiles
To help map the value proposition of Microsoft’s CMMC Acceleration Program for DIB organizations, it helps to describe a few organization profiles. While every DIB company is unique, in most cases DIB organizations fall into one of the following three profiles: (1) Small- to medium-sized businesses (SMB); (2) Large DIB corporations; or (3) Moderate DIB organizations.
Greater than 60 percent of DIB companies are Small- to Medium-sized Businesses (SMB), most of which have fewer than 500 employees with little to no IT staff. Most SMBs do not have dedicated cybersecurity staff, such as a Chief Information Security Officer (CISO), or network defenders working in a Security Operations Center. In addition, many DIB SMBs are primarily focused on defense with most of their employee population.
On the opposite end of the spectrum, large DIB corporations make up less than 10% of the DIB sector. They have large and mature IT organizations, with employees dedicated to cybersecurity (e.g. the CISO office). Many large DIB corporations are multinational and have business outside of the U.S. DoD supply chain, but they have formal programs dedicated to trade compliance with the U.S. DoD.
Somewhere in the middle, between SMB and the large DIB corporations exist a whole host of organizations that mix both commercial and defense businesses. These companies may only have a small employee population focused on defense. While they are considered DIB, they likely do not consider themselves Aerospace nor Defense companies. Many commercial companies are an example of this, call them moderate DIB organizations. They have material business with the U.S. DoD along with considerable commitments, but are not necessarily thought of as purely a defense contractor. Moderate DIB organizations may have a separate subsidiary or business unit focused on defense. Or they may be a research institution, such as Federally Funded Research and Development Center (FFRDC) or a University Affiliated Research Center (UARC), many that are part of larger universities across the country.
Dividing the DIB up into these three profiles is of course vastly over-simplifying the myriad of businesses and organizations that make up the DIB sector. However, this supports how Microsoft is approaching the CMMC Acceleration Program.
Microsoft’s CMMC Acceleration Program details
As mentioned earlier, Microsoft will deliver a portfolio of resources and automated implementation tools custom-tailored to the DIB. Microsoft will provide the scaffolding with a baseline for compliance. Microsoft and industry partners will help customers identify and close gaps, supplementing tenant certification efforts with a shared-responsibility model. For example, a customer may retain a Managed Service Provider (MSP) to deploy and govern future CMMC certified enclaves on behalf of customers in Microsoft cloud services. Microsoft will also work with industry partners that may assist DIB organizations in the assessment process, such as documenting System Security Plans (SSP).
Microsoft believes that SMBs will benefit the most as a result of adopting the Microsoft CMMC Acceleration Program. They may adopt the cloud comprehensively and leverage the baseline for compliance provided by Microsoft. Coupled together with an MSP offering, SMBs may have the quickest path to certification.
Note: Any deviation or customization of the pre-configured enclave modeled with the Microsoft CMMC Acceleration Program artifacts may incur added effort on the tenant to document their scope of control responsibility relative to the changes introduced.
Large DIB corporations have a longer journey. Most cannot move their entire IT into the cloud and must certify a much larger spectrum of environments on-premises and in multi-cloud solutions. Many Large DIB Corporations are looking to Microsoft to help their supply chain become compliant. Naturally, many companies in their supply chain are SMB and may take advantage of the Microsoft CMMC Acceleration Program. In addition, DIB prime contractors often have a requirement to procure secure data enclaves. In this context, a secure data enclave is a DIB cloud environment that will be CMMC certified for use with a specific project or mission system. This DIB cloud environment may be hosted in Microsoft cloud services and mirror the deployment an SMB may have, only this is a shared enclave for use by the DIB prime and its supply chain. The Microsoft CMMC Acceleration Program may be used in the construction of these environments.
Note: Microsoft and other CSPs consistently engage and share with DIB working groups to help improve the overall ecosystem. This is beneficial to Large DIB Corporations and the industry at large, especially as CMMC practices are formalized and automated leveraging Microsoft technologies.
Moderate DIB Organizations may also take advantage of the CMMC Acceleration Program for the subsidiaries or business units focusing on defense. However, many Moderate DIB Organizations find it difficult to identify the line of demarcation between the defense business and the rest of the company. If they keep the employee population integrated within the larger organization, it will require CMMC certification of the entire company. That is simply untenable for many commercial enterprises that are not dedicated to defense (e.g., a telecom or automobile manufacturer). The cost of adopting the CMMC framework may be prohibitive. Alternatively, Moderate DIB Organizations may choose to isolate an environment specifically for the defense business. In a similar vein as the SMB managed service environment, or the secure data enclaves, the defense business may be hosted in Microsoft cloud services, inheriting the compliance from Microsoft while segmented from the rest of the company. Depending on implementation, it may only require the defense business to be certified, as opposed to the entire company.
In all three cases, each DIB organization profile may take advantage of the Microsoft CMMC Acceleration Program. Most notably, expected reciprocity between CMMC controls and Microsoft’s native compliance is strategic in evolving the cybersecurity for an agile and resilient defense posture of the organization and providing a program to help facilitate CMMC certification.
For a detailed breakdown of the resources available in the CMMC Acceleration Program, please see Microsoft CMMC Acceleration Program Update – October 2020.
We would love to hear your feedback! Please post comments to this article below.
If you’re interested in learning more or participating in the program, email: cmmc@microsoft.com
Appendix
Please follow me here and on LinkedIn. Here are my additional blog articles:
by Contributed | Oct 28, 2020 | Technology
This article is contributed. See the original author and article here.
This article will guide you through a series of recommendations to improve performance on your database. In addition, it will refer to various public documents that can complement the actions described in this article.
Many believe Azure SQL Database will have optimal performance due to its proven versatility on various environments, however, that’s not always the case. Azure SQL Database requires that end users update statistics and find missing indexes with certain frequency, according to how much data manipulation happens on their tables. The less logical reads your queries make, the less resource consumption will be required from an Azure SQL Database. Updating statistics and finding missing indexes, are among other performance tuning database methods, mainly recommended to help you decrease the number of logical reads and improve general database performance.
I am a firm believer that there is no SQL Database unable to keep up with any given workload, but a poorly designed maintenance plan. In average, 80% – 90% of the performance related support cases I have been involved in, are created due to a non-existent maintenance plan or even the awareness said plan is needed.
Azure SQL Database unit of measure is DTU (Data Transaction Units), which is composed of CPU, LogIO and DataIO, the closer to 100% of consumption any of these DTU components get, the more issues your databases will experience. Additionally, this would also apply if your database were on a vCore service tier as the same internal metrics are used.
To solve this, there are at least two different ways to approach this situation. The recommendation is for your maintenance routine to include the below action plan which includes updating statistics, finding missing indexes and frequent monitoring, or increase the service level to add more hardware capabilities to your database, while you work to decrease the work load footprint on your database. At least until you’re able to bring the situation under control; bear in mind, these recommendations will increase the DTU consumption, which it is suggested to increase the service tier while you complete your maintenance routine or perform it during a time of the day (or night) in which your application doesn’t require the horse-power.
The below article goes in detail how to identify performance issues, if you notice degradation on your database performance.
Monitor performance using DMVs – Azure SQL Database & SQL Managed Instance
Moreover, to monitor the database for high DTU components usage (CPU, LogIO, DataIO) you can use the following DMVs:
This query will give you the 5 minute averages of resource usage for the database(s) so you can see if there was an extended timeframe of resource usage or the size of the database.
— Run against master
Select * from sys.resource_stats
where database_name = ‘your_database_name’
Unlike the above query, this one only provides information for the past hour on resource usage and must be ran directly against the database. It will provide a more granular view of the resource percentages used as it is broken into 15 second intervals.
— Run against the database with the performance issue
Select * from sys.dm_db_resource_stats
—–
Recommended Maintenance Plan
1.- Update all your tables data distribution statistics, with a 100% sampling rate (Fullscan). This data is used by the SQL query optimizer to select an execution plan for the queries, and it’s vital that the statistics are updated to get effective execution plans.
We recommend updating stats on a regular basis based on how often data changes or is inserted. It could be necessary to update them daily, every other day, or weekly.
Connect to your database and run the following to update all stats in the database in one step.
———————————————————————-
— Update ALL Statistics WITH FULLSCAN
— This will update all the statistics on all the tables in your database.
— remove the comments from EXEC sp_executesql in order to have the commands actually update stats, instead of just printing them.
SET NOCOUNT ON
GO
DECLARE updatestats CURSOR FOR
SELECT table_schema, table_name
FROM information_schema.tables
where TABLE_TYPE = ‘BASE TABLE’
OPEN updatestats
DECLARE @tableSchema NVARCHAR(128)
DECLARE @tableName NVARCHAR(128)
DECLARE @Statement NVARCHAR(300)
FETCH NEXT FROM updatestats INTO @tableSchema, @tableName
WHILE (@@FETCH_STATUS = 0)
BEGIN
SET @Statement = ‘UPDATE STATISTICS ‘ + ‘[‘ + @tableSchema + ‘]’ + ‘.’ + ‘[‘ + @tableName + ‘]’ + ‘ WITH FULLSCAN’
PRINT @Statement — comment this print statement to prevent it from printing whenever you are ready to execute the command below.
–EXEC sp_executesql @Statement — remove the comment on the beginning of this line to run the commands
FETCH NEXT FROM updatestats INTO @tableSchema, @tableName
END
CLOSE updatestats
DEALLOCATE updatestats
GO
SET NOCOUNT OFF
GO
UPDATE STATISTICS (Transact-SQL)
https://docs.microsoft.com/en-us/sql/t-sql/statements/update-statistics-transact-sql
2.- Detecting missing indexes.
After several hours of normal activity, check to see if the SQL engine reports any missing indexes. Proper indexing drastically reduces the time and read IOPS needed to query data.
The following query returns information from the DMVs (Dynamic Management Views) related to Missing indexes, which report the list of indexes that the Query Optimizer points out as necessary in order to improve the current average workloads.
The column “improvement_measure” is an indication of the estimated improvement that will occur if the index is created. It is a unitless number and its meaning is relative to the same number for the other indexes suggested in the list.
This measure is a combination of columns avg_total_user_cost, avg_user_impact, user_seeks, and user_scans in sys.dm_db_missing_index_group_stats. This query should be executed against the user database that is being analyzed.
———————- Missing Indexes ———————————————–
DECLARE @runtime datetime
SET @runtime = GETDATE()
SELECT CONVERT (varchar, @runtime, 126) AS runtime, mig.index_group_handle, mid.index_handle,
CONVERT (decimal (28,1), migs.avg_total_user_cost * migs.avg_user_impact * (migs.user_seeks + migs.user_scans)) AS improvement_measure,
‘CREATE INDEX missing_index_’ + CONVERT (varchar, mig.index_group_handle) + ‘_’ + CONVERT (varchar, mid.index_handle)
+ ‘ ON ‘ + mid.statement
+ ‘ (‘ + ISNULL (mid.equality_columns,”)
+ CASE WHEN mid.equality_columns IS NOT NULL AND mid.inequality_columns IS NOT NULL THEN ‘,’ ELSE ” END + ISNULL (mid.inequality_columns, ”)
+ ‘)’
+ ISNULL (‘ INCLUDE (‘ + mid.included_columns + ‘)’, ”) AS create_index_statement,
migs.*, mid.database_id, mid.[object_id]
FROM sys.dm_db_missing_index_groups mig
INNER JOIN sys.dm_db_missing_index_group_stats migs ON migs.group_handle = mig.index_group_handle
INNER JOIN sys.dm_db_missing_index_details mid ON mig.index_handle = mid.index_handle
WHERE CONVERT (decimal (28,1), migs.avg_total_user_cost * migs.avg_user_impact * (migs.user_seeks + migs.user_scans)) > 10 ORDER BY migs.avg_total_user_cost * migs.avg_user_impact * (migs.user_seeks + migs.user_scans) DESC
——————————————————————
The column create_index_statement contains the CREATE INDEX sentences that you can directly execute to create the suggested index. The list is ordered by improvement_measure from highest to lowest impact. Normally we create the group of new indexes listed as having the most impact, relative to the others. You can change the “missing_index….” names for another name of your choosing.
CREATE INDEX (Transact-SQL)
https://docs.microsoft.com/en-us/sql/t-sql/statements/create-index-transact-sql
In addition, you can also leverage the SQL Database Advisor in the Azure Portal, that allows you to review and implement some recommendations for existing Databases, that can improve performance for current workloads.
SQL Database Advisor using the Azure portal
https://docs.microsoft.com/en-us/azure/sql-database/sql-database-advisor-portal
SQL Database Advisor
https://docs.microsoft.com/en-us/azure/sql-database/sql-database-advisor
To get recommendations a database needs to have about a day of usage, and there needs to be some activity. There also needs to be some consistent activity. The SQL Database Advisor can more easily optimize for consistent query patterns than it can for random spotty bursts of activity. If recommendations are not available, the Performance recommendation page should provide a message explaining why.
3.- Monitor the database behavior and top consumer queries/procedures.
You can leverage some system views and review the list of queries and/or procedures that recently have consumed the most resources (duration, CPU, reads, writes, etc).
This query should be executed against the user database that is being analyzed.
—————–Top 10 consumer queries————————————-
SELECT TOP 10
SUM(query_stats.total_elapsed_time) / SUM(query_stats.execution_count) /1000 AS “Avg Duration_ms”,
SUM(query_stats.total_worker_time) / SUM(query_stats.execution_count) /1000 AS “Avg CPU_ms”,
SUM(query_stats.total_logical_reads) / SUM(query_stats.execution_count) AS “Avg Logical Reads”,
SUM(query_stats.total_logical_writes) / SUM(query_stats.execution_count) AS “Avg Logical Writes”,
SUM(query_stats.total_physical_reads) / SUM(query_stats.execution_count) AS “Avg Physical Reads”,
SUM(query_stats.execution_count) AS “Execution Count”,
MIN(query_stats.statement_text) AS “Statement Text”
FROM
(SELECT QS.*,
SUBSTRING(ST.text, (QS.statement_start_offset/2) + 1,
((CASE statement_end_offset
WHEN -1 THEN DATALENGTH(ST.text)
ELSE QS.statement_end_offset END
– QS.statement_start_offset)/2) + 1) AS statement_text
FROM sys.dm_exec_query_stats AS QS
CROSS APPLY sys.dm_exec_sql_text(QS.sql_handle) as ST) as query_stats
GROUP BY query_stats.query_hash
ORDER BY 1 DESC;
GO
—————————————————————————-
3a.- You can leverage QDS (Query Data Store) (recommended)
Query Store is a very powerful SQL engine feature designed to deliver insight into query performance by keeping track of different plans and execution statistics for the queries executed on the server.
It is a database-scoped persistent store of query workload history collecting query text, query plan, and runtime stats in the user’s DB for later analysis.
Query Store captures the query plans but also capture the execution statistics. It captures this information by time window, allowing you to perform historical analysis even after SQL Server is restarted.
Monitoring Performance by Using the Query Store
https://docs.microsoft.com/en-us/sql/relational-databases/performance/monitoring-performance-by-using-the-query-store
Best Practices with the Query Store
https://docs.microsoft.com/en-us/sql/relational-databases/performance/best-practice-with-the-query-store
You have several ways of accessing the information.
–By directly querying the QDS views, using T-SQL:
Example:
–Top Consumers (ordered by CPU by default) with SQL TEXT and other useful info.
–You can order by a different metric and narrow the query down to last x hours or days, or a specific timeframe.
–Top Consumers (ordered by CPU by default) with SQL TEXT and other useful info.
–You can order by a different metric and narrow the query down to last x hours or days, or a specific timeframe.
SELECT TOP 10
q.query_id,
rs.count_executions as [Execution count],
rs.avg_duration/1000 as [Avg_Duration(ms)],
rs.max_duration/1000 as [Max_Duration(ms)],
rs.avg_cpu_time/1000 as [Avg_CPU_time(ms)],
rs.max_cpu_time/1000 as [Max_CPU_time(ms)],
rs.avg_logical_io_reads,
rs.avg_physical_io_reads,
rs.avg_logical_io_writes,
rs.avg_dop,
qt.query_sql_text,
qt.query_text_id, p.plan_id, GETUTCDATE() AS CurrentUTCTime,
rs.last_execution_time
FROM sys.query_store_query_text AS qt
JOIN sys.query_store_query AS q
ON qt.query_text_id = q.query_text_id
JOIN sys.query_store_plan AS p
ON q.query_id = p.query_id
JOIN sys.query_store_runtime_stats AS rs
ON p.plan_id = rs.plan_id
–WHERE rs.last_execution_time between ‘2/17/2016 13:00’ and ‘2/17/2016 14:30’
–WHERE rs.last_execution_time > DATEADD(day, -7, GETUTCDATE())
ORDER BY rs.avg_cpu_time DESC;
–By using the GUI in SQL Server Management Studio:
We always recommend to use the latest versions of SSMS; you can download and install the latest version of SQL Server Management Studio.
https://docs.microsoft.com/en-us/sql/ssms/download-sql-server-management-studio-ssms?view=sql-server-ver15
-You can use Query Performance Insight in the Azure Portal to review DTU consumption over time, and what queries are running and consuming those resources.
Azure SQL Database Query Performance Insight
https://docs.microsoft.com/en-us/azure/sql-database/sql-database-query-performance
4.- The remaining alternative is to scale the database up to a higher Service Tier / Performance Level, effectively assigning more DTUs (processing power) to it.
You can also scale up for peak usage time or specific batch or process that you know needs more resources and later scale back down when it’s finished; should you have an specific budget to comply with.
SQL Database Pricing
https://azure.microsoft.com/en-us/pricing/details/sql-database/
Furthermore, please visit the below documentation which, not only explains in detail the above suggestions, but also provides more information on how to identify possible bottlenecks such as query performance, the use of batching when inserting data, tune your application and databases.
Detectable types of query performance bottlenecks in Azure SQL Database
Types of query performance issues in Azure SQL Database – Azure SQL | Microsoft Docs
How to use batching to improve Azure SQL Database and Azure SQL Managed Instance application performance
How to use batching to improve application performance – Azure SQL
Tune applications and databases for performance in Azure SQL Database and Azure SQL Managed Instance
Performance tuning guidance for applications and databases – Azure SQL Database & Azure SQL Managed Instance
Enjoy and I hope this helps.
Diego Nieto
Sr. Technical Advisor
Azure SQL Database Support team
Acknowledgements
Gathered by the Azure SQL Database team and positive results in use case.

by Contributed | Oct 28, 2020 | Technology
This article is contributed. See the original author and article here.
Sync Up is your monthly podcast hosted by the OneDrive team taking you behind the scenes of OneDrive, shedding light on how OneDrive connects you to all your files in Microsoft 365 so you can share and work together from anywhere. You will hear from experts behind the design and development of OneDrive, as well as customers and Microsoft MVPs. Each episode will also give you news and announcements, special topics of discussion, and best practices for your OneDrive experience.
So, get your ears ready and Subscribe to Sync up podcast!
Episode 14, “Best practices for external sharing” focusses on the multiple aspects to consider regarding external sharing for your business. These considerations include establishing boundaries, industry regulations, information protection, security, shadow IT and more. This month cohosts Ankita Kirti and Jason Moore talk with Stephen Rice, Senior Program Manager, and Noorez Khamis of Creospark, and Microsoft MVP, to discuss best practices and policy examples to ensure successful and secure collaboration for your organization.
And this month’s treat is learning about the team’s favorite Halloween candies.
Meet your show hosts and guests for the episode:

Jason Moore is the principal group program manager for OneDrive and the Microsoft 365 files experience. He loves files, folders, and metadata. Twitter: @jasmo
Ankita Kirti is a product manager on the Microsoft 365 product marketing team responsible for OneDrive for Business. Twitter: @Ankita_Kirti21
Stephen Rice is a Senior Program Manager on the OneDrive team, responsible for internal and external sharing functionalities across OneDrive and SharePoint. Twitter: @srice08
Noorez Khamis is a co-founder at two companies, first VP Technology at a Microsoft 365 consulting services organization called Creospark out of Toronto, Ontario, Canada that specializes in OneDrive, SharePoint, Microsoft Teams, Integration, Knowledge & Document management and much more. Also, Rez is VP Technology at a M365 product based company called Cloudspark Labs that specializes in custom Microsoft 365 SaaS based Teams apps. Twitter: @nkhamis
Listen to the show! If you like what you hear, we’d love for you to Subscribe, Rate and Review it on iTunes or wherever you get your podcasts.
Quick links to the podcast
Links to resources mentioned in the show:
Be sure to visit our show page to hear all the episodes, access the show notes, and get bonus content. And stay connected to the OneDrive community blog where we’ll share more information per episode, guest insights, and take any questions from our listeners and OneDrive users. We, too, welcome your ideas for future episodes topics and segments. Keep the discussion going in comments below.
As you can see, we continue to evolve OneDrive as a place to access, share, and collaborate on all your files in Office 365, keeping them protected and readily accessible on all your devices, anywhere. We, at OneDrive, will shine a recurring light on the importance of you, the user. We will continue working to make OneDrive and related apps more approachable. The OneDrive team wants you to unleash your creativity. And we will do this, together, one episode at a time.
Thanks for your time reading and listening to all things OneDrive,
Ankita Kirti – OneDrive | Microsoft

by Contributed | Oct 28, 2020 | Technology
This article is contributed. See the original author and article here.
What an amazing ride! Earlier this year, Microsoft and Oculus started shipping conformant OpenXR runtimes to all customers, with SteamVR previewing OpenXR support soon after. Since then, we’ve seen wide adoption of OpenXR across the industry: from the new RenderDragon engine in Minecraft to the WebXR implementation in Edge and Chrome – from Babylon Native to Blender 2.83.
With OpenXR, you can build engines and apps that target HoloLens 2 with the same API that you use to target PC VR headsets, including Windows Mixed Reality headsets, Oculus Rift headsets and (currently in developer preview) SteamVR headsets. OpenXR lets engines write code once that’s then portable across hardware platforms from a wide range of VR and AR vendors.
 Minecraft’s new RenderDragon engine is building its desktop VR support using OpenXR!
Microsoft has been working with Unity and Epic Games to ensure the future of mixed reality is open, not just for HoloLens 2, but across the full breadth of PC VR, including HP’s new Reverb G2 headset. For more information on developing for HoloLens (1st gen), see the release notes.
To learn how you can get started with OpenXR in Unity, Unreal Engine or your own engine, read on!
OpenXR in Unity
Today, the supported Unity development path for HoloLens 2, HoloLens (1st gen) and Windows Mixed Reality headsets is Unity 2019 LTS with the existing WinRT API backend. If you’re targeting the new HP Reverb G2 controller in a Unity 2019 app, see our HP Reverb G2 input docs.
Starting with Unity 2020 LTS, Unity will ship an OpenXR backend that supports HoloLens 2 and Windows Mixed Reality headsets. This includes support for the OpenXR extensions that light up the full capabilities of HoloLens 2 and Windows Mixed Reality headsets, including hand/eye tracking, spatial anchors and HP Reverb G2 controllers. A preview version of Unity’s OpenXR package will be available later this year. MRTK-Unity support for OpenXR is currently under development in the mrtk_development branch and will be available alongside that OpenXR preview package.
Starting in Unity 2021, OpenXR will then graduate to be the only supported Unity backend for targeting HoloLens 2 and Windows Mixed Reality headsets.
OpenXR in Unreal Engine
As of Unreal Engine 4.23, full support for HoloLens 2 and Windows Mixed Reality headsets are available through the Windows Mixed Reality (WinRT) plugin.
Unreal Engine 4.23 was also the first major game engine release to ship preview support for OpenXR 1.0! Now in Unreal Engine 4.26, support for HoloLens 2, Windows Mixed Reality and other desktop VR headsets will be available through Unreal Engine’s built-in OpenXR plugin. Unreal Engine 4.26 will also ship with its first set of OpenXR extension plugins enabling hand interaction and HP Reverb G2 controller support, lighting up the full feature set of HoloLens 2 and Windows Mixed Reality headsets. Unreal Engine 4.26 is available in preview today on the Epic Games Launcher, with the official release coming later this year. MRTK-Unreal support for OpenXR will be available alongside that release as well.
OpenXR in other engines
If you’re building your own DirectX engine for HoloLens 2, Windows Mixed Reality or other PC VR headsets, we recommend using the OpenXR API. HoloLens 2 and Windows Mixed Reality will continue to support apps that target our previous WinRT APIs as well, although new features may not be available in these APIs.

by Contributed | Oct 28, 2020 | Technology
This article is contributed. See the original author and article here.
Microsoft partners like MachineSense, Thorn Technologies, and Striim deliver transact-capable offers, which allow you to purchase directly from Azure Marketplace. Learn about these offers below:
.png") |
CrystalBall: MachineSense’s CrystalBall is a specialized predictive maintenance and analytics web application for Industrial IoT. Monitor trend lines and analytics on all your machine and power components, detect machine anomalies throughout your facility, and avoid unplanned downtime with CrystalBall on Microsoft Azure.
|
 |
SFTP Gateway for Azure: Thorn Technologies’ SFTP Gateway for Azure is a secure-by-default, pre-configured SFTP server that saves uploaded files to Azure Blob Storage. SFTP Gateway for Azure features an admin web interface that lets you create users, configure their SSH key, and set a Blob Storage upload location without using the command line. |
 |
Striim ROAR: Striim Real-Time Offloading Analytics and Reporting (ROAR) for Azure PostgreSQL is an enterprise-grade streaming data integration solution that continuously ingests, processes, and delivers high volumes of streaming data from diverse sources. Quickly move data into Azure Database for PostgreSQL in a consumable form to run critical transactional and analytical workloads in Azure.
|
|

by Contributed | Oct 28, 2020 | Technology
This article is contributed. See the original author and article here.
Record Slide Show in PowerPoint for Mac – Updates coming soon!
Record Slide Show is an easy to use tool that allows you to create narrations to go along with your slides. During a time of remote meetings and learning, alternate methods of presenting are becoming more and more important in our day to day lives.
We’re excited to announce that new updates are now available on PowerPoint for Mac that allow users to record presenter video and inking during their Record Slide Show sessions. These new capabilities will enable you to create more robust recorded presentations. We hope that this feature can help simplify your presentation recording process and better engage your audience.
Here are some features that will be new in Record Slide Show on PowerPoint for Mac:
Presenter video recording
You can now record a video of yourself to go along with slides that you are presenting. Draw your audience’s attention by making it feel like you are giving the presentation live.
Use the new recording toolbar right under your camera to configure, start, pause, and stop your recording. Playback what you’ve recorded and re-record when necessary.

Presenter drawing recording
You can also now record notes taken with the pen or highlighter tool using the new annotations toolbar. Any drawing done in the recording state will be captured. When you or your audience member plays the presentation back, it will seem like you are drawing on the slides in real time.

Laser pointer recording
Similar to recording for the pen tool, you can now record your laser pointer movements while using Record Slide Show. Motion towards different portions of your slides to pull the audience’s attention.
Want to be among the first to use the new feature? Make sure you join our Office Insiders Program to get the first look at new features from Office.
Additional new PowerPoint features available today:
Record Audio
Recording audio for your PowerPoint presentation is easier than ever. Recent upgrades to PowerPoint for Mac make recording audio and inserting it into your slides simple with the new Record Audio pane.

Learn more about the experience here.
Export PPT as Animated GIF
Have you ever had an idea for an animated GIF but didn’t know where to get started? With the Export/Save As Animated GIF feature, you can create your ideas in PowerPoint! Use shapes, images, ink, animations, and transitions to create a wide variety of GIFs.


Learn more about how to use the experience here.
Link to this Slide
Have you ever been working with a colleague on a PowerPoint presentation, and wanted to send them a link to a particular slide? With the Link to this Slide feature, you can save time and avoid any confusion by creating a link that will open the file and take them directly to a specific slide in your presentation. Save your file to OneDrive, right-click on the slide you want to link to and select “Link to this Slide” to help your colleagues quickly access the location you’d like to reference.

Learn more about this feature here.
Thank you for reading! For more information on additional capabilities we have coming to PowerPoint, please see our Microsoft 365 Roadmap.

Recent Comments