by Contributed | Oct 30, 2020 | Technology
This article is contributed. See the original author and article here.
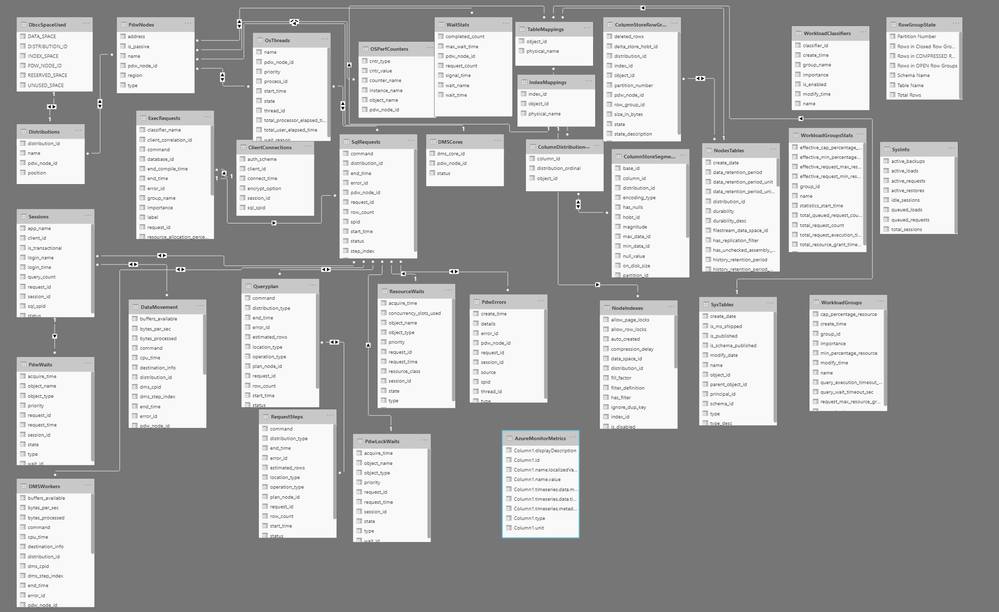
Azure Synapse Analytics SQL Pools have what is called the Dynamic Management Views(DMVs) that provide insights into the internals of Azure Synapse SQL Pools. This helps to better understand the performance bottlenecks, tune distribution and understand overall performance of the database. But it is not trivial to having a quick start even for experienced DBAs. It also adds complexity as things like request ID, session id etc needs to figured out manually. Also sometimes a more intuitive way of finding performance bottlenecks is needed in a high scale deployment. This article talks how Power BI Desktop can be used to create visual dashboards across these DMVs.
Power BI Desktop can be used to visualize the DMVs and create a more intuitive visualization and get insights inside SQL Pools. Here is a snapshot of a sample dashboard that is created on top of DMVs.

The Power BI Template is available in this github repo if you would like to take a look at it. The github repo also provides instructions on how to configure the template and create the visualization.
Hope you find this useful.

by Contributed | Oct 30, 2020 | Technology
This article is contributed. See the original author and article here.
Quick thank you to all who have been bringing news items to our team’s attention. News covered this week includes Microsoft announces Azure PowerShell 5.0, Microsoft and Intel commit to delivering next generation confidential computing, Microsoft introduces a new Defender vulnerable devices report, Azure Cloud for Healthcare is now generally available and new training resources for Microsoft Teams admins and IT Pros on MS Learn.
Microsoft Announces Azure PowerShell 5.0
Microsoft introduced a plethora of fundamental changes to Azure PowerShell in version 5.0 including:
- Updated authentication – authentication to Azure now via the Microsoft Authentication Library (MSAL) module.
- Az.KeyVault security update – plain text property SecretValueText from the cmdlets that operate on KeyVault secrets. Your scripts will now need to use SecretValue (a SecureString) instead.
- Improved support for ACR (Azure Container Registry) and AKS (Azure Kubernetes Service)
- New default behaviors for Az.KeyVault and Az.Functions
Further details can be found here: Azure PowerShell 5.0 update
Microsoft and Intel via Azure commit to delivering next generation confidential computing
Microsoft recently announced that Azure will be an early adopter of Intel’s 3rd generation Xeon® Platform which includes full memory encryption and accelerated cryptographic performance for confidential computing with Intel Software Guard Extensions (SGX).
Microsoft Azure Attestation (MAA) further improves this security posture by enabling customers to remotely attest to the authenticity of the SGX enclave at the hardware level, ensures the latest security patches are installed, and the confirms the integrity of the code running within the enclave.
Further details surrounding this security partnership can be found here: Security Partner Azure Confidential Computing
Microsoft releases a new threat and vulnerability management report
Microsoft’s newest Defender report, now in public preview, shares details on:
Device vulnerability severity levels (e.g. all the devices with critical vulnerabilities)
Device exploit availability (e.g. all the devices with vulnerabilities that have verified exploits)
Device vulnerability age (e.g. devices with vulnerabilities that were published over 90 days ago)
Vulnerable devices by operating system
Vulnerable devices by Windows 10 version
Further details can be found here: Vulnerable devices report – threat and vulnerability management
Microsoft Cloud for Healthcare is now generally available
Microsoft Cloud for Healthcare offering is aimed at healthcare organizations to make it easier for them to focus on delivering better experiences, insights, and care. Healthcare organizations can quickly access a portfolio of new tailored capabilities offered via Microsoft Azure, Microsoft 365, Microsoft Dynamics 365, Microsoft Power Platform, and Microsoft’s ecosystem of partner healthcare solutions to create trusted, end-to-end cloud-based solutions. Healthcare organizations can engage in more proactive ways with patients and give caregivers tools to improve workflow efficiency and streamline interactions.
Read the following blog post for more information on general availability: Microsoft Cloud for Healthcare is transforming the healthcare journey
MS Learn Module of the Week
New training resources for Microsoft Teams admins and IT Pros
At Microsoft Ignite last month, Microsoft introduced several new Microsoft Teams role-based learning paths, learning modules, and interactive product experiences that are available at MS Learn. These resources were created to help you get ready to deploy and manage Microsoft Teams in your organization and deliver the experiences that meet the needs of your users, we have created new Teams training courses and interactive product how-to guides designed to quickly ramp up your Teams admin knowledge base.
If you’re looking to start your learning journey or just want to browse the new Teams learning content, check out the new MS Learn landing page for Microsoft Teams.
As you know, our team appreciates your feedback and input on the Microsoft services news we share. Let us know in the comments below if there are any news items you would like to see covered in next week show. Az Update streams live every Friday so be sure to catch the next episode and join us in the live chat.
by Contributed | Oct 30, 2020 | Technology
This article is contributed. See the original author and article here.
Last month, we released updated Azure shapes in Visio for the web. Today, we are excited to announce the release of infrastructure shapes from another major cloud provider: Amazon Web Services (AWS). Included in this release are more than 400 shapes to visualize the design, deployment, and topology of IT solutions built on AWS.
Using AWS diagrams, you can redesign existing infrastructure diagrams or conceptualize your application architecture. You can also visualize the current state of your cloud environment and plan for the future. In addition, having documentation with accurate diagrams helps you tackle infrastructure issues faster.
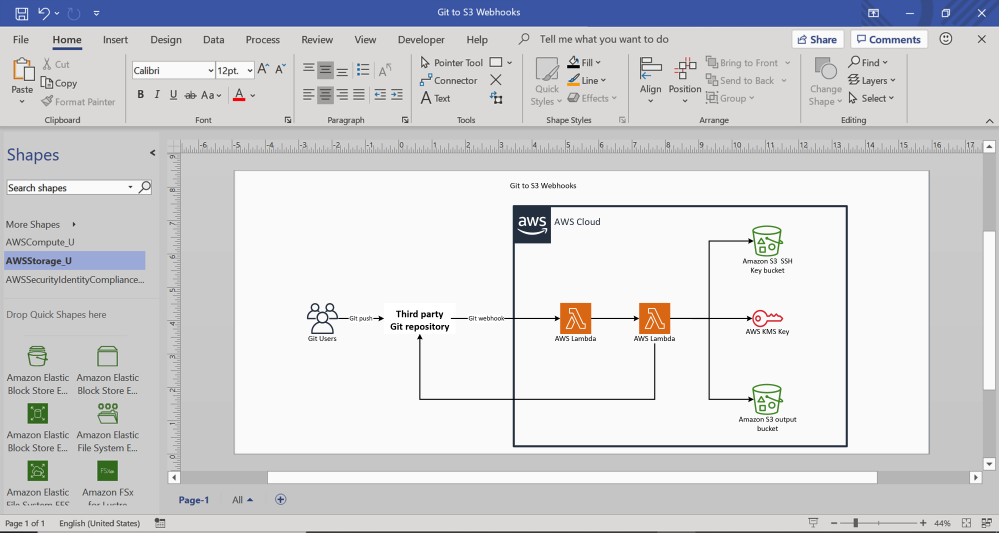
With Visio for the web, you can now build AWS diagrams for various topologies and service interactions, using familiar icons to represent those services and resources. You can also use connectors to depict relationships between ports and container shapes or AWS groups to visualize virtual private clouds (VPC), public or private subnets, availability zones, and more. For example, you can create an AWS diagram for deploying AWS Lambda functions for implementing webhooks to enable event-driven integration between Git services and AWS on the AWS cloud. This example diagram, shown below, depicts AWS services like AWS Key Management Service and AWS Lambda which are represented by standard icons or symbols, while the AWS cloud is represented using a container.

AWS diagram for Git to S3 webhooks
You can share diagrams like these with key stakeholders so that everyone is on the same page regarding execution.
We’ve added 27 AWS shape sets in all to Visio for the web, including AWS analytics, AWS application Integration, AWS AR&VR, AWS Cost Management, AWS Blockchain, AWS Business Application, AWS Compute, AWS Customer Enablement, AWS Customer Engagement, AWS Database, AWS Developer tools, AWS End user computing, AWS Game tech, AWS General, AWS containers, AWS IoT, AWS Machine Learning, AWS Management & Governance, AWS Media Services, AWS Migration & Transfer, AWS Mobile, AWS Networking & Content Delivery, AWS Quantum Technologies, AWS Robotics, AWS Satellite, AWS Security, Identity & Compliance, and AWS Storage.

To help you get started easily, we’ve provided a few starter diagrams using various AWS services. Go to the Visio web app homepage and select your preferred diagram template to quickly start visualizing your AWS infrastructure. Our support page provides even more details on how to create your AWS diagrams.

For questions about AWS templates in Visio for the web, as well as other features, please email us at tellvisio@microsoft.com. You can submit your ideas for improving the Visio web app through our UserVoice site. We also hope you’ll keep visiting the Visio Tech Community and follow us on Twitter to stay current on the latest Visio releases.
by Contributed | Oct 29, 2020 | Technology
This article is contributed. See the original author and article here.
This is the final part of my blog series on looking at performance metrics and tuning for ADF Data Flows. I collected the complete set of slides here to download. These are the previous 2 blog posts, which focused on tuning and performance for data flows with the Azure IR and sources & sinks. In this post, I’ll focus on performance profiles for data flow transformations.
Schema Modifiers
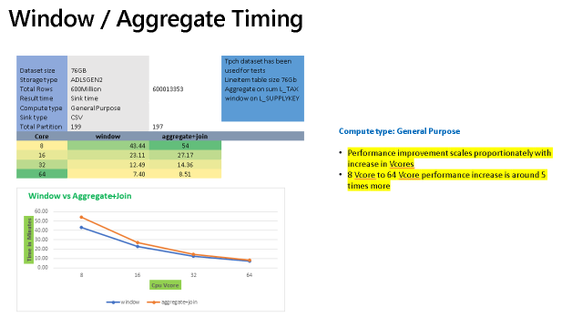
Some of the more “expensive” transformation operations in ADF will be those that require large portions of your data to be grouped together. Schema modified like the Aggregate transformation and Window transformation group data into groups or windows for analytics and aggregations that require the merging of data.

The chart above shows sample timings when using the Aggregate transformation vs. the Window transformation. In both cases, you’ll see similar performance profiles that both gain processing speed as you add more cores to the Azure IR compute settings for data flows. They will also perform better using Memory Optimized or General Purpose options since the VMs for those Spark clusters will have a higher RAM-per-core ratio.
In many situations, you may just need to generate unique keys across all source data or rank an entire data set. If you are performing those common operations in Aggregate or Windows and you are not grouping or generating windows across all of the data using functions such as rowNumber(), rank(), or denseRank(), then you will see better performance to instead use the Surrogate Key transform for unique keys and row numbers, and the Rank transformation for rank or dense rank across the entire data set.
Multiple Inputs/Outputs

The chart above shows that Joins, Lookups, and Exists can all generally scale proportionally as you add more cores to your data flow compute IRs. In many cases, you will need to use transformations that require multiple inputs such as Join, Exists, Lookup. Lookup is essentially a left outer join with a number of additional features for choosing single row or multiple row outputs. Exists is similar to a SQL exists operator that looks for the existence, or non-existence, of values in another data stream. In ADF Data Flows, you’ll see from the chart above, that lookup contains a bit more overhead than the other similar transformations.
When deduping data it is recommended to use Aggregate instead of Join and use Lookups when you need to reduce left outer joins with a single operation, choosing “Any Row” as the fastest operation.

Row Modifiers
Row modifiers like Filter, Alter Row, and Sort, have very different performance profiles. Data flows execute on Spark big data compute clusters, so it is not recommended in most cases to use Sort because it can be an expensive compute operation that can force Spark to shuffle data and reduces the benefit of a distributed data environment.
Alter Row is used to simply tag rows for different database profiles (update, insert, upsert, delete) and Filter will reduce the number of rows coming out of the transformation. Both are very low-cost transformations.
by Contributed | Oct 29, 2020 | Technology
This article is contributed. See the original author and article here.
As our team assists customers in adopting Microsoft Cloud App Security, and continues to encourage customers to leverage the best of its capabilities, we often see that a number of our customers are not aware of how simple and beneficial it can be to connect their other apps (in addition to O365 and Azure) to Cloud App Security.
To help you in that journey, we’ve compiled a short series of videos to help you with key points of integration. To begin, we start with connecting to your favorite apps. Right after connecting these apps, without any additional configuration, you will start benefiting from the threat detection policies built into Cloud App Security. Any policy that you have created (that is not explicitly targeting an app) will also apply (in alert mode only at first, with no risk of accidental governance action).
Of course, much more can be done with the addition of a few simple policies, and we are preparing more blogs on how to protect each of these apps. We have detailed below the connections for GitHub, Salesforce and Box, but there are more to come. Let us know in the comments which app you would like to see next. Stay tuned!
GitHub app connection:
Box app connection:
Salesforce app connection:
We look forward to sharing more important details with you as the weeks progress.
- The Cloud App Security CxE team
by Contributed | Oct 29, 2020 | Technology
This article is contributed. See the original author and article here.
For the recently released Azure Logic Apps (Preview) extension for Visual Studio Code, the Logic Apps team redesigned the Azure Logic Apps runtime architecture for portability and performance. This new design lets you locally build and run logic apps in Visual Studio Code and then deploy to various hosting environments such as Logic Apps Preview in Azure and Docker containers.
The redesigned Logic Apps runtime uses Azure Functions extensibility and is hosted as an extension on Azure Functions runtime, which means you can run logic apps anywhere that Azure Functions runs. You can host the Logic Apps runtime on almost any network topology that you want, choose any available compute size to handle the necessary workload that your workflow needs. Based on the resiliency that you want your app to have, you can also choose an Azure storage account type that best supports your app’s needs. For example, if you don’t need data replication for recovery or failover scenarios, you can use an LRS or ZRS storage account. If you need failover capability, you can use GRS or RA-GRS storage accounts instead. The new runtime also utilizes Azure Function’s request processing pipeline for request and webhook triggers as well as management APIs enabling you to leverage many of App Services http capabilities when deployed to Azure such as custom domains and private endpoints.
With this new approach, the Logic Apps runtime and your workflows become part of your app that you can package together. This capability lets you deploy and run your workflows by simply copying artifacts to the hosting environment and starting your app. This approach also provides a more standardized experience for building dev-ops pipelines around the workflow projects for running the required tests and validations before you deploy changes to production environments.
Azure Logic Apps on Azure Functions runtime
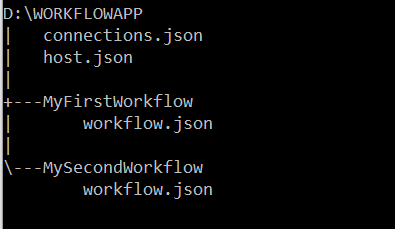
The artifacts for all the workflows in a specific workflow app are in a root project folder that contains a host configuration file, connection definition file, and one or more subfolders. Each subfolder contains the definition for a separate workflow. Here is a representation that shows the folder structure:

Workflow definition file
Each workflow in your project will have a workflow.json file in its own folder that is the entry point for your logic app’s workflow definition, which describes the workflow by using a Logic Apps domain specific language (DSL) that consists of these main parts:
- The trigger definition that describes the event that starts a workflow run.
- Action definitions that describe the subsequent sequence of steps that run when the trigger event happens.
During startup, the Azure Functions runtime loads the Logic Apps extension, which then enumerates through all folders that exist in your workflow project’s root folder and attempts to load any workflow definition (workflow.json) files before starting the Logic Apps runtime. When a workflow loads, the Logic Apps runtime performs the work that’s required to prepare for handling the events that the workflow trigger specifies, such as create an HTTP endpoint that can receive inbound requests for a workflow that starts with the Request trigger, or create an Azure Service Bus listener that receives Service Bus messages. If a workflow has syntactic or semantic errors, the workflow isn’t loaded, and the corresponding errors are output as error logs.
Connection definition file
Connectors provide quick access from Logic Apps to events, data, and actions across other apps, services, systems, protocols, and platforms. By using connectors in your logic apps, you expand the capabilities for your cloud and on-premises apps to perform tasks with the data that you create and already have. Azure Logic Apps connectors are powered by the connector infrastructure that runs in Azure. A workflow running on the new runtime can use these connectors by creating a connection, an Azure resource that provides access to these connectors. The connection definition (connections.json) file is located at the root folder of your project and contains the required configurations such as endpoint details and app settings that describe the authentication details for communicating with the connector endpoints. The Logic Apps runtime uses this information when running these connector actions.
Another capability in the redesigned Logic Apps runtime introduces is the extensibility to add built-in connectors. These built-in connectors are hosted in the same process as the Logic App runtime and provides higher throughput, low latency, and local connectivity. The connections definition file also contains the required configuration information for connecting through these built-in connectors. The preview release comes with the built-in connectors for Azure Service Bus, Azure Event Hub and SQL Server. The extensibility framework that these connectors are built on can be used to build custom connectors to any other service that you need.
Host configuration file
The host configuration (host.json) file contains runtime-specific configurations and is located in the root folder of the workflow app.
Workflow event handling
The Logic Apps runtime implements each action type in a workflow definition as a job that is run by the underlying Logic Apps job orchestration engine. For example, the HTTP action type is implemented as a job that evaluates the inputs to the HTTP action, sends the outbound request, handles the returned response, and records the result from the action.
Every workflow definition contains a sequence of actions that can be mapped to a directed acyclic graph (DAG) of jobs with various complexity. When a workflow is triggered, the Logic Apps runtime looks up the workflow definition and generates the corresponding jobs that are organized as a DAG, which Logic Apps calls a job-sequencer. Each workflow definition is compiled into a job-sequencer that orchestrates the running of jobs for that workflow definition. The job orchestration engine is a horizontally scalable distributed service that can run DAGs with large numbers of jobs.

For stateful workflows, the orchestration engine schedules the jobs in the sequencers by using Azure Storage queue messages. Behind the scenes, multiple dispatcher worker instances (job dispatchers), which can run on multiple compute nodes, monitor the Logic Apps job queues. By default, the orchestration engine is set up with a single message queue and a single partition on the configured storage account. However, the orchestration engine can also be configured with multiple job queues in multiple storage partitions. For stateless workflows, the orchestration engine keeps their states completely in memory.
A job can run one or multiple times. For example, an HTTP action job can finish after a single run, or the job might have to run several times, for example, when having to retry after getting an “HTTP 500 Internal Server Error” response. After each run, the action job’s state is saved in storage as a checkpoint, which is where the workflow’s actions inherit their “at least once” execution semantic. The job’s checkpoint state includes the action’s result along with the action’s inputs and outputs. Smaller-sized input and output values are stored inline as part of the job’s state in table storage, while larger-sized input and output values are saved in blob storage.
You can change the lifetime for a sequencer up to a 1-year maximum limit. When a sequencer reaches the end of life without finishing, the orchestration engine cancels any remaining jobs from the sequencer.
Wrapping up
The redesigned Logic Apps runtime brings new capabilities that lets you use most of your dev-ops toolbox to build and deploy logic apps, and to set up your logic apps so that they run in different compute and network configurations. The Logic Apps runtime also brings a new extensibility framework that provides more flexibility for writing custom code and building your own custom connectors.
This blog post is the first in a series that the team plans to provide so that you can get in-depth views into various aspects of the redesigned runtime. Stay tuned for more posts about logging, built-in connector extensibility, and performance bench marking.
by Contributed | Oct 29, 2020 | Technology
This article is contributed. See the original author and article here.
Final Update: Thursday, 29 October 2020 22:48 UTC
Our logs indicate the incident started on 10/29, 21:30 UTC and that during the 1 hour that it took to resolve the issue no customers experienced an issue trying to create a new workspace and receiving “internal server error” as a result.
- Root Cause: The failure was due to a DNS limit being reached in China region.
- Incident Timeline: 1 Hours & 0 minutes – 10/29, 21:30 UTC through 10/29, 22:30 UTC
We understand that customers rely on Azure Log Analytics as a critical service and apologize for any impact this incident caused.
-Jeff
Initial Update: Thursday, 29 October 2020 22:04 UTC
We are aware of issues within Log Analytics and are actively investigating. Some customers in the China region may experience an “internal server error” when trying to create a new workspace.
- Next Update: Before 10/30 00:30 UTC
We are working hard to resolve this issue and apologize for any inconvenience.
-Jeff
![[Guest Blog] A Trip to the Amazon Forest – Vision of an RD | MVP Microsoft](https://www.drware.com/wp-content/uploads/2020/10/large-1346)
by Contributed | Oct 29, 2020 | Technology
This article is contributed. See the original author and article here.
This article was written by Andre Ruschel, a Cloud and Datacenter Management MVP and Regional Director from the Brazil. He shares about an interesting Tech for Good project where his team leveraged technology in the Amazon Rainforest and help upskill people in the indigenous villages.
Today I am excited to share with you about work we’re doing within the Amazon Rainforest, bringing technology and learning to the indigenous villages.
In 2018 we held the MVP CONF event, a large conference organized by passionate Microsoft MVPs and where proceeds from sale of conference tickets are all donated to nonprofits.

We decided to donate part of this money to FAS – Amazonas Sustainable Foundation so that they could bring technology to the indigenous villages within the Amazon Rainforest to help preserve nature and culture.
The Amazonas Sustainable Foundation is a civil society organization founded in 2008, with the mission of “contributing to the environmental conservation of the Amazon through the valorization of the standing forest, its biodiversity and the improvement of the quality of life of riverside communities associated with the implementation and dissemination of knowledge about sustainable development“.
Based in Manaus (AM), it carries out environmental, social and economic projects aimed at the conservation of the Amazon Rainforest. It is a non-profit organization, without political-party ties, public utility and welfare charity.

The rainforest is responsible for something even more important: according to National Geographic, it “contributes about 20% of the oxygen produced by photosynthesis on land.” Most of this oxygen is consumed by the trees, plants and microorganisms of the Amazon itself, but it is a habitat in demand for approximately 10% of all species worldwide, including millions of insect types, fish species, among others.

Recent research has found that “disturbed” forest areas have experienced annual temperature increases of 0.44 degrees Celsius than neighboring intact forests, which “equates to approximately half of the warming seen in the region in the last 60 years”. I was particularly impressed with the Amazon Rainforest Chief as he reported his concern with the use of technology and education.
The Amazon Rainforest Chief said, “We want to have education and technology so that our family members can study and stay here to take care of the Forest”

It is very important that new technologies reach the Indians, so that they learn new ways of seeing life, where the use of the Internet is the best way to expand the areas of knowledge, both to bring indigenous culture to the world, and to bring innovations to the Indians.
The Indians, despite living in isolation from the rest of the world, are brimming with creativity and a genuine concern for quality education that many of us who live with privilege do not have. Bringing this immense creativity together with advantages in this digital age will be a turning point in helping improve villagers’ lives and enable them to learn valuable skills.

Working with the Chief and the villagers in the Amazon Rainforest was a fantastic experience and a true honor for me personally, and I recommend to everyone who visits the Amazon Rainforest to take an immersion to get an idea of the importance of preserving the Forest and its cultural practices, while infusing technology to help improve the quality of education and upskill villagers.
I leave here the invitation for everyone to come and see the largest Tropical Forest in the world, The Amazon. Please feel free to reach out to me on Twitter if this is something you might be interested to do the next time you’re in Brazil, and perhaps we can brainstorm on suitable tech solutions together!
#HumansofIT
#TechforGood
by Contributed | Oct 29, 2020 | Technology
This article is contributed. See the original author and article here.
With so many external cyber threats facing Government agencies, it can be easy to overlook risks from insiders that may have malicious objectives or that may make unintentional but serious mistakes. Digital transformation and modernization of Government agencies have enabled new efficiencies and created an exponential increase in data that is stored and processed digitally. As an agency’s data becomes increasingly digital, many of the physical security and privacy risks associated with that data become digital as well. Cyber threats from entities outside of an organization are often well-known as a result of press attention and industry threat intelligence sharing; however, cyber threats from individuals inside an organization are less well-known despite being fairly common. A study by Delloitte found that 59% of employees who leave an organization take sensitive data with them and 25% of employees have used email to exfiltrate sensitive data from an organization.
What is an insider?
Let’s start with the definition of an insider – an insider is a person working within a group or organization, often privy to information unavailable to others. The key aspect of this definition with security implications is that there is an expectation that this person will have additional direct or indirect access to information that others would not. As a result, a simple “deny access” approach that might work as an outsider strategy cannot be applied to insiders. Third parties such as contractors, subcontractors, vendors, and suppliers are also considered insiders when they receive additional access to people, devices, or information. Once an individual is authorized to access the information or system, defensive tactics move beyond the realm of simple access management into managing risk from authorized users – a realm defined by monitoring usage and behavior. Continuous monitoring is essential, but telemetry alone will not result in successful mitigation of risks from insiders. The difference between legitimate and illegitimate activity often boils down to discerning intent and context more so than assessing the legitimacy of a single isolated event.
What are the risks?
Insider risks span a broad range of possibilities including theft, data spillage, security control violations, compliance violations, espionage, sabotage, and workplace harassment or violence. Sufficiently addressing these risks requires having the right people and processes in place empowered by the right technology to glean insights and assess the possible risks at scale. Analysts and investigators need to be able to prioritize investigations based upon an incident’s full context, impact, and intent. To make meaningful assessments quickly they need to have all relevant information available at their fingertips and receive only those cases that have a sufficiently high degree of confidence.
Zero Trust
Zero Trust is a strategy that has been gaining significant momentum in the public sector. One of the key assertions of a Zero Trust strategy is that a device or user should not be considered trusted just because it is operating on a trusted internal network. The same Zero Trust approach can also be applied to insider risks, by asserting that actions taken by insiders should not be considered trusted or “safe” just because of an individual’s position within an organization. Moving beyond reliance on simple allow/deny access controls towards continuous monitoring of activities and contextual risk is a proven Zero Trust methodology that can also advance insider risk reduction efforts. The additional telemetry and context in a Zero Trust implementation provide more opportunities to detect risky activity.
Using Predictive Analytics
Predictive analytics are essential to realizing a successful continuous monitoring program that can effectively mitigate risks from insider threats at scale. Taking a reactive or “forensic-only” approach by waiting until after the impact has been discovered opens an organization up to a massive and unnecessary level of risk. In contrast, a proactive approach can provide early warnings and mitigation opportunity prior to impact. A proactive approach becomes even more effective when it is made predictive through intentional planning and optimization for the most likely insider risk scenarios.
Step 1 – Gathering Intelligence
The first step towards predictive analytics is to research and obtain high quality threat intelligence which allows for refining the objectives of the continuous monitoring program and yields a high return on investment. Insider threat intelligence is not made up of network indicators or file hashes, but rather details of common tactics and techniques used by insiders. Insights from studying previous insider cases within your own agency or from a similar agency are especially useful for harvesting priority scenarios since past behavior can be a powerful indicator of future risk. In the absence of case studies, court records can also provide valuable insights into tactics and techniques used by insiders. Third–party threat intelligence from vendors is also a significant asset that can help surface global trends or tactics at an application/workload level. Carnegie Mellon University also maintains a publicly available set of insider threat resources. The outcome of this research activity should be the prioritization of specific scenarios that can reveal optimal detections of specific tactics and techniques based upon which ones are most likely to be used within your agency and those that would have the greatest impact if left undetected. For planning purposes, these scenarios should also be separated into the two major categories of intentional threats (malicious insider) and unintentional threats (insider who makes a mistake or is compromised by social engineering), to ensure adequate coverage for each.
Step 2 – Collecting Telemetry
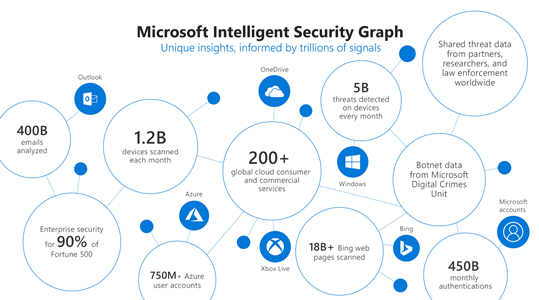
The second step is to ensure that the necessary telemetry is available to enable direct or indirect monitoring of the priority scenarios. Identifying the core priority scenarios during the first step should drive the planning done during this step to reduce cost and ensure that the data being collected is needed and once collected becomes fully utilized. At Microsoft we use telemetry from various logs, activities, entity relationships, and alerts to build the Microsoft Intelligent Security Graph that provides threat insights and informs detections in our products.

Step 3 – Targeting Detections
The third step is to implement detections for each activity in the priority insider risk scenarios using the telemetry gathered in step two. To minimize complexity and maintenance of these detections, make use of workload-specific or activity-specific detections from vendors wherever possible such as Microsoft 365 Security solutions to monitor threats and actions in productivity workloads. Achieving a breadth of detections for each activity in the chain of each scenario over time is as important as achieving high quality individual activity detections. Detections that are small in scope, testable, and explainable generally are the best.
Step 4 – Machine Learning
The fourth step is to leverage pre-built machine learning (ML) capabilities such as those in Insider Risk Management whenever possible that are already tuned for your prioritized scenarios. You can also Build-Your-Own ML with Azure Sentinel. Azure is uniquely suited for building your own cyber ML with Sentinel’s entity extraction, cloud scale query capabilities, long-term data retention, notebooks for research, and Azure’s just-in-time compute availability for model training. We have found that using machine learning models is a necessity to address insider risk challenges at scale. Successful detection of insider threats often requires much more data over a greater time period than the detection of external threats. Without machine learning, detections become too complex for maintainable rules, queries over large time periods become memory and compute intensive, and maintaining performance becomes costly. Effective ML solutions for insider risk extend beyond context correlation or anomaly detection and are trained on specific threats from priority scenarios across sequences of activities and behaviors to predict an individual’s intent. Microsoft utilizes a comprehensive ML lifecycle to constantly research, engineer, and tune many different types and combinations of models for insider risk. For large organizations it is impossible to rely on anomaly detections or event correlation alone to surface risks. Without a predictive analytics approach the number of possible cases per month can easily range from thousands to millions.

Culture and Balance
Strategies to address risks from insiders also need to be balanced appropriately such that they do not disrupt an agency’s mission, reduce worker productivity, or undermine trust in the organization. Telemetry should be pervasive but not invasive, appropriately considering both employee privacy and organizational risk. A successful program also requires collaboration across HR, legal, and privacy teams to determine how to best address the organization’s priority risk scenarios. Having a broad base of stakeholders can ensure that a positive culture is maintained in the organization and that investigations are handled in a manner that has been established with broad agreement and support.
More Information
To find out more about how Microsoft is addressing insider threats with predicative analytics read a post on Risk Management on our Microsoft AI blog or watch Microsoft CISO Bret Arsenault discuss our Insider Risk Management strategy in detail on the Microsoft Mechanics channel. You can also find out more about how to integrate additional ML detections into your investigation workflow using the capabilities of Azure Sentinel.
by Contributed | Oct 29, 2020 | Technology
This article is contributed. See the original author and article here.
By: Aasawari Navathe – Program Manager 2 | Microsoft Endpoint Manager – Intune
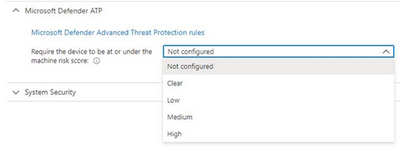
Microsoft Defender for Endpoint (formerly, Microsoft Defender ATP) risk evaluation settings for iOS compliance policies are now in Public Preview in the Microsoft Endpoint Manager admin center. We are excited to share this public preview, as several customers have been waiting for this capability. Customers can find the setting for Microsoft Defender for Endpoint when they make a new device compliance policy for iOS, where they can set devices to be marked as non-compliant if a specific machine risk score (Clear, Low, Medium, High) is not met.

App Availability
The Defender for iOS app is available in public preview via TestFlight. To install the app, end users can visit https://aka.ms/defenderios on their iOS devices. This link will open the TestFlight application on their device or prompt them to install TestFlight. On the TestFlight app, follow the onscreen instructions to install Microsoft Defender.
Connect iOS Devices to Defender
To complete the scenario, you need to make sure you have completed the proper connection for iOS devices between Microsoft Endpoint Manager and Microsoft Defender for Endpoint within your connector setup. Please note that both products must be licensed correctly for the scenario to work. To learn more, see the documentation here: Enforce compliance for Microsoft Defender ATP with Conditional Access in Intune and https://aka.ms/mdatpiosdocumentation.
Let us know if you have any additional questions on this by replying back to this post or tagging @IntuneSuppTeam out on Twitter.

Recent Comments