by Contributed | Oct 29, 2020 | Technology
This article is contributed. See the original author and article here.
Introduction
In this document we will describe a method of setting up periodic niping monitoring within an SAP infrastructure driven by the Telegraf monitoring agent, and reported via the Azure Monitor facility.
Disclaimer
We do not guarantee that documented configurations are correct or the best way to implement a function – the intention of creating this document is to describe a configuration that AGCE team has created and customers have found useful.
Overview
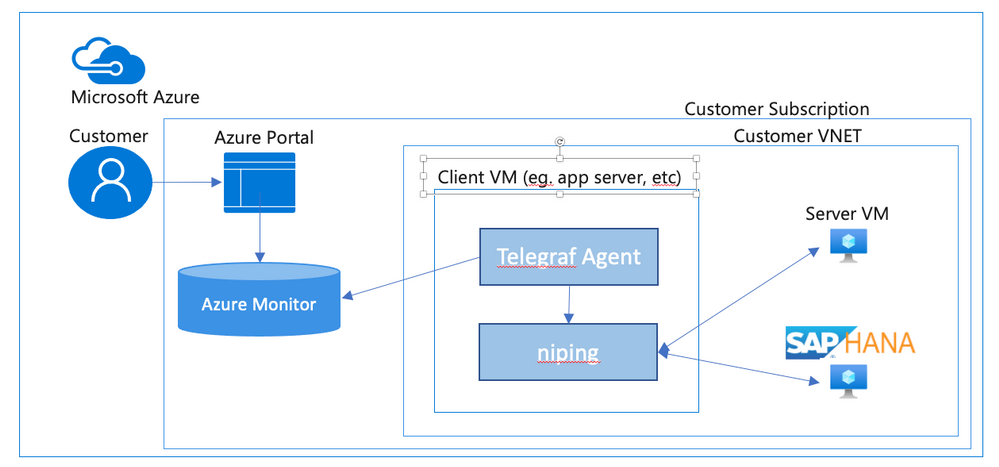
In an SAP environment it is useful to monitor various aspects of the VMs in the landscape, and to collect and alert on that monitored data. This is an example of setting up SAP niping to periodically report the inter-VM latency, specifically between the application servers and the ASCS, as well as between the application servers and the database. Here is a diagram of the configuration that we describe in this document:

SAP provides the niping application that is useful for network testing – there is a blog post describing the use of niping here. It can test latency, throughput and stability – in this document we will focus on its latency testing capability. niping is typically used for initial validation of an environment (i.e. not under any significant loading) and is not generally used continuously. However, this does provide a great example for this document, and a similar architecture can be used to monitor many other OS and SAP metrics. Please keep in mind that the measured latency between servers will vary based on the network load on the servers at the time.
In this solution we will use the InfluxData Telegraf agent described in Azure documentation. This agent runs on the monitored VMs and sends the collected data to Azure Monitor. If you don’t want to use telegraf you can collect the test data from niping and send the result to Azure monitor yourself. This would likely be done in a shell script scheduled with cron – however, this configuration won’t be described in this document.
Requirements for this configuration
This solution has the following technical requirements:
niping application from SAP for network latency testing.
telegraf monitoring agent for invoking niping and sending the data to the Azure Monitor database.
system assigned identity for the virtual machine
virtual machine must be able to make requests to the Azure API, which is “Internet facing”. This will typically require firewall access to any applicable firewalls or network appliances.
Installation & Configuration of NIPING on NIPING servers
The NIPING application is provided by SAP, as described in SAP Note 500235 Network Diagnosis with NIPING and is delivered in SAP kernel releases, as well as via SAPROUTER.
Download the latest version of the SAPROUTER SAR file, and place it onto all VMs to be tested. Use the sapcar program to unpack the SAR file, and place the niping program in a logical place. In this example, we will put all executable files in /usr/local/bin.
# ./sapcar -xf ./saprouter_710-80003478.sar

# cp niping /usr/local/bin
On all VMs that will be niping servers (i.e. the HANA database, and the ASCS), we need to create a system service that will run the niping service. Create the file /usr/lib/systemd/system/niping-server.service, with the following contents:
[Unit]                                                                                                                                                                     │

Description=SAP niping server                                                                                                                                              │

After=network.target                                                                                                                                                       │

                                                                                                                                                                           │

[Service]                                                                                                                                                                  │

Type=simple                                                                                                                                                                │

Restart=always                                                                                                                                                             │

ExecStart=/usr/local/bin/niping -s -I 0                                                                                                                                    │

ExecReload=/bin/kill -HUP $MAINPID                                                                                                                                         │

                                                                                                                                                                           │

[Install]                                                                                                                                                                  │

WantedBy=multi-user.target
Do the following commands to make the niping service start on reboot, and to start it immediately:
#systemctl enable niping-server

#systemctl start niping-server
You can now verify that the niping program is running by doing the following:
#ps -eaf | grep niping

root      49966      1  0 14:54 ?        00:00:00 /usr/local/bin/niping -s -I 0

root      49970  47606  0 14:54 pts/0    00:00:00 grep –color=auto niping
Installation of NIPING on other servers
On the other servers in the environment, simply install the NIPING program. Use the sapcar program to unpack the SAR file, and place the niping program in a logical place. In this example, we will put all executable files in /usr/local/bin.
# ./sapcar -xf ./saprouter_710-80003478.sar

# cp niping /usr/local/bin
To test the niping connectivity to one of the servers (eg. hana1), you can do the following:
# /usr/local/bin/niping -c -H hana1
Thu Oct  1 15:19:57 2020

connect to server o.k.

send and receive 10 messages (len 1000)
——- times —–

avg     0.883 ms

max     1.108 ms

min     0.725 ms

tr   2210.668 kB/s

excluding max and min:

av2     0.875 ms

tr2  2231.505 kB/s
Note for clustered instances
In Azure, we use an Azure basic or standard load balancer to provide a “floating IP” for backend instances in a cluster. When testing the niping latency, you may want to test the latency to either individual instances behind the load balancer (i.e. use the actual hostname or IP address), or use the floating ip address, which is the frontend address in the load balancer. If you want to do the latter, make sure that the load balancer has the HA Ports configuration enabled (for the Standard Load Balancer), or you have a load balancer rule for the port that niping uses (default 3298).
Creation of niping shell script
On the monitored instances, we will use a shell script to execute niping and process the output into a Comma Separated Value (CSV) format. Create a file /usr/local/bin/niping_csv.sh with the following text:
#!/bin/bash

# set -x

/usr/local/bin/niping -c -H $1 -B 10 -L 60  -D 15 | tail -n 8  | head -n 7 | grep -v excluding | awk ‘

{

    for (i=1; i<=NF; i++)  {

        a[NR,i] = $i

    }

}

NF>p { p = NF }

END {

    for(j=1; j<=p; j++) {

        str=a[1,j]

        for(i=2; i<=NR; i++){

            str=str”,”a[i,j];

        }

        print str

    }

}’ | head -n2
Then, make the shell script executable by performing chmod a+x /usr/local/bin/niping_csv.sh. You can test this by doing:
# /usr/local/bin/niping_csv.sh hana1

avg,max,min,tr,av2,tr2

1.217,5.405,0.833,16.053,1.151,16.967
This script runs niping with these parameters -c -H $1 -B 10 -L 60 -D 15, which are (in order)
-c run this as the client side of NIPING
-H $1 do niping tests against the host specified as the first parameter, we will pass this from the telegraf monitoring script
-B 10 use a 10 byte buffer size. This is appropriate for latency testing
-L 60 run 60 iterations of the test
-D 15 delay 15 milliseconds between iterations
Of course you can modify these parameters as you see fit for your testing scenario. The rest of the shell script takes the output from niping and formats it as a CSV (comma separated value) file for easy injestion into telegraf.
Installation of Telegraf monitoring agent
Before installation of telegraf, the monitored VMs must have credentials to upload data into Azure monitor. There are several ways to provide this identity (as described in the Telegraf source github repo), but the simplest way is to use the “system-assigned identity” in the VM, which we will configure next. Go to the Azure portal, view the VM, and navigate to the Identity tab, and ensure that your VM has a system-assigned identity set to On.

To install telegraf, refer to the Influxdata documentation. First install support for the go programming language. In SLES 12 SP3, you need to add the proper repo for go:
zypper addrepo https://download.opensuse.org/repositories/devel:languages:go/SLE_12_SP3/devel:languages:go.repo

zypper refresh

zypper install telegraf
Telegraf is configured via the file /etc/telegraf/telegraf.conf, which is installed with some default configurations. We are going to have a custom configuration though, that will invoke our shell script via the Telegraf “exec” input plugin. We’ll create this configuration with the following step:
telegraf –input-filter exec –output-filter azure_monitor config > azm-telegraf.conf
Then open the azm-telegraf.conf with your editor, and find the section starting with
###

#                            INPUT PLUGINS                                    #

###
Replace the text, starting with [[inputs.exec]] to the end of the file with the following:
[[inputs.exec]]

  commands = [

    “/usr/local/bin/niping_csv.sh hana1”

  ]
  timeout = “5s”

  name_suffix = “_niping_hana”

  data_format = “csv”

  csv_header_row_count = 1
Of course, replace “hana1” with the name or IP address of the server you are testing the latency to. You can find more information on the exec input handler in the telegraf documentation.
You can test this by running the following:
# telegraf –config ./azm-telegraf.conf –test

2020-10-02T00:47:26Z I! Starting Telegraf

> exec_niping_hana,host=pas av2=0.958,avg=0.961,max=1.315,min=0.776,tr=20.328,tr2=20.39 1601599648000000000
Copy and activate the telegraf.conf file to the configuration directory:
# sudo cp azm-telegraf.conf /etc/telegraf/telegraf.conf

# systemctl restart telegraf
At this point, telegraph should be regularly executing the niping program, converting its output to CSV, and uploading the resulting data to Azure Monitor. Check the /var/log/messages file to see if there are any errors, using grep telegraf /var/log/messages.
Configuration of the telegraf agent is via the /etc/telegraf/telegraf.conf file. Looking at that file, you should see something like this near the beginning:
[agent]

  ## Default data collection interval for all inputs

  interval = “10s”
This sets the telegraf agent to run every 10 seconds, and it will run the above shell script and niping every 10 seconds as well. You can adjust this interval within practical limits. More configuration options are documented in the telegraf github repo.
Plot your niping data in the Azure portal
Open the Azure Portal, and navigate to the Monitor tab, then select Metrics, and select the VM you installed telegraf on in the resource selector.

Select the Telegraf/execnipinghana namespace, and select the av2 metric.

Additional monitoring configuration
You can have multiple [[inputs.exec]] sections in the telegraf.conf file if you want to test niping against multiple servers (i.e. the database and the ASCS). You can also configure the niping to test latency through the floating IP/load balancer front end IP address for clustered instances if you would like to, as described in the note for clustered instances above.
There are also over 150 input plugins available in the Telegraf agent that you can find in the InfluxData list of supported plugins, and creative use of the exec plugin (as we’ve used above) can monitor virtually anything on the VM.
You can create alerts on the data you are collecting. For example, you could create an alert that fires whenever the average of the av2 metric goes over a certain value, using a rolling 5 minute average evaluated once per minute.

by Contributed | Oct 29, 2020 | Technology
This article is contributed. See the original author and article here.

Hi IT Pros,
I would like to continue the blog about Microsoft Defender for Identity with topic related to the daily operation of SecOp Team who traces all attacks against Identities stored in your on-prem Active Directory domain controllers.
Please review and give your feedback.
In Cyber Environment, where is an estimation of 81% breaches originated from compromised identities. Then, protecting the privileged accounts and monitoring their activities within Active Directory perimeter is of utmost importance.
The Microsoft Defender for Identity (Azure Advanced Threat Protection) service could serve for that main purpose and should be part of the Corporate ‘s defender strategy.
Daily operation of Microsoft Defender for Identity is key to identify the identity breaches and identity attacks.
Microsoft Defender for Identity Information integrated with Cloud App Security (CAS) service.
By default MD for Identity is integrated with CAS, account timeline, account activity, assessment information is displayed in Cloud App Security portal under the first column menu items named Dashboard, Investigation, Control and Alert.
The recommendation for CAS portal use includes the following:
- When using Microsoft Defender for Identity service together with Cloud app security service, closing alerts in one service will not automatically close them in the other service. You need to decide where to manage and remediate alerts to avoid duplicated efforts.
- Microsoft Defender for Identity alerts are displayed within the Cloud App Security Alerts queue. To view, filter alert by app: “Active Directory” as shown:

- Alert could be dismissed or resolved as “unread” as “adjust policy.”

A “Resolve” with action of adjusting policy and make change to policy:

- You could filter alerts by policy, there are about 72 built-in policies plus your custom policies. The identity policies or AD related policies are included in the following table:
Policy Name
|
Policy Description
|
Suspicious additions to sensitive groups
|
Attackers add users to highly privileged groups.
|
Suspected skeleton key attack (encryption downgrade)
|
Encryption downgrade is a method of weakening Kerberos so password hash could be obtained by hackers.
|
Suspected brute force attack (LDAP)
|
In a brute-force attack, an attacker attempts to authenticate with many different passwords for different accounts until a correct password is found.
|
Suspected brute force attack (Kerberos, NTLM)
|
Same as above
|
Network mapping reconnaissance (DNS)
|
Collect DNS server data which contains a map of all the computers, IP addresses, and services on your network.
|
Suspicious communication over DNS
|
Attackers on an effected computer may abuse the DNS protocol, which is often less monitored and is rarely blocked,
|
Unusual administrative activity (by user)
|
users perform multiple administrative activities in a single session with respect to the baseline learned,
|
Activity was performed by a terminated user.
|
A terminated user performs an activity in a sanctioned corporate application.
|
Impossible travel
|
activities are detected by the same user in different locations within a time period.
|
Activity from an infrequent country
|
activity is detected from a location that was not recently or never visited by the user or by any user in the organization.
|
Activity from anonymous IP addresses
|
identifies activity from an IP address that has been identified as an anonymous proxy IP address and it may be used for malicious intent.
|
Unusual, impersonated activity (by user)
|
users perform multiple impersonated activities in a single session with respect to the baseline learned,
|
Unusual file deletion activity (by user)
|
users perform multiple file deletion activities in a single session with respect to the baseline learned,
|
Multiple failed login attempts
|
users perform multiple failed login activities in a single session with respect to the baseline learned,
|
Multiple storage deletion activities
|
users perform multiple storage deletion or DB deletion activities in a single session with respect to the baseline learned.
|
Risky sign-in
|
Azure Active Directory (Azure AD) detects suspicious actions that are related to user accounts.
|
Suspected DC Shadow attack (domain controller promotion)
|
Attackers create a rogue DC and make AD replication it.
|
Suspected identity theft (pass-the-ticket)
|
lateral movement technique in which attackers steal a Kerberos ticket from one computer and use it to gain access to another computer.
|
Cloud App Security Dashboard – Investigation Priority Score for Users:
- CAS dashboard shows top users who need to be investigated.
- Evaluated data come from Microsoft Defender for Identity , Microsoft Cloud App Security as well as Azure AD Identity Protection
- Score points are based on security alerts, risky activities, and potential business and asset impact related to each user.
- Calculation is done over a period of 7 days.

Recommended investigation steps for suspicious users
- Choose the “Top users to investigate”.

Microsoft Defender for Identity alert evidence and lateral movement paths provide clear indications when users have performed suspicious activities or indications exist that their account has been compromised.
We need to take the following actions:
- Gather information about the user.
- Investigate activities that the user performed.
- Investigate resources the user accessed.
- Investigate lateral movement paths.
- Who is the user and what are the multiple accounts been used?


- Is the user a sensitive user (such as admin, or on a watchlist, etc.)?
- What is their role within the organization?
- Are they significant in the organizational tree?
II. Suspicious User’s activities to investigate:
- Does the user have other opened alerts in Microsoft Defender for Identity, or in other security tools such as Windows Defender-ATP, Azure Security Center and/or Microsoft CAS?
The alerts could be filtered and viewed by one or multiple categories included:
– Access control,
– Cloud Discovery (Reconnaissance),
– Compliance, Configuration control,
– DLP (Data Lost Prevention),
– Privileged accounts,
– Sharing control,
– Threat detection.

2. What is the activities done by this User?
In activities, you could choose the following queries for investigation: Admin activities, Domain activities, Failed log in, File and folder activities, Impersonation activities, Mailbox activities, Password changes and reset requests, Security risk, Sharing activities, Successfully log in, your saved custom query

3. Did the user have multiple failed logon attempts in a brief period?
4. Which resources did the User access to?

5. Did the user access high value resources?
6. Was the user supposed to access the resources they accessed?
7. Which computers did the user log in to?
8. Was the user supposed to log in to those computers?

9. Is there a lateral movement path (LMP) between the user and a sensitive user?
LMP-Impersonate privilege account.

LMP-Suspicious group membership has been changed.
Click on each timeline 1, 2, 3 below to get the group names of which new membership is added.

New groupmembership detail

10. View all other alerts about the related User by click on link “view all User alerts”.

All Alerts related to the User.

Example: alert on Tor IP address being used
(Tor directs Internet traffic through a free, worldwide, volunteer overlay network consisting of more than seven thousand relays to conceal a user’s location and usage from anyone conducting network surveillance or traffic analysis.)

To get all Tor IP, anonymous IP address connection in Alert by using policy filter named “Activity from anonymous IP address.”
Click on each item to get the details.

The details shown the answer to the following questions:
- What are the Tor IP addresses been used?
- Who is the User involved?
- What are the File names been uploaded downloaded to Tor IP address?


You could do more search by clicking on the following icons:

Example: alert on mass deletion of files:

Example: alert on skeleton attack by downgrading encryption method on multiple admin accounts.
(the “Skeleton Key” attack is capable of “unlocking” and providing privileged access to every single employee account within the enterprise. The powerful malware strain allows cybercriminals to bypass Active Directory (AD) systems that only implement single factor authentication.)
In the alert page, the accounts marked with “red tie” icons are internal admin.


Microsoft Defender for Identity identity security posture:
- Identify misconfigurations and legacy components which represent one of the greatest threat risks to organization.
- Provide links to documents for remediation and preventive action.
Identity security posture assessment of credentials exposed in clear text, legacy protocol usage, weak cipher usage, unsecure Kerberos delegation, DC with spooler service, sensitive group, rogue DCs, LAPS (Local Administrator Password Solution to be randomized and stored in AD) usage, risky lateral movement paths, unsecure SID history attributes, unsecure account attribute.
Click on any row item marked as “open” to view the posture detail and follow link to the remediated document.

Click on the link to view Microsoft document about the posture and remediation information and then, make a plan for remediation action.

Once you have the remediation solution implemented successfully, Microsoft Defender for Identity portal will automatically mark the related item as “completed” as shown:

Alerts in Microsoft Defender for Identity’s portal
- Microsoft Defender for Identity security alerts explain the suspicious activities detected within your on-premises network by the sensors installed on domain controllers, and the actors and computers involved in each threat.
- Alert evidence lists contain direct links to users and computers.
- Microsoft Defender for Identity security alerts are divided into the following phases:

Click on the alert item to view detail and decide to close, suppress, exclude DC or delete alert.
- Suppress: Suppressing an activity means you want to ignore it for now, and only be alerted again if there is a new instance.
If there is a newly similar event after seven days, you will be alerted again.
- Reopen: You can reopen a closed or suppressed alert.
- Delete: Alert is deleted from the instance and you will NOT be able to restore it. After you click delete, you will be able to delete all security alerts of the same type.

A closed alert could be reopened as shown:

I hope the information presented in this blog post is useful to your Microsoft Defender for Identity daily operation.
Reference:
AATP alert, Cloud App Security alert
End of mainstream support for Azure ATA
Verizon data breach report
– https://www.securelink.com/blog/81-hacking-related-breaches-leverage-compromised- credentials/
Video
https://www.bing.com/videos/search?q=azure+atp+security+posture+video&docid=608000595825135201&mid=6B5FFF76CDCD98F8963F6B5FFF76CDCD98F8963F&view=detail&FORM=VIRE
by Contributed | Oct 29, 2020 | Technology
This article is contributed. See the original author and article here.
Initial Update: Thursday, 29 October 2020 17:06 UTC
We are aware of issues within Application Insights as of 2020-10-29 16:45 UTC and are actively investigating. Application Insights customers ingesting telemetry in East US 2 may experience intermittent data latency, data gaps and incorrect alert activation.
- Work Around: NA
- Next Update: Before 10/29 19:30 UTC
We are working hard to resolve this issue and apologize for any inconvenience.
-Arish B
by Contributed | Oct 29, 2020 | Technology
This article is contributed. See the original author and article here.
In response to the unique and evolving requirements of the United States government and regulated industries we’ve built Office 365 Government offerings for customers handling controlled unclassified information (CUI) on behalf of the US Government. Office 365 Government (GCC and GCC High) are designed to support US government entities and those working with the US government to meet specific compliance and cybersecurity requirements. We’re excited to announce that our Office 365 Government GCC environment now has a FedRamp High SAR (security assessment report). More on the history of the Office 365 Government cloud offerings can be found here.
Government regulations are not static. As the world of data security and compliance evolves, so too does our need to support governments and regulated industries with solutions to protect and manage their data. As part of our journey to support US government and regulated industries we will continue to evolve our Office 365 Government cloud offerings with new compliance value to help customers achieve their compliance commitments. All regulated businesses have varying needs when it comes to storing, processing, and transmitting CUI. As part of our commitment to data security and compliance, we will continue to bring innovative products such as Teams, Office Apps, Security, and Compliance to our government clouds with the strict controls required to ensure all products meet FedRAMP High control requirements. We will continue to bring more compliance value to GCC including DFARs support and CMMC accreditation in the near future. Government contractors and all regulated businesses that require US government compliance for CUI, will continue to have access to comprehensive, secure, and compliant SaaS offerings, giving them a holistic tool set to create a compliant environment.
We’re excited for the evolution of the GCC environment and we see this offering being an integral part of a defense contractors journey to meet their CMMC obligations while still being able to address government and internal guidance commitments to CUI. This ongoing journey is going to help government customers and their industry partners choose and select the right environment for them based on their CUI and compliance needs.
by Contributed | Oct 29, 2020 | Technology
This article is contributed. See the original author and article here.
One of the unique things about Postgres is that it is highly programmable via PL/pgSQL and extensions. Postgres is so programmable that I often think of Postgres as a computing platform rather than just a database (or a distributed computing platform—with Citus). As a computing platform, I always felt that Postgres should be able to take actions in an automated way. That is why I created the open source pg_cron extension back in 2016 to run periodic jobs in Postgres—and why I continue to maintain pg_cron now that I work on the Postgres team at Microsoft.
Using pg_cron, you can schedule Postgres queries to run periodically, according to the familiar cron syntax. Some typical examples:
-- vacuum my table every night at 3am (GMT)
SELECT cron.schedule('0 3 * * *', 'VACUUM my_table');
-- call a procedure every minute
SELECT cron.schedule('process-new-events', '* * * * *', 'CALL process_new_events()');
-- upgrade an extension when PostgreSQL restarts
SELECT cron.schedule('upgrade-pgcron', '@reboot', 'ALTER EXTENSION pg_cron UPDATE');
-- Delete old data on Saturday at 1:30am (GMT)
SELECT cron.schedule('delete-old-events','30 1 * * 6', $$DELETE FROM events WHERE event_time < now() - interval '1 week'$$);
Since its initial release, pg_cron has become a standard tool in the arsenal for many of you who use PostgreSQL. You can find the pg_cron extension on GitHub—it’s open source, and it’s easy to install and set up. And pg_cron is also included in managed Postgres database services such as the Hyperscale (Citus) and Flexible Server options in Azure Database for PostgreSQL.
The popularity of pg_cron has also created demand for more advanced features, such as an audit log, the ability to update cron job schedules, and for other ways to run pg_cron in cloud database services.
Recently, the RDS team at Amazon reached out to us to see if would accept contributions to pg_cron to enable pg_cron in RDS. And our answer was: Of course! Hence the is the result of a collaboration between Microsoft (job names, reviews, bug fixes) and Amazon (audit log, background workers), with a little help from Zalando (PostgreSQL 13 support).
Audit log lets you see your running cron jobs, as well as past job runs
Pg_cron logs the outcome of jobs in the PostgreSQL log, but the log is not always easy to access for database users. Thanks to an awesome contribution by Bertrand Drouvot and Nathan Bossart from the Amazon RDS team, you can now also see a log of your pg_cron jobs in the database in a table called cron.job_run_details.
The cron.job_run_details table shows:
- when a command started and finished,
- whether the pg_cron command succeeded, and
- the number of rows returned—or the error message to quickly detect when something went wrong
-- update my rollup tables every minute
SELECT cron.schedule('update rollups', '* * * * *', 'SELECT update_rollup_tables()');
-- after a while
SELECT * FROM cron.job_run_details;
┌───────┬───────┬─────────┬──────────┬──────────┬───────────────────────────────┬───────────┬────────────────────────────────────────────┬───────────────────────────────┬───────────────────────────────┐
│ jobid │ runid │ job_pid │  database │ username │             command           │  status    │               return_message               │           start_time          │            end_time           │
├───────┼───────┼─────────┼──────────┼──────────┼───────────────────────────────┼───────────┼────────────────────────────────────────────┼───────────────────────────────┼───────────────────────────────┤
│     2 │    13 │    1022 │ postgres │    marco │ SELECT update_rollup_tables()  │ succeeded │ 1 row                                      │ 2020-10-28 12:18:00.059566+02   │ 2020-10-09 12:18:01.734262+02  |
│     2 │     1 │     986 │ postgres │    marco │ SELECT update_rollup_tables()  │ succeeded │ 1 row                                      │ 2020-10-28 12:19:00.029769+02   │ 2020-10-09 12:09:01.345637+02  |
│     1 │    14 │    1023 │ postgres │    marco │ VACUUM my_table               │ failed    │ ERROR: relation "my_table" does not exist    │ 2020-10-28 12:19:00.079291+02   │ 2020-10-28 12:19:00.080133+02  |
└───────┴───────┴─────────┴──────────┴──────────┴───────────────────────────────┴───────────┴────────────────────────────────────────────┴───────────────────────────────┴───────────────────────────────┘
(3 rows)
The audit log is not automatically cleaned up, but … we have pg_cron! That means you can easily decide on your own retention policy and use pg_cron to schedule a job that cleans up the audit log:
-- at midnight, delete all audit log entries older than 14 days
SELECT cron.schedule('clean audit log', '0 0 * * *', $$DELETE FROM cron.job_run_details WHERE end_time < now() – interval ’14 days’$$);
In implementing the audit log in pg_cron, we used the row-level security feature in Postgres to make sure that database users can only see and delete their own audit log entries.
Using background workers avoids connection configuration
Pg_cron normally executes commands by either connecting to localhost or the unix domain socket (configurable using the `cron.host` setting). Both connection options are secure but do require some changes to pg_hba.conf to enable, and which change you need to make depends on which Linux distribution you are using.
Thanks to another contribution by Bertrand and Nathan, you can choose to use dynamic background workers instead of connections by setting cron.use_background_workers = on in postgresql.conf. That way, you do not need any pg_hba.conf changes.
A slight downside of background workers is that the number of concurrent jobs is limited to max_worker_processes (8 by default). The standard way of connecting to localhost is only limited to max_connections (which is 100 by default, usually higher). We recommend increasing max_worker_processes when using background workers.
Job names simplify pg_cron job management
If you are already familiar with pg_cron, you may have noticed that the examples above now includes a job name as the first argument to the cron.schedule(..) function. The ability to give your pg_cron jobs a name is also a new feature in pg_cron 1.3, by yours truly.
When you use a job name, cron.schedule does an upsert rather than an insert, which means you idempotently set your schedule and your command.
For instance, if I name my pg_cron job nightly vacuum then I can easily change the schedule:
-- set up a nightly vacuum at 1am with a job name
select cron.schedule('nightly vacuum', '0 1 * * *', 'vacuum my_table');
┌──────────┐
│ schedule │
├──────────┤
│        4 │
└──────────┘
(1 row)

-- I can now see the nightly vacuum job in the cron.job.table
table cron.job;
┌───────┬───────────┬─────────────────┬───────────┬──────────┬──────────┬──────────┬────────┬────────────────┐
│ jobid │  schedule │     command     │  nodename │ nodeport │  database │ username │ active │    jobname     │
├───────┼───────────┼─────────────────┼───────────┼──────────┼──────────┼──────────┼────────┼────────────────┤
│     4 │  0 1 * * * │ vacuum my_table │ localhost │   5432   │ postgres │  marco   │      t │ nightly vacuum │
└───────┴───────────┴─────────────────┴───────────┴──────────┴──────────┴──────────┴────────┴────────────────┘
(1 row)

-- change the schedule to 3am by using the same job name
select cron.schedule('nightly vacuum', '0 3 * * *', 'vacuum my_table');
┌──────────┐
│ schedule │
├──────────┤
│        4 │
└──────────┘
(1 row)

-- I can see the new schedule in the cron.job table
table cron.job;
┌───────┬───────────┬─────────────────┬───────────┬──────────┬──────────┬──────────┬────────┬────────────────┐
│ jobid │  schedule │     command     │  nodename │ nodeport │  database │ username │ active │    jobname     │
├───────┼───────────┼─────────────────┼───────────┼──────────┼──────────┼──────────┼────────┼────────────────┤
│     4 │  0 3 * * * │ vacuum my_table │ localhost │     5432 │ postgres │ marco    │      t │ nightly vacuum │
└───────┴───────────┴─────────────────┴───────────┴──────────┴──────────┴──────────┴────────┴────────────────┘
(1 row)
Using a job name also makes it easy to ensure a specific set of jobs is running, without having to check whether the job already exists.
PostgreSQL 13 support is available for pg_cron
Finally, PostgreSQL 13 is out! Of course, the new pg_cron 1.3 release supports (and all PostgreSQL versions since 9.5). Big thanks to Alexander Kukushkin from Zalando for updating pg_cron to support Postgres 13.
Packages for pg_cron 1.3 are available via PGDG for Red Hat/CentOS and Debian/Ubuntu.
Better together: Improving PostgreSQL across competitive boundaries
One of the exciting parts of being on the Postgres team at Microsoft is that Microsoft has embraced open source. What that means in practice is that we are making significant contributions to PostgreSQL via our team of PostgreSQL committers and contributors (including engineers Andres Freund, David Rowley, Dimitri Fontaine, Jeff Davis, and Thomas Munro). In addition, we have created and maintain some pretty useful open source extensions to Postgres such as Citus, pg_auto_failover, and of course pg_cron. When we open source our software, competitors might benefit from our work, but the more important point is all PostgreSQL users (including our customers) benefit!
I find pg_cron to be super useful. And some have gone so far to say that it’s “really cool” to have the scheduler within the database, and tied to the data itself. We’re happy to see that pg_cron has gotten significant contributions from Amazon and look forward to seeing one great PostgreSQL job scheduler across Azure Database for PostgreSQL, RDS, and other Postgres cloud database services.
by Contributed | Oct 29, 2020 | Technology
This article is contributed. See the original author and article here.
Here is your next installment in the troubleshooting hybrid migrations blog series! See:
There are 2 main flavors of “completed with warnings” scenarios when onboarding mailboxes from Exchange on-premises to Exchange Online. While these warnings can happen in offboarding scenarios, that is rarer than seeing them during onboarding. We gathered some examples for onboarding migrations and will discuss these here.
The migration batch / move requests will typically have a status of “CompletedWithWarning” and you might see a warning similar to the following in the Exchange Admin Center Migration pane:
Warning: Unable to update Active Directory information for the source mailbox at the end of the move. Error details: An error occurred while updating a user object after the move operation.
As mentioned several times by now in this blog series, to dig deeper into the details of the move, you would get move request statistics for the affected user with IncludeMoveReport switch, from Exchange Online PowerShell and then import it and store it in a variable:
Get-MoveRequestStatistics <user> -IncludeMoveReport | export-clixml C:tempEXO_MoveReqStats.xml
Issues you’d see on-premises
If we fail to convert the source mailbox into a remote mailbox (fail to cleanup things on source after mailbox has been moved to the cloud), as result of this failure we may end up with 2 mailboxes for the same user (one on-premises and a migrated one in the cloud.)
Example from $stats.Report.Entries:
Failed to convert the source mailbox ‘contoso.onmicrosoft.com4019d389-dcc6-4a77-a19c-e49408e7a160 (Primary)’ to mail-enabled user after the move. Attempt 17/480. Error: CommunicationErrorTransientException.
31.08.2020 11:47:42 [AM5PR0102MB2770] Post-move cleanup failed. The operation will try again in 30 seconds (18/480)
If the source AD user is not correctly updated into a remote mailbox during an onboarding move to Office 365, you would need to follow this KB article to manually disable the mailbox on-premises and convert it into a remote mailbox.
Depending on the time period the two mailboxes coexisted (which results in content being different in these two since migration completed) you would eventually need to restore the content of the disconnected mailbox on-premises to the migrated cloud mailbox (for restore cmdlet see Step 1.7 from this article). Another option is to export it to PST before disabling it and importing the PST into the target mailbox using the Outlook client or using the Office 365 PST Import Service.
Issues you’d see in Exchange Online
It can happen that a database failover occurs in the completion phase of the migration while unlocking the target mailbox in Office 365 (this is a rare case and we have an automatic task that ensures the mailbox is unlocked and would allow us to access the target mailbox.) If this happens, we expect the source mailbox to be converted successfully into a remote mailbox.
A more common scenario in Office 365 would be when there were transient failures with a specific Domain Controller (DC) in Exchange Online but where another DC took over the migration job and the move request was completed successfully.
For this scenario, in the move report entries $stats.report.Entries | % {[string] $_} in PowerShell, or in the Migration User Status Report in Exchange Admin Center, you should check if:
- Target mailbox is updated successfully on a different DC than the DC mentioned in the failure.(AM4PR02A008DC01 unavailable vs AM4PR02A008DC05 which took over, in example below)
- Source mailbox was converted into a mail user with success using on-premises DC; see the line that says “The mailbox was converted into a mail user using domain controller ‘DC6.contoso.com’” in the example
- The move request is complete (“Request is complete”).
All these conclude a successful completion of the move request, even if we had a temporary DC failure during the move.
The ‘good’ example (things worked out well):
10.03.2020 14:24:19 [DB7PR02MB4379] The following failure occurred after the Active Directory modification completed: The domain controller ‘AM4PR02A008DC01.EURPR02A008.PROD.OUTLOOK.COM’ is not available for use at the moment. Please try again..
10.03.2020 14:24:19 [DB7PR02MB4379] An error caused a change in the current set of domain controllers.
10.03.2020 14:24:20 [DB7PR02MB4379] Target mailbox ‘John Smith/ Contoso Org’ was updated on domain controller ‘AM4PR02A008DC05.EURPR02A008.PROD.OUTLOOK.COM’.
10.03.2020 14:24:20 [MAILSRV-EX15] The mailbox was converted into a mail user using domain controller ‘DC6.contoso.com’.19.09.2018 14:24:20 [DB7PR02MB4379] Source mail user ‘John Smith/ Contoso Org’ was updated on domain controller ‘DC6.contoso.com’.
10.03.2020 14:24:21 [DB7PR02MB4379] Target mailbox ‘contoso.onmicrosoft.com39026949-29d0-4f9b-a84d-3c52c8b28b39 (Primary)’ was successfully reset after the move.
10.03.2020 14:25:18 [DB7PR02MB4379] Request is complete.
Other than situations mentioned above, you should check the following things when you have an onboarding move request completed with warnings:
- The mailbox can be accessed least from OWA client for the onboarded user (https://outlook.office365.com/owa) and the migrated content is there.
- Test-MapiConnectivity in Exchange Online PowerShell against that mailbox is OK.
- The user is a Remote Mailbox in on-premises: Get-RemoteMailbox <user>
This concludes the entire blog post series. Hoping that you’ve found this useful. I am here to answer your further questions!
I would like to thank Angus Leeming, William Rall, Brad Hughes, Chris Boonham, Ben Winzenz, Cristian Dimofte, Nicu Simion, Nino Bilic and Timothy Heeney for their precious help on this blog and for dealing with me in my daily support life.
Mirela Buruiana
by Contributed | Oct 29, 2020 | Technology
This article is contributed. See the original author and article here.
Now in preview, the Auditing of Microsoft support operations is a free capability that enable you to audit Microsoft support operations when they need to access to your Azure SQL Databases during a support request to your audit logs destination.
The use of this capability, along with your auditing, enables more transparency into your workforce and allows for anomaly detection, trend visualization, and data loss prevention. We currently support Log Analytics and Event Hub and are working to support storage accounts soon.
How to enable Auditing of Microsoft support operations
Auditing of Microsoft support operations can be enabled for new and existing Azure SQL Database and Managed Instance. Once enabled, logs will flow to your configured audit logs destination.
Portal
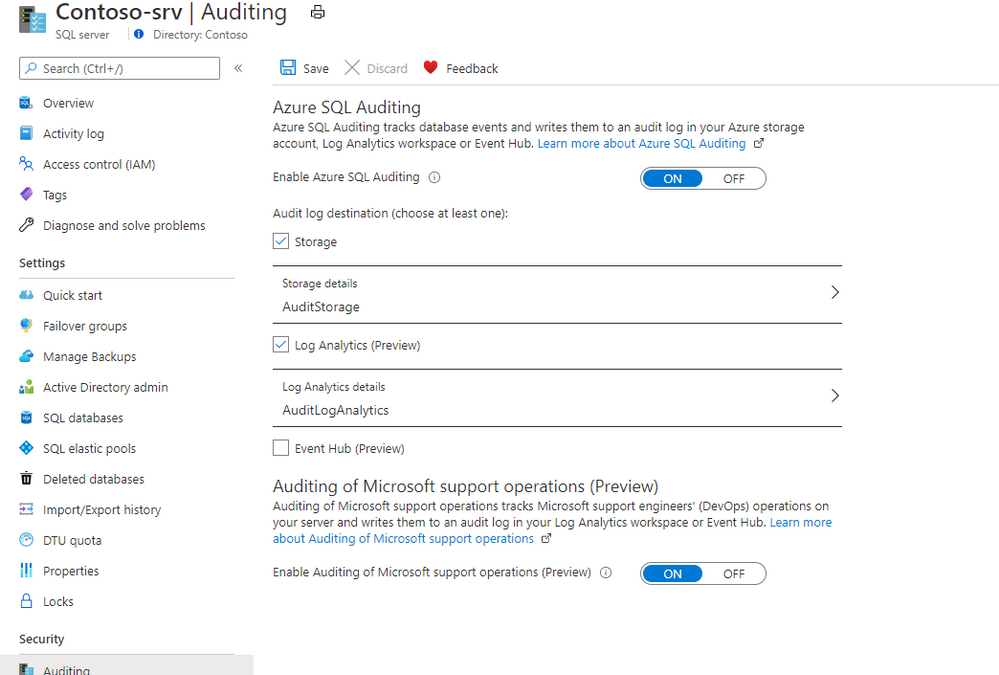
To enable Microsoft DevOps Auditing via the Azure portal for Azure SQL Database:
- Open your Azure SQL Server where your Azure SQL Databases are deployed
- Navigate to Auditing under Security
- Configure a Log Analytics workspace or an Event Hub destination
- Enable Auditing of Microsoft support operations (Preview)

Storage account destination will be added over time. Visit the documentation for up to date information on Auditing of Microsoft support operations.
Please visit the pricing pages of Log Analytics and Event Hub for pricing details for this configuration.

by Contributed | Oct 29, 2020 | Uncategorized
This article is contributed. See the original author and article here.
For some time now, business leaders have made digital transformation a priority. But when the pandemic hit this spring, adopting and embracing digital technology went from being a matter of importance to one of sheer survival. COVID-19 has catapulted us into the era of digital everything. And to keep up with the pace of change,…
The post Power your digital transformation with insights from Microsoft Productivity Score appeared first on Microsoft 365 Blog.
Brought to you by Dr. Ware, Microsoft Office 365 Silver Partner, Charleston SC.
by Contributed | Oct 29, 2020 | Technology
This article is contributed. See the original author and article here.
Digital transformation has been with us for some years, but with the global pandemic, it has quickly become an urgent reality for many organizations! With the various lockdowns around the globe, companies suddenly had to adjust their business processes and enable workers to work from home (WFH) while others are in the office. IT must ensure printing is still secure when supporting a hybrid workforce.
The Microsoft 365 Universal Print service and YSoft OMNI Series combined, offer a great solution for print admins. YSoft OMNI Series instantly connects any in-market home or office printer to Universal Print. Here’s how these two technologies work together to facilitate three hybrid workforce use cases (and more).
- Print to office from home
- Print to home from home
- Print to/from anywhere
Print to office from home
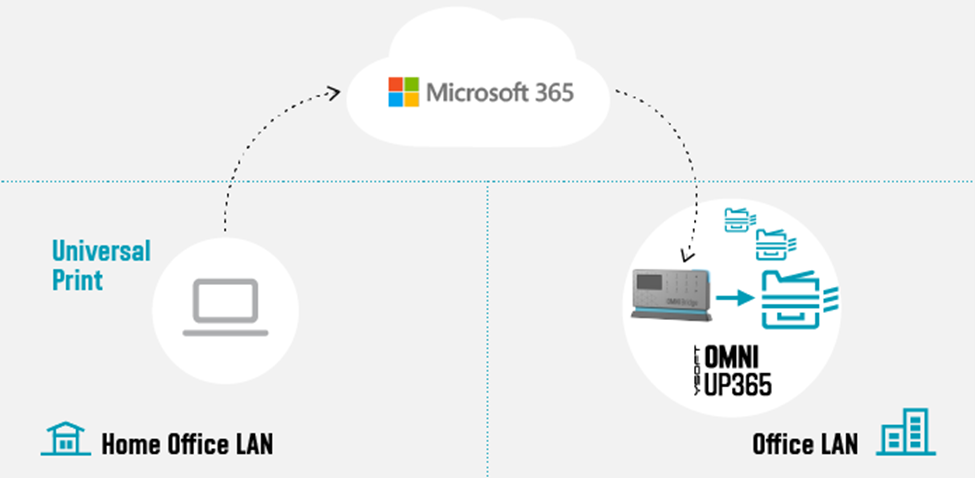
 Figure 1: Print to office from home
Our first use-case is an SMB business with a Microsoft 365 Business premium subscription that wants to take advantage of Universal Print with their existing, in-market printers.
Some workers remain essential to corporate operations, such as shipping and receiving. So, there are times where workers at home need to print to a device at the office for others to pick up the print job (e.g. shipping documents, manifest, etc.).
One of the main advantages of the cloud is that it does not care where you are located. Whether you are at the office or at home, you can always reach the cloud given an internet connection. Home users can print using Universal Print just as if they were sitting in the office. The YSoft OMNI Series solution, consisting of YSoft OMNI Bridge™ and OMNI UP365™ App, retrieves and delivers the print job to the desired in-office printer transparently! No need for the home user to dial the company VPN to reach an on-premises printer!
But you are probably thinking, “Ok, but how often does this help me? Most of the time, I need to print something for myself!” Which leads us to the next use-case.
Print to home from home (with corporate processes and security)
 Figure 2: Print to home from home
In this use-case, it’s obvious that a home-office printer can be printed to without any additional solution beyond printer drivers and a wi-fi network or USB cable. But what about the security concerns in this scenario? Do companies have any way to track what gets printed on that home-use or personal printer?
Universal Print and OMNI Series come to the rescue here. The company can issue an OMNI Series solution along with the home-office printer. Via Universal Print, OMNI Series enables traceability and accountability for all print jobs printed on the printer. Other household members are restricted from printing to the device, since they lack access to the Universal Print’s print queue.
Print to / from anywhere
Additionally, we can reverse the previous use case. Someone sitting in the office can print to the home-office printer for the remote worker’s convenience. This is enabled by deploying OMNI Series solutions in both sites, which in turn, enables the final use-case wherein everyone can print anywhere!
 Figure 3: Print to/from anywhere
Technologies
The various technologies applied to create these solutions range from industry standards, such as Internet Printing Protocol (IPP), to public interfaces provided by Microsoft (e.g. MS Graph API for Pull Printing) to proprietary Y Soft innovations. Specifically, IPP relies on and inherits capabilities from the Hypertext Transfer Protocol (HTTP) which provides the foundation for all the streaming and security features that one would come to expect from printing to the cloud.
OMNI Series leverages such standards and APIs to provide industry compliant solutions and provides enhanced value-add beyond the scope of the underlying technology. For example, by leveraging IPP/IPPS standards, OMNI Series realizes immediate capabilities such as:
- Print job submission
- Standard query implementations of a printer’s capabilities and status
- Simultaneous querying of multiple print jobs’ states
- Standard implementation to cancel previously submitted jobs
Without an industry-wide standard such as IPP, OMNI Series would have to implement specific business logic for each printer brand (and possibly model) which leads to dramatic increases in complexity and development costs.
Additionally, Microsoft is bringing additional value through their implementation of value-add Print Management features such as their recently released preview of their Pull Printing API as part of the Microsoft Graph API. Most print management solutions now offer some form of “pull printing”. For
Y Soft’s flagship product, YSoft SAFEQâ, this feature is called Print Roamingâ. OMNI Series is looking toward Universal Print’s Pull Print API to implement a rich and robust printing capability wherein a user will be able to print to the cloud and “pull” his print job to whichever printing device is most convenient to them.
Security
Working from Home implies a risk, and cybercriminals have taken advantage. Any solution dealing with data as sensitive as a company’s private print stream must make security a top priority. For a WFH solution such as OMNI Series, one must be concerned with both “Data in Transit” and “Data at Rest”.
Data ‘in Transit’ security means that the communications links and channels are encrypted and secured using the latest technologies which are yet to be “cracked”. For OMNI Series and Universal Print, encryption is provided through Transport Layer Security (TLS) and uses AES-256 encryption on all communications between client, cloud, and printer. OMNI Series relies on these security measures as well.
For data ‘at Rest’ in a pull-printing scenario, this means that the print job data is spooled to the Microsoft 365 cloud, awaiting a final destination for the print job release. For OMNI Series, this means relying on the Universal Print infrastructure built within the secure Microsoft 365 infrastructure, where all Universal Print data is stored in the tenant’s Office storage area.
Both Microsoft and Y Soft are working together to ensure that businesses who are not able to purchase a new print fleet will be able to use Universal Print easily and cost effectively and that document printing is secure whether workers are at home or in the office. The hybrid workforce model is here to stay and technology is keeping pace. Stay tuned for more exciting news and watch our WFH webcast.
by Contributed | Oct 29, 2020 | Uncategorized
This article is contributed. See the original author and article here.
As I reflect on an action-packed few weeks, I’m struck by how much work has evolved in these past months. And I know our customers feel it too. After quickly moving to remote and hybrid work models this spring, organizations are now seeking sustainable ways to help people collaborate, be productive, and prioritize their wellbeing…
The post Microsoft Productivity Score and personalized experiences—here’s what’s new to Microsoft 365 in October appeared first on Microsoft 365 Blog.
Brought to you by Dr. Ware, Microsoft Office 365 Silver Partner, Charleston SC.

Recent Comments