
by Contributed | May 12, 2021 | Technology
This article is contributed. See the original author and article here.
Our team at EDGE Next has been developing with Azure Digital Twins since the platform’s inception and have made the Azure service a core component of our PropTech platform. From energy optimization to employee wellbeing, we’ve continued to innovate on top of Azure Digital Twins to provide our customers with a seamless smart buildings platform that puts sustainability and employment wellbeing front-and-center. We’ve upgraded our platform to take advantage of the latest Azure Digital Twins capabilities – like more flexible modeling and data integration options – that have equipped us to advance our goals of a reduced environmental footprint and increased workforce satisfaction. We’ve distilled some key learnings from our enhancements and we’d like to share our ideas with any team developing with Azure Digital twins – regardless of industry vertical.
The EDGE Next platform
EDGE Next is a PropTech company that was spun-off from EDGE, a real estate developer that shares our goal of connecting smart buildings that are both good for the environment and for the people in them.
Each EDGE project aims to raise the bar even higher to be the leader in the real estate market from a sustainability and wellbeing perspective. The EDGE Next platform provides a seamless way of ingesting massive amounts of IoT data, analyzing the data and providing actionable insights to serve both EDGE branded and non-EDGE branded (brownfield) buildings. EDGE Next currently has 13 buildings deployed, including Scout24, a tenant in the recently completed EDGE Grand Central Berlin building. We also have several pilots running, including with the Dutch Ministry of Foreign Affairs, IKEA and Panasonic.
At the heart of the EDGE Next platform is Azure Digital Twins, the hyperscale cloud IoT service that provides the “modeling backbone” for our platform. We leverage the Digital Twins Definition Language to define all aspects of our environment, from sensors to digital displays. Azure Digital Twins’ live execution environment is where we turn these model definitions into real buildings’ digital twins, which is brought to life by device telemetry. Finally, the latest data from these buildings is pushed to onsite digital signage and accessible via our platform. Azure Digital Twins played a vital role in enabling key capabilities of the EDGE Next platform, like allowing our implementation teams to onboard customer buildings to the platform without support from the EDGE Next development team (Self-Service Onboarding) and to integrate and manage customer devices in a (Bring Your Own Device). These capabilities are crucial to our platform’s onboarding experience and have brought the time it takes to onboard a customer’s building onto the platform down from weeks to just a couple of minutes.
One of the first buildings to use the platform was EDGE Next’s headquarters, EDGE Olympic in Amsterdam, the very first in a new generation of healthy and intelligent buildings. This hyper-modern structure is used as a living lab to help facilitate real scenarios for the team to materialize incubational ideas into concrete offerings. We leverage a host of sensors throughout the building that measure air quality, light intensity, noise levels and occupancy to create transparency around people counting, footfall traffic and social distancing metrics for COVID-19 scenarios.
EDGE Olympic building (Amsterdam, NL)
Data pathways in the platform
To give you an idea of how our platform works, we walk through the path of the data before and after it reaches Azure Digital Twins. In the diagram below, you can see how Azure Digital twins fits into our platform architecture, with emphasis on the data sources and destinations.

Data sources
The platform enables telemetry ingestion from a collection of IoT Hubs, but also allows messages to flow in from other clouds and APIs (like Azure Maps for outdoor conditions) in inter-cloud and intra-cloud integration scenarios. Given the wide range of different vendor specific APIs that the EDGE Next platform must cater to, our engineering team opted to implement a generic API connector – agnostic to the vendor implementation – and fully rely on a low-code, configuration-driven code base built on top of Azure Functions.

Once the data has been collected using the ingestion mechanisms, it passes through a mapping profile which transforms the raw telemetry messages to known typed messages based on the associated device twins inside the Azure Digital Twins instance. The process of mapping the incoming data is completely driven by low-code JSON Patch configurations, which enables Bring Your Own Device (BYOD) support without additional mapping code logic.

Each message that comes into the ingestion pipeline needs to contain specific fields or it will be rejected. The mapper consults a registry containing all data points in the system and their respective mapping profile configuration to be used for the transformation. The mapper not only transforms the values to the desired internal contract format, but also performs inline unit conversion functions (such as parts per billion to micrograms per cubic meter).
The messages are passed through our Filters stage (detailed below) and finally ingested into Azure Digital Twins.
Data destinations
Once Azure Digital Twins is updated with vendor data and sensor telemetry, the resulting events and twin graph state is accessible via a rich set of APIs that supports and enables multi-channel data delivery. The data is offered in three ways: A web-based portal for visualizations and actionable insights, a digital signage solution for narrowcasting onsite and a set of data APIs to allow our customers to pull their data to integrate with their custom solutions.
EDGE Next portal

The EDGE Next Portal is where most of our customers go to get actionable insights based on retrospective aggregated data, for example highlighting abnormal spikes in energy usage over the weekends where occupancy is at a minimum or suggest more optimized set-points for the HVAC to optimize energy usage. The portal is built on ASP.NET Core 3.1 and driven by reports and dashboards rendered from Power BI embedded. From the Azure Digital Twins instance, measurements are eventually sent to the Azure Data Lake storage, where a batch process is responsible for populating an enriched data model inside Power BI.
On-site digital signage

The digital signage solution provides a way to render data collected in rooms and areas in real-time on virtually any digital display. The solution is built with vanilla HTML and JavaScript and can run on any device that supports web pages. The mechanism that drives the delivery of the data, fed from the events generated from the Azure Digital Twins instance, and then uses Azure SignalR to push all the data in real-time to the displays. On our roadmap, we’re very excited to offer a Digital Signage SDK that will allow customers to build their own narrowcast experiences.
External Data APIs
The data APIs that we expose are the primary method for our customers to interact with their data on their terms. The Streaming API is responsible for pushing real-time telemetry to a wide variety of customer destinations (like Web Hook, Event Hub, Service Bus) and is often used to drive their custom solutions and dashboarding. The Data Extract API is used for ad-hoc data extract over a REST interface where customers can define entities in their environment and a timespan to receive a JSON payload with relevant data. Finally, the Data Share API allows customers to specify destination channels to receive bulk data transfers, powered by Azure Data Share.
Learnings from our journey
We’ve honed in on Azure Digital Twins to forward our goals of sustainability and employee well-being as the service offers our solution incredible flexibility. We’ve noted some key learnings in 3 major areas of the Azure Digital Twins development cycle which we hope the developer community can build off.
Optimizing our ontology for queries
To accomplish our goals of only utilizing necessary resources and building a cost-effective platform, we leveraged service metrics in the Azure Portal to monitor and understand our query and API operations usage. We learned that on average, a typical building running in production on the EDGE Next platform generated around two million telemetry messages per day, which resulted in almost sixty million daily API operations.
After assessing our topology at the time, we focused on reworking our digital twin to optimize for simplicity and reducing data usage. We reduced the amount of “hops” (or twin relationships to traverse) required in our most common queries first; JOINs add complexity to queries, so it’s most economical to keep related data fewer “hops” from each other. We also broke the larger twins into smaller, related twins to allow our queries to return only the data we need.

As you can imagine, the ontology design process is a big part of any digital twin solution, and it can be a time-consuming task to develop and maintain your own modeling foundation. To simplify this process, we referenced the open-source DTDL-based smart buildings ontology, based on the RealEstateCore standard, that Azure has released to help developers build on industry standards and best practices for their solutions. The great thing about using a standard framework is the flexibility to pick-and-choose only the components and concepts that are truly required for your solution. For example, we chose to utilize the room, asset and capability models in our ontology, but we haven’t yet implemented valves or fixtures. As our platform grows and requirements evolve, we’ll continue to cherry-pick critical concepts from the RealEstateCore ontology.
Streamlining our compute
At EDGE Next, we take sustainability very seriously. Solutions in the cloud need to be developed with mindfulness for the environment, and our engineers take great pride in the lightweight event-driven architecture that only lights up when needed and seamlessly scales as demand grows. With that said, it is important to pare down the massive amounts of data the buildings on our platform generate to limit unnecessary compute. Below, the diagram depicts how raw telemetry traffic is deliberately reduced through several different stages of the ingestion pipeline before it reaches the Azure Digital Twins instance. These steps are depicted in the “Data sources” diagram above as the Filters stage.

- Filtering – This stage ensures all duplicate messages are rejected and telemetry values within certain deviations are ignored. Due to the nature of the sources transmitting the messages, we do not have control on the throughput or what ends up on the IoT Hub, so we must rely on hashes and timestamps for detecting duplicate values as early in the pipeline as possible. AI-driven deviation filters validate incoming telemetry values against an expected range and drop those that don’t provide impact to current values.
- Caching – This stage includes smart caching mechanisms that reduce unnecessary GET calls to the Azure Digital Twins API by storing common existing relationships. This relationship cache is kept up to date by lifecycle events emitted by the Azure Digital Twins instance.
- Throttling – The throttling mechanism delays ingress logic to avoid spiky workloads by spreading the load out evenly over time. In scenarios where data ingress is delayed, we can see a backlog of unprocessed events that can cause huge activity spikes throughout the system. The throttling mechanism will kick in as a circuit breaker to ease the load and prevent overutilization of resources.
- Grouping – This stage recognizes messages that are targeting the same twin and combining them into minimal resulting API requests to reduce unnecessary updates and load.
Concentrating our query results
The Azure Digital Twins Query Language is used to express an SQL-like query to get live information about the twin graph. When building queries for sustainability and cost-effectiveness, it’s key to minimize the query complexity (quantified by Query Units in the service), which translates to reducing JOINs (query “hops”) and the amount of data the query must sift through. It’s also important to be intentional about how many API operations your request is consuming, meaning you should limit your query responses to only what’s critical for your solution.
A good example of the balance between Query Unit consumption and API Operation response sizes is the retrieval of information across multiple relationships in your twins graph. A scenario that we encountered multiple times during development was the retrieval of a parent with its children. You can write this into a “basic” query that would look like:
SELECT Parent, Child FROM digitaltwins Parent JOIN Child RELATED Parent.hasChild WHERE Parent.$dtId = ‘parent-id’
The “basic” query consumes 26 Query Units and 81 API Operations.
When using the response data, we discovered that retrieving all properties on the parent was unnecessary, which introduced excessive API consumption. In many scenarios it was better to execute two separate queries that projected only the properties that were required. This resulted in substantially fewer API Operations consumed, with a slight increase in Query Unit consumption. Our “optimized” query looks like:
SELECT valueA, valueB, valueC FROM digitaltins WHERE $dtId = ‘parent-id’ AND IS_PRIMITIVE(valueA) AND IS_PRIMITIVE(valueB) AND IS_PRIMITIVE(valueC)
The “optimized” query resulted in 4 Query Units and 1 API Operation.Implementing this operation resulted in an approximately 83% decrease in Query Units and 98% decrease in API Operations. In one of our processes, this change introduced an overall consumption reduction of 45%.
Moreover, you may be able to remove some queries altogether – Azure Digital Twins allows you to listen to lifecycle events and propagate resulting changes throughout your twins graph. If you capture the relevant lifecycle events, which carry information like updated properties and relationships in the payload, you can gather and react to the latest twin data without any queries at all. Our architecture that supports this optimization relies heavily on Azure Digital Twins’ eventing mechanism. Lookup caches in different forms and structures (like parent/child relationships, contextual metadata, etc.) are kept up to date by these events, allowing us to reduce API Operation consumption in the service.
EDGE Next + Azure Digital Twins
Azure Digital Twins gives us a head start in value proposition and time to market than our competitors. We’re able to deliver our customers with a seamless platform that offers quicker building onboarding times. Moreover, it offers us immense value by enabling development accelerators like our low-code ingestion pipeline, and endless integration possibilities with the API surface.
We are expecting to see a huge influx of building onboardings in the near future as our platform is already starting to gain massive commercial traction within the real estate and PropTech industries. Our platform is also constantly evolving with new features, and we look forward to leveraging cutting-edge Azure offerings like Azure Maps, Time Series Insights, IoT Hub and Azure Data Explorer to amplify the value proposition of our IoT Platform.
Learn more
Read about EDGE’s vital role in digital real estate
by Contributed | May 12, 2021 | Technology
This article is contributed. See the original author and article here.
Microsoft partners like contexxt.ai, Qunifi, and CoreStack deliver transact-capable offers, which allow you to purchase directly from Azure Marketplace. Learn about these offers below:
|
C.AI Adoption Bot: Cai, a chatbot from contexxt.ai, answers employees’ questions and helps them more effectively utilize the features of Microsoft Teams. Cai’s algorithm will predict important tips to share and deliver only relevant content based on individual skills and learning preferences. With Cai, businesses can drive Teams usage and reduce training costs. This app is available in German.
|
 |
Call2Teams for PBX: Qunifi’s Call2Teams global gateway provides a simple link between your existing PBX and Microsoft Teams. Teams users can make and receive calls just as they would on their desk phone. No hardware or software is required, and the cloud service can be set up in minutes. Bring all users under one platform by using Teams for collaboration, messaging, and voice.
Fuze Direct Routing: Use enterprise-grade calling services in Microsoft Teams with this offer from Qunifi. Customers can combine the native dial pad and calling features of Teams with Fuze global voice architecture, enabling Teams calling across all devices, including Teams clients on mobile devices. This integration does not require hardware or software deployment on any device.
|
 |
CoreStack Cloud Compliance and Governance: CoreStack, an AI-powered solution, governs operations, security, cost, access, and resources across multiple cloud platforms, empowering enterprises to rapidly achieve continuous and autonomous cloud governance at scale. Run lean and efficient cloud operations while achieving high availability and optimal performance.
|
|
by Contributed | May 12, 2021 | Technology
This article is contributed. See the original author and article here.
Introduction
Customizable machine learning (ML) based anomalies for Azure Sentinel are now available for public preview. Security analysts can use anomalies to reduce investigation and hunting time as well as improve their detections. Typically, these benefits come at the cost of a high benign positive rate, but Azure Sentinel’s customizable anomaly models are tuned by our data science team and trained with the data in your Sentinel workspace to minimize the benign positive rate, providing out-of-the box value. If security analysts need to tune them further, however, the process is simple and requires no knowledge of machine learning.
In this blog, we will discuss what is an anomaly rule , what the results generated by the anomaly rules look like , how to customize those anomaly rules, and the typical use cases of anomalies.
A new analytics rule type: Anomaly
A new rule type called “Anomaly” has been added to Azure Sentinel’s Analytics blade. The customizable anomalies feature provides built-in anomaly templates for immediate value. Each anomaly template is backed by an ML model that can process millions of events in your Azure Sentinel workspace. You don’t need to worry about managing the ML run-time environment for anomalies because we take care of everything behind the scenes.
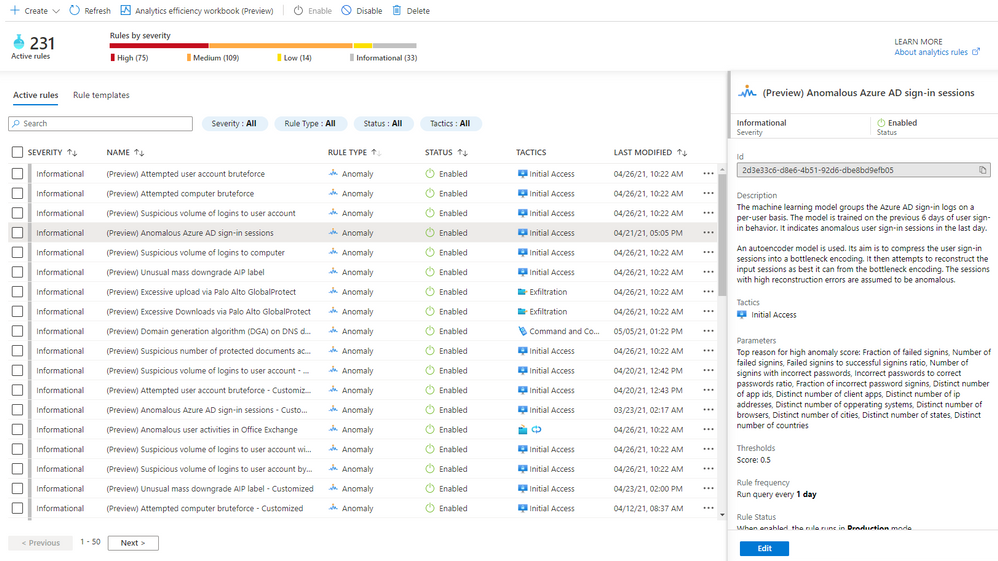
In public preview, all built-in anomaly rules are enabled by default in your workspace. Even though all anomaly rules are enabled, only those anomaly rules that have the required data in your workspace will fire anomalies. Once you onboard your data to your Sentinel workspace using data connectors, the anomaly rules monitor your environment and fire anomalies whenever they detect anomalous activities without any extra work on your side. You can disable an anomaly rule andor delete it in the same way as you do for a Scheduled rule. If you deleted an anomaly rule and decide to enable it again, go to the “Rule templates” tab and create a new anomaly rule. Figure 1 shows the anomaly rules on the “Analytics” blade.
Figure 1 – Anomaly rules
To learn the details of an anomaly rule, select the rule and you will see the following information in the details pane.
- Description explains how the anomaly model works and the ML model training period. Our data scientists pick the most optimal training period depending on the ML algorithm and the specific scenario. The anomaly model won’t fire any anomalies during the training period. For example, if you enable an anomaly rule on June 1, and the training period is 14 days, no anomalies will be fired until June 15.
- Data sources indicate the type of logs that need to be ingested in order to be analyzed.
- Tactics are the MITRE ATT&CK framework tactics covered by the anomaly.
- Parameters are the configurable attributes for the anomaly.
- Threshold is a configurable value that indicates the degree to which an event must be unusual before an anomaly is created.
- Rule frequency is how often the anomaly model runs.
- Anomaly version shows the version of the template that is used by a rule. Microsoft continuously improves the anomaly models. The version number will be updated when we release a new version of the anomaly model.
- Template last updated is the date the anomaly version was changed.
View anomalies identified by the anomaly rules
Assuming the required data is available and the ML model training period has passed, anomalies will be stored in the Anomalies table in the Logs blade of your Azure Sentinel workspace. To query all the anomalies in a certain time period, select “Logs” on the left pane, choose a time range, type “Anomalies”, and click the “Run” button, as shown in Figure 2.

Figure 2 – View all anomalies in a time range
To view the anomalies generated by a specific anomaly rule in a time range, go to “Active rules” tab on the “Analytics” blade, copy the rule name excluding the pre-fix “(Preview)”, then select “Logs” on the left pane, chose a time range, and type
Anomalies
| where AnomalyTemplateName contains “<anomaly rule name>”
Paste the rule name you copied from the “Active rules” tab in place of <anomaly rule name>, and click the “Run” button, as shown in Figure 3.

Figure 3 – View anomalies generated by a specific anomaly rule
You can expand an anomaly by clicking > to view the detail. A few important columns are highlighted in Figure 4

Figure 4 – Anomaly detail
- RuleStatus – an anomaly rule can run either in Production mode or in Flighting mode. RuleStatus tells you this anomaly is fired by the rule running in Production mode or by the rule running in Flighting mode. We will discuss the running modes in detail in the Customize anomaly rules section.
- Extended links – this is the query to retrieve the raw events that triggered the anomaly.
- UserName – this is the main entity responsible for the anomalous behavior. Depending on the scenario, it can be the user who performed the anomalous activity, the IP address that is either the source or destination of an anomalous activity, the host on which the anomalous activities happened, or another entity type.
- AnomalyReasons – this tells you why the anomaly fired. We will discuss the anomaly reasons more in the Customize anomaly rules section.
- Entities – in includes all the entities related to this anomaly.
Customize anomaly rules
Azure Sentinel customizable anomalies are specifically designed for security analysts and engineers and do not require any ML skill to tune. You can tweak the individual factors and/or threshold of an anomaly model, cutting down on noise and making sure that anomalies are detecting what’s relevant to your specific organization. To customize an anomaly rule, follow the steps below:
- Right click an anomaly rule, then click “Duplicate”, a new anomaly rule is created. The new anomaly rule name is hardcoded with a suffix “_Customized”.
- Select the customized rule, click “Edit.”
- On the “Configuration” tab, you can change the parameters and threshold. Each anomaly model has configurable parameters based on the ML algorithm and the scenario. Figure 5 shows that you can exclude certain file types from the anomaly rule “Unusual mass downgrade AIP label.” You can also prioritize specific file types. Prioritize means the ML algorithm adds more weight when it scores anomalous activities related to that file type.

Figure 5 – Configure an anomaly rule
Click on an “Anomaly ID” in the “Results preview” table, you will get the anomaly details, including why the anomaly is triggered. Figure 6 shows the details of an anomaly for a suspicious high volume of failed login attempts events (event 4625) observed on a device. The anomaly value is 66 failed logins on that device in the last 24 hours, the expected value is zero because there are zero failed logins on that device in the previous 21 days. This anomaly is an indication of a potential brute-force attack. The anomaly reason helps you to understand how an anomaly is generated, so you can decide which parameters to adjust and what new value you want to set to reduce the noise in your environment.

Figure 6 – Anomaly reasons
Once you have set the new value for a parameter or adjusted the threshold, you can compare the results of the customized rule with the results generated by the default rule to evaluate your change. The customized rule runs in Flighting mode by default, while the default rule runs in Production mode by default. Running a rule in Flighting mode when you want to test the rule. The Flighting feature allows you to run both the default rule and the customized rule in parallel on the same data for a time period, so you can evaluate the result of your change before committing to it.
There are two ways to compare the results:
- Use the “Results preview” table (refer to Figure 5)
Some changes don’t require the ML model to re-run, but some do. For the changes that don’t require the ML model to re-run, you can click Refresh to see the side-by-side comparison in the table. It shows you the added anomalies, the removed anomalies, and the anomaly score changes as a result of your changes to parameters and/or the threshold compared to the default rule running on the same data in the same time range. For the changes that require the ML model to re-run, you must save the change, and come back later to see the side-by-side comparison after the ML model completes its re-run.
- Query the results generated by both rules in “Logs”
You can run a query to get all the anomalies generated by the default rule and the customized rule (refer to Figure 3), compare them in the view, or export them and use your favorite tool to compare the results.
You can change the parameters in your customized rule multiple times until you are satisfied with the result. When you decide to replace the default rule with the customized rule, you switch the customized rule to run in Production mode. To switch an anomaly rule from Flighting mode to Production mode, go to the “General” tab, click “Production.” A confirmation message pops up, click “yes” to confirm. Your customized rule will run in Production mode and the default rule will switch to run in Flighting mode automatically. Only one rule of the same anomaly scenario can run in Production mode. You can disable the default rule at this point.

Figure 7 – Switch the running mode of an anomaly rule
Typical anomaly use cases
While anomalies don’t necessarily indicate malicious behavior by themselves, they can be used to improve detections, investigations, and threat hunting:
- Additional signals to improve detection: Security analysts can use anomalies to detect new threats and make existing detections more effective. A single anomaly is not a strong signal of malicious behavior, but when combined with several anomalies that occur at different points on the kill chain, their cumulative effect is much stronger. Security analysts can enhance existing detections as well by making the unusual behavior identified by anomalies a condition for alerts to be fired.
- Evidence during investigations: Security analysts also can use anomalies during investigations to help confirm a breach, find new paths for investigating it, and assess its potential impact. For example, when investigating an incident that involves a user and an IP address, a security analyst can query the user and the IP address in the “Anomalies” table to find out other anomalous activities performed by that user and that happened on that IP address. These data help security analysts reduce the time spent on investigations.
- The start of proactive threat hunts: Threat hunters can use anomalies as context to help determine whether their queries have uncovered suspicious behavior. When the behavior is suspicious, the anomalies also point toward potential paths for further hunting. These clues provided by anomalies reduce both the time to detect a threat and its chance to cause harm.
In the next blog, we will do a deep-dive into how anomalies can be used in detections and hunting queries, as well as how to simulate anomalies in your workspace.
by Contributed | May 12, 2021 | Technology
This article is contributed. See the original author and article here.
This past year has put unprecedented strain on security teams, and many are preparing to “return to normal” with a new view of what it will take to protect their organizations. Environments are still increasingly distributed, threats are more difficult to catch through overwhelming noise, and security analysts need to efficiently work across remote teams.
Supporting security teams through these challenges was top of mind for the Azure Sentinel team as we continued to deliver new innovation in the product. Our latest releases for the RSA Conference 2021 are all about improving quality of life for security operations teams.
Today, we are announcing the launch of a solutions marketplace in Azure Sentinel, providing customers with an easy want to unlock new use cases. One of the most exciting new solutions is designed to help you monitor and respond to threats in your SAP environments, often home to some of your most business-critical data and applications. We’re also releasing new features to help you harness machine learning to efficiently detect threats through the noise. Plus, we’re making it easier for SecOps teams to work together with native Microsoft Teams collaboration integration.
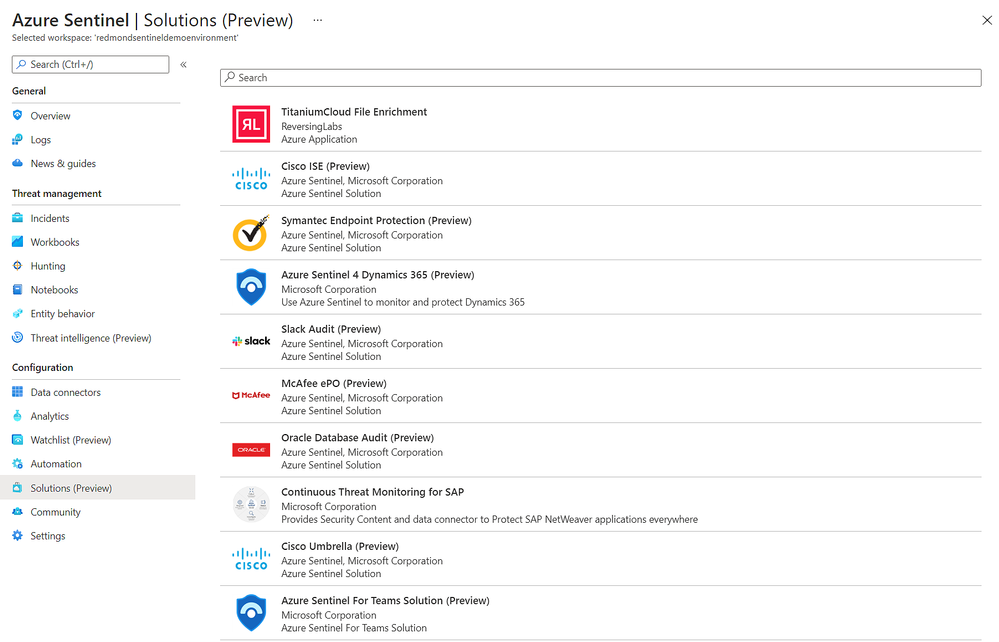
Easily discover and deploy Solutions for Azure Sentinel
With the release of Azure Sentinel Solutions, now in public preview, we’re providing a new, easier way to discover and deploy use cases for Azure Sentinel. Solutions consolidate related connectors and content, and can include data connectors, analytics rules to power detections, interactive workbooks, automation playbooks, and more so you can easily enable new use cases for integrations, end-to-end, from a single package.
The Solutions marketplace features 32 solutions that includes:
- Palo Alto Prisma and Cloudflare solutions to give you visibility into your cloud workloads.
- Threat intelligence solutions from RiskIQ, and ReversingLabs to enrich your threat detection, hunting and response capabilities.
- Azure SQL and Oracle database audit solutions to monitor your database anomalies.
- And many more, like PingFederate for monitoring identity and access, Cisco Umbrella solution for threat protection, McAfee ePo solution for endpoint protection, Microsoft Teams solution for productivity workloads, and more.
Visit the in Azure Sentinel to see all available solutions. Partners and community members can build and contribute new solutions by following the guidelines on the Azure Sentinel GitHub.
Monitor your SAP applications and respond quickly to threats
One of the most highly anticipated solutions for Azure Sentinel is our SAP threat monitoring solution. Now, you can use Azure Sentinel to monitor your SAP applications across Azure, other clouds, and on-premises.
 - sharp.png")
SAP handles massive amounts of extremely sensitive data. These increasingly-complex systems are business critical, and a security breach to them could be catastrophic. With the release of the Azure Sentinel continuous threat monitoring solution, now in Public Preview, Azure Sentinel provides continuous threat detection and analytics to identify real threats and malicious behaviors. The SAP threat monitoring solution provides connectors, analytics rules to power detections, interactive workbooks, and more to help organizations detect threats to their SAP environments and respond quickly.
Learn more in documentation for the SAP threat monitoring solution.
Tap into the power of ML with new easy-to-tune anomaly detections
With the release of customizable ML anomalies, now in Public Preview, we’re introducing a code-free experience to help security analysts get the most out of machine learning. These anomalies span the attack chain, today covering 11 of the 14 total MITRE ATT&CK tactics.

Security analysts can customize the parameters used in the ML model to tune anomalies to their specific needs, cutting down noise and ensuring that anomalies are detecting what’s relevant to your specific organization. For example, you can add or remove file extensions to prioritize/exclude document types for detecting mass downgrade AIP document sensitive labels, such as from High confidential to Public, or adjust the threshold of the number of documents that is considered a mass downgrade — customization that is especially useful given that different organizations often have different file sensitivity processes. In another example, you can also customize fourteen different parameters that affect the ML score of anomalous Azure Active Directory sign-in sessions, as well as the threshold for triggering these anomalies, so you can tailor the ML models based on your organization’s processes, priorities, and user behavior.
Learn more about customizable ML anomalies here.
Collaborate more efficiently with native Microsoft Teams integration
Many of our customers use Microsoft Teams to collaborate across security operations teams during investigations. Our new integration with Microsoft Teams, now in Public Preview, will make that easier than ever.

Azure Sentinel now integrates with Microsoft Teams so that, with a single click, you can create a Team for a particular incident. Use this Team as your central hub for investigation across members of the security team, all with easy access to the incident in a tab within it. When the incident is closed in Azure Sentinel, the Team is automatically archived, providing a record of the investigation should you need to reference it in the future.
Learn more about the Microsoft Teams collaboration integration here.
Improve SOC hunting visibility with a refreshed hunting dashboard
Now in public preview, a refreshed hunting query experience helps you find undetected threats more quickly and identify which hunting results are most relevant to your environment.

You can now run all your hunting queries, or a selected subset, in a single click. To contextualize your results, you can search for or filter results based on specific MITRE ATT&CK techniques. You can also identify spikes of activity with new “result deltas” to see which results have changed the most in the last 24 hours. As you filter through your queries and results, the new MITRE ATT&CK tactic bar dynamically updates to show which MITRE ATT&CK tactics apply.
Learn more about new hunting dashboard features here.
New IP entity page accelerates triage and investigation
Also in public preview, the IP entity page is the latest addition to Azure Sentinel’s User and Entity Behavior Analytics capabilities. Like the host and account pages, the IP page helps analysts quickly triage and investigate security incidents. The IP page aggregates information from multiple Microsoft and 3rd party data sources and includes insights like threat indicator data, network session data, host IP mappings, and first/last seen information – which is retained even if the earliest records age out of the retention period.

A key insight presented in IP entity pages is geolocation information, which is often used to assess the security relevance of an IP address. We provide geolocation enrichment data from the Microsoft Threat Intelligence service. This service combines data from Microsoft solutions with 3rd party vendors and partners. It will soon be available via REST API for security investigation scenarios to Azure Sentinel customers.
Learn more about the IP entity page here.
Detect advanced multistage attacks with new scheduled analytics rules in Fusion
Azure Sentinel leverages a machine learning technology called Fusion to automatically detect multistage attacks by identifying combinations of anomalous behaviors and suspicious activities that are observed at various stages of the kill-chain. There are currently 90 multistage attack scenarios detected by Azure over medium and low severity alerts from Microsoft threat protection services and third party sources, like Palo Alto Networks.
To help you discover threats tailored to your environment, we are releasing multistage attack scenarios that leverage a set of custom scheduled analytic rules to public preview. With these rules, Fusion can detect 32 new scenarios by combining alerts from the scheduled analytics rules, which detect specific events or sets of events across your environment, with alerts from Microsoft Cloud App Security or Azure Active Directory Identity Protection.
Learn more about the supported scenarios and how to configure your scheduled analytics rules here.
Next Steps
Learn more about these new innovations and see them in action in our upcoming webinar on May 26 at 8 AM Pacific. Register here.
For RSA, Microsoft released a number of innovations across security, compliance, and identity solutions. Learn more in the blog by CVP Security, Compliance, and Identity Vasu Jakkal. Join us for a live webinar on May 27 at 8 AM Pacific to learn more about new innovations across Microsoft security – register here.
by Contributed | May 12, 2021 | Technology
This article is contributed. See the original author and article here.
Do you already have a solution in place to deal with insider risks? When it comes to remediating insider risks, many organizations either deploy a simple transactional, rules-based solution such as data loss prevention (DLP) or they deploy a much more complex and resource-intensive solution such as user and entity behavior analytics (UEBA). From our own experience and what we’ve learned from our Microsoft 365 customers, neither of these two approaches are effective when it comes to addressing insider risks.
While identifying insider risks can be complex, implementing a holistic solution that looks end-to-end will allow you to reduce the complexity and zero in on the relevant trends that lead to heightened risk. With privacy built-in, pseudonymization by default, and strong role-based access controls, Insider Risk Management is used by companies worldwide to identify insider risks and take action with integrated collaboration workflows.
To help organizations quickly get started in identifying and accelerating time to action on insider risks, we released a number of capabilities at Ignite. Today we are excited to announce the public preview of additional new features that further broaden the analytics and investigation capabilities already in the solution, making it easier to investigate and act on insider risks.
Enabling a richer and efficient investigation experience
Machine learning technology is amazing in that it can reason over and correlate millions of disparate signals to identify hidden risks. This is why we have several machine learning-based policy templates focused on specific risks, such as IP theft by departing employees and confidential data leakage by disgruntled employees, built into the Insider Risk Management solution.
However, what happens if you become aware of a potential insider risk through a tip? How do you efficiently investigate this tip without having to resort to manually trying to piece together various activities?
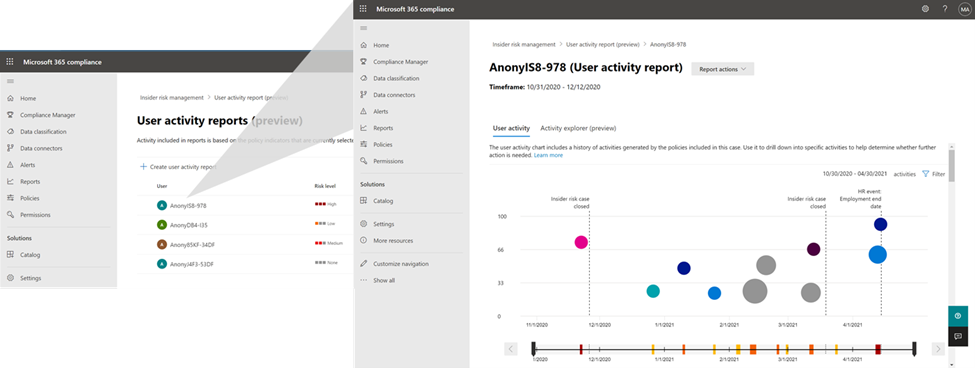
This is where the new User Activity report is valuable. This new capability provides the Investigator in Insider Risk Management with the ability to simply generate a report of the relevant activities of the user that they received a tip about, and quickly investigate those activities to understand the risk.
User Activity report
To make the alert review process more efficient, we have now enabled persistent filters. With this improved experience, selected filters on the alerts list, such as filters for policy, alert severity, alert status, and date range will persist throughout your alert review process. There is no need to reset filters to see your desired set of focused alerts as you move on to select the next alert to review. This provides a frictionless and efficient experience for analysts to quickly make progress through their queue of alerts.
Priority Content limits have also now been increased in policy from 15 to 50. This means you can select up to 50 SharePoint sites, 50 Microsoft Information Protection Labels, and 50 Sensitive Information Types to prioritize in your policy. This allows you to broaden the activity and content that you want to prioritize for risk scoring and also investigate the potential impact when risks are identified.
The Activity Explorer in Insider Risk Management has been very well received by customers as it provides comprehensive analytics and detailed information about alerts. With this release, we are making leveraging Activity Explorer for insider risk investigations even more efficient. Now, when activities are filtered to show only specific types of activities or workloads the columns associated with the activity of workload will dynamically update to show only the information which is most relevant.
 Removable media mounted
 File upload to cloud
Finally, we continue to further enrich our policy templates by making improvements to our Sensitive Information Type (SIT) classifications. SIT is used by the solution to provide an improved fidelity of matches for sensitive information within documents. In the past in order to leverage SIT in detecting whether someone is trying to exfiltrate sensitive information such as credit cards in email, you needed to have an associated DLP policy setup. With this release we are removing that requirement so that now all you have to do is opt-in to the Exchange Online indicator in the policy and the solution will automatically detect for SIT, no configuration or DLP policy needed.
Get started today
We have new videos showcasing how the new features in Insider Risk Management can help customers identify and remediate insider risks. We also have a new interactive guide to help you become familiar with the various capabilities in the solution.
The new features announced today will start rolling out to customers’ tenants in the coming days and weeks. Insider Risk Management is one of several products from Microsoft 365 E5, including Communication Compliance, Information Barriers, and Privileged Access Management, that helps organizations mitigate insider risks and policy violations. You can sign up for a trial of Microsoft 365 E5 or navigate to the Microsoft 365 compliance center to get started.
Learn more about Insider Risk Management, how to get started, and configure policies in your tenant in this supporting documentation. Keep a lookout for updates to the documentation with information on the new features over the coming weeks.
Finally, if you haven’t listened to our podcast “Uncovering Hidden Risks”, we encourage you to listen about the technologies used to detect insider risks and what is required to build and maintain an effective insider risk management program.
We are excited about all the new innovations coming out with this new release and look forward to hearing your feedback.
Thank you,
Talhah Mir, Principal Program Manager, Microsoft 365 Security and Compliance Engineering

Recent Comments