Set up a proactive, always-on service in Dynamics 365

Set up a proactive, always-on service in Dynamics 365

This article is contributed. See the original author and article here.

Set up a proactive and always-on service organization with Dynamics 365, from self–service automated actions using intelligent and conversational chatbots and IoT, to high touch customer agent and frontline technician support. Expert Deanna Sparks joins host Jeremy Chapman to share how to combine automation, intelligence and live personnel engagement to take customer support to the next level.


1_U7bnFxYWf8zii9QYuH5YKw.png


Build a better customer support experience:


  • Provide intelligent, proactive and automated self-service

  • Issue resolution through conversational IVA

  • IVA supports intelligent routing using AI models to escalate customer service requests to field technicians

  • Connect to experienced front-line workers through Remote Assist


QUICK LINKS:


01:56 — Self-service


03:40 — How to ensure quality of customer experience


06:03 — Field technician’s experience: Field service mobile app


07:16 — Remote assist


07:50 — Self service IVA setup


08:52 — Voice control setup


09:50 — Phone number setup


10:52 — Smart assist setup


11:55 — Field technician setup


12:48 — Wrap up


Link References:


Watch our Dynamics 365 series with Vanessa Fournier at https://aka.ms/Dynamics365forIT


Set up the Dynamics 365 modules and configure Dynamics 365 with Azure IoT at https://aka.ms/DynamicsAlwaysConnected


Check out our shows on PVA creation at https://aka.ms/PVAmechanics


Unfamiliar with Microsoft Mechanics?


We are Microsoft’s official video series for IT. You can watch and share valuable content and demos of current and upcoming tech from the people who build it at Microsoft.


Video Transcript:


– Up next, as part of our series on Dynamics 365, we’re joined by expert Deanna Sparks to show you how you can set up a proactive and always connected service organization from self-service automated actions using intelligent and conversational chatbots and IoT, all the way through to high-touch customer agent and frontline technician support. So, Deanna, welcome to Microsoft Mechanics.


– Thanks for having me on the show.


– And thanks for joining us today. So, this is a really topical show. Over the past year in particular, most customer facing businesses have had to adapt to more agile ways of engaging with their customers. You know, self-service online is now often the first contact-free point of engagement to be able to respond to customers fast, and at scale. And how well that experience goes can be the difference between keeping or losing business.


– That’s true, Jeremy, and creating that experience is not easy for service organizations. Today’s customers don’t just engage in one way anymore. It’s often multiple ways, such as phone, web, and their preferred social channels. So, to get this experience right, it can often involve multiple tools and a lot of integration work. That’s really the whole premise of Dynamics 365. We take away all of that complexity with modular applications that natively work together. And a lot of this can be automated to provide your customers with self-service options, wherever they choose to engage. For example, if your customer prefers to solve an issue on their own, they can, by enabling intelligent virtual agents using our Power Platform, extending even further when you enable connected devices with Azure IoT. Or you can build intelligent escalation paths to hand off to the right person. From there, you can pull in expert support with seamless collaboration tools. And if an on-site expert is needed, since everything is connected, it’s easy to provide your customers with experienced frontline workers. These turnkey applications and services can be configured for your organization. And today, it’s a lot easier to set up than you might think.


– So, can we see it in action?


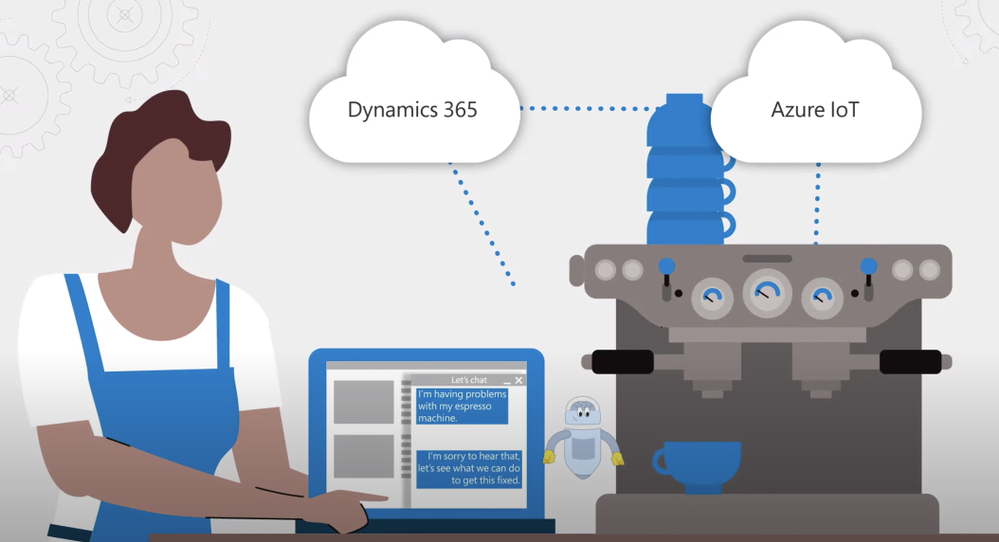
– So, let’s start with the self-service experience. I’m on the Contoso Coffee website and I want to report an issue with the espresso machine my coffee shop has purchased. It’s connected to Contoso Coffee via Dynamics 365 and Azure IoT. Now, most of us are familiar with text-based chat, but this takes things to the next level with voice assistance. I can dial a 1–800 number and I’ll be greeted by a virtual agent.


– [Agent] Hello, Fourth Coffee, thanks for calling Contoso Coffee support. Who am I speaking with?


– This is Deanna from the Bellevue location.


– [Agent] How can I help you today, Deanna?


– We have a two group coffee machine that we purchased from you, and we’ve noticed that it’s slow to respond to commands.


– [Agent] Okay, let me check on a few things.


– Okay, so while the bot is doing that, let me explain what is happening behind the scenes. You can see here in the PVA flow, that it is instructed to check on the device. It’s tapping into the device readings in IoT and Dynamics 365, and it recognizes that the firmware is out of date. The virtual agent was able to see the history of the device controller and that an update was needed. And by the way, because the IoT is surfaced through field service, it’s accessible to others in the organization. So, the virtual agent can now respond to me.


– [Agent] Thanks for waiting. It looks like your machine’s firmware is out of date. Can I get your permission to update it?


– Yes.


– [Agent] Thanks. This will take a few moments. We will update your machine’s controller.


– Thank you. So now, behind the scenes, the virtual agent is interfacing with field service and the command gets pushed down through the IoT hub to my espresso machine to update the firmware.


– Right, and this really feels like a high-touch experience because of the voice and intelligence that’s baked into the interaction that really allows the bot then to figure out the situation and take action. That said, though, how do you ensure the quality of the customer experience for things that might be outside of the realm of the bot’s diagnostic and kind of configuration power?


– Exactly, not every issue can or should be fixed by software and automated responses. Let’s say the machine is not performing consistently. Maybe the water isn’t flowing properly. A lot of different variables could cause this. So, here’s a standard text-based exchange. In this case, the virtual agent has identified the store as well as the equipment available to troubleshoot. The virtual agent is asking the customer to describe the issue. The customer is concerned about the inconsistent water flow. Now, behind the scenes intelligent routing uses AI models and rules to assess incoming service requests. This ensures that all customer interactions are routed to the correct customer service agent without constant queue supervision. Switching to the customer service agent’s point of view, they accept the incoming chat requests. This loads the previous virtual assistant conversation with associated cases and customer information. A benefit here is that it is the same agent experience whether the customer is reaching out from the web, email, social channels or phone. Before the agent greets the customer, highlighted on the left, the virtual agent suggests what to investigate first. In this scenario, it’s the water quality issue in the area. The agent uses quick replies to easily respond to the personalized greeting. Now, as the agent reviews, built-in AI has already linked the conversation to the proper case, tracking the root cause. In this scenario, it’s the King County water quality impact case. While the conversation continues on the left, on the right, Smart Assist suggests related knowledge articles. The top ranked article provides guidance on how Contoso should handle issues related to water quality and mineral content. The agent clicks on the article. There are recommendations of actions to take, including in this scenario sending a technician to install a water filtration system to fix the issue permanently. As a premium customer, they have access to a one-day SLA to provide onsite maintenance, and now the agent can notify the customer a technician will be sent. Next, an automated process creates the work order. And intelligence scheduling can pick a time and date within the SLA for when an appropriate technician can be onsite.


– So, now the appointment is all scheduled, but what does the field technician’s experience then look like?


– The main experience for a frontline worker is primarily surfaced through the field service mobile app. They can see complete information about their day in a familiar calendar view, similar to Outlook. When selecting a work order, the customer’s information and location are available. Once on site, frontline workers can follow the predefined guided tasks based off of the type of service they’re performing. Here, I’ve already completed the first two service tasks. But let’s say I want to follow along the third service task, which includes the inspection to ensure the successful installation of the water filtration system. This predefined checklist makes it easy for the technician to perform their work. In our case, we select the root cause of the installation as the county water supply. I mark that Fourth Coffee’s installation is covered under SLA. As I follow the precise installation process, I mark each step complete. When I finish the installation, I ensure the water is flowing well through the filter system and make sure there are no leaks. I move the progress to 100% and indicate the inspection as passed. Now that all of the tasks are done, I scroll up and save my work. Then at this point, I can go to the notes tab and capture a signature from the customer directly from my device.


– So now, the technician’s work is done, but what happens then if the customer has a question that really falls outside the expertise of the worker that’s on site? For example, what if they want to know if their coffee is pouring right?


– Well, that’s a great use case for remote assist. Not all technicians will know what the perfect cup of coffee looks like. To avoid sending another technician onsite, frontline workers can immediately connect with the Contoso Coffee Brewmasters. So, we’ll launch the remote assist experience. This connects to a remote expert that the field tech can share video with. Then, we’ll check the pour of the coffee and the remote expert can see things like the speed and color of the pour to say if everything looks good.


– This all looks pretty awesome. But what does it take then to set the experience up and why don’t we start with the self-service IVA?


– So, for the self-service experience, you need two things outside of core customer service and field service apps, the Omnichannel add-in, and your Power Virtual Agent. Once you have acquired the license for Omnichannel, the application appears in your Power Platform admin center under D365 apps. You’ll select the environment and which Omnichannel needs to be set up and select Manage. This takes you to the Omnichannel page and the Dynamics 365 admin center. We provide a guided experience to set up your different customer communication channels and additional settings. The second thing you need is to create the Virtual Agent flow. Here on the Power Virtual Agent author in Canvas, you can see the flow of what I just showed. You can see there’s logic and conditional branching and the prebuilt connectors make it easy to connect to Azure IoT for device readings.


– Right, and by the way, we’ve also recently done several shows on Power Virtual Agents, which you can check out at aka.ms/PVAMechanics. So, how do you get all this to work with the voice control that we saw?


– Actually, that’s the new part. To do that, you need to follow the previous setup experience for our new voice channel and link it to a preexisting Virtual Agent, just like you saw. So, starting in the Omnichannel admin center, click Set up voice demo. This will kick off an automated process to set up the work stream, acquire a phone number, set up your voice channel, create a queue service and wire up the Power Virtual Agent services. Once these automatic processes are complete, you can instantly try it by clicking on Open voice demo. At this point, you can test out the voice-to-agent escalation by calling the number and opening the agent experience. Since we just got this configured, you’ll land on a fresh agent dashboard. Now, you’ll see the call is coming in, so, I’ll accept the call. Accepting the call opens the ongoing conversation page. Notice the live voice-to-text transcript happening in real time. And you can even determine your customer’s mood by looking at the customer sentiment at the top of the conversation.


– What happens if I want to have a different phone number, or maybe I want to bring in my own phone number to the service?


– You can either acquire a different phone number, or bring your existing one into the service. You can do that from the new Omnichannel admin center, just click Set up voice. And from there, you can configure your phone number or get a new one.


– Okay, so once that’s configured, your call center is now set up, but how does the routing work then to get to the right agent?


– So, that’s out-of-the-box, so, it’s also pretty easy. We actually showed that earlier in our example. Still in the Omnichannel admin center, I’ll click into the work distribution. These settings define how conversations should be allocated to agents within a queue. And now, we’re ready to add our Virtual Agent, the same one that I showed you earlier. To do that, I’ll select Add Bot, and from the dropdown list, I’ll select my Power Virtual Agent. Now, my phone number is linked to my Power Virtual Agent, and it’s ready to go.


– One thing to note here is that behind the scenes, we’re actually using Azure Communication Services that leverages the same enterprise-grade foundation for Microsoft Teams that brings in voice and PSTN calling and integration with Power Virtual Agents. Moving on further into our setup experience, another pivotal part of the experience that you showed was that escalation to the customer service agent from the bot and how they have the knowledge articles that they needed to troubleshoot further with the help of Smart Assist. How do you get all that working?


– Again, this is pretty easy to enable in the same admin center. Here, if I click into the Analytics and insights setting, you’ll see that I’ve already enabled Omnichannel historical analytics and topic clustering. Historical analytics gives you a complete view of your service organization with things such as caseload volume by channel, escalation rate, sentiment, and CSAT, just to name a few. And topic clustering uses natural language understanding to synthesize the root causes for why your customers are calling. And to get the matching Smart Assist knowledge articles to appear, you need to enable premium AI, which I’ll do by simply clicking into Manage. All I need to do to leverage Microsoft’s powerful machine learning models is to enable similar cases and knowledge article suggestions. I also have the option to update the data mapping to tailor results to how my organization collects data, but I’ll leave that for later and click Save and Close.


– Let’s switch gears to the field technician. What did you have to do to set up the mobile app? Was that easy to configure as well?


– There are just a couple steps to get that configured. With the latest update to field service, the mobile app will appear automatically in your tenant. So, here in the apps menu, from the Field Service Mobile app tile, we’ll select Manage roles, then choose all of the field service roles here, admin, dispatcher, inventory, resource manager, and save it. This will give anyone with the right permissions to access the application, using their existing field service login credentials. Now, we’ll open it in the app designer, and this is just like customizing any other power app. You just select the components you want to display, and those will be available to anyone who uses the app with appropriate permissions.


– And this is really an awesome example of how you can combine automation and intelligence and live personnel engagement to take customer support to the next level. But what would you recommend for the folks watching who want to learn more?


– So, in the interest of time, we showed you the core experience and setup, but we have much more detailed guidance on everything that I showed you, from setting up Dynamics 365 modules to configuring Dynamics 365 with Azure IoT, available at aka.ms/DynamicsAlwaysConnected.


– Thanks, Deanna, this is amazing stuff. And to get familiar with all of what’s possible with Dynamics 365, I really recommend that you check out our series with Vanessa Fournier at aka.ms/Dynamics365forIT. Be sure to subscribe to Mechanics if you haven’t already yet. Thanks for watching, we’ll see you next time.


Information Governance and Records Management is generally available to GCC, GCC High, and DoD

Information Governance and Records Management is generally available to GCC, GCC High, and DoD

This article is contributed. See the original author and article here.

Governing data is critical to adhere to compliance regulations. In a world where government employees work and provide public services remotely, information is stored across numerous devices in multiple disparate locations from on-premises to the cloud. This situation makes it challenging to secure and govern data and to comply with regulations.


Today we are excited to announce the general availability of Microsoft 365 Information Governance and Records Management for the Government Community Cloud (GCC), GCC High, and Department of Defense (DoD) customers. These capabilities provide government organizations with significantly greater depth in governing critical data. 


Information Governance 


Microsoft Information Governance helps government organizations manage risk by discovering, classifying, labeling, and deleting their data. It allows organizations and agencies to reduce risk by providing lifecycle management across their Microsoft 365 data.  


Records Management 


Records Management provides government organizations with the ability to manage content to meet regulatory requirements. With Records Management, government organizations can: 


  • Classify, retain, and manage content according to your retention schedule without compromising end-user productivity. 

  • Defensibly dispose of files, including review and approval. 

  • Demonstrate compliance with regulations through defensible audit trails and proof of destruction. 


Records Management is accessible in the Microsoft 365 Compliance Center. 


Picture3.jpg


  • Strike the right balance between governance and productivity: Records Management is built into Microsoft 365 collaboration and productivity tools, easing the friction between enforcing governance controls and user productivity. Users can work as they would typically, and records management happens in the background without the user being aware of it. You can accomplish this by using automatic retention policies based on the content, its metadata, the file location, or the presence of sensitive data. These different auto-classification methods provide the flexibility you need to manage the increasing volume of data. With Records Management, you can balance rigorous enforcement of data controls with helping your organization to be fully productive. Learn more about auto-applying retention. 


  • Build trust, transparency, and defensibility: Building trust and providing transparency is crucial to managing records. Microsoft Records Management includes disposition approval and proof of disposalfor all items deleted via a record label. Proof of disposal helps provide the defensibility you need to meet legal and regulatory requirements.  Learn more about content disposal. 

  • Help ensure immutability of files: Confidentiality, integrity, and availability of records are vital principles that must guide companies as they govern business-critical information. Highly regulated government agencies and contractors need the most stringent controls to ensure records integrity. Regulatory record labels further enhance immutability by preventing metadata changes, records movements, records versioning, and blocking users and admins from removing the label once applied. Learn more about regulatory record labels. 


Get started today 


We hope you are excited to try these new features of Microsoft Information Governance and Records Management. You can learn more about all these updates in our technical documentation. 


APPENDIX: 


As the advanced compliance specialist for Microsoft 365 compliance solutions, you can connect with me here. Check out other Microsoft 365 compliance resources for US government. 


Evaluate your CMMC postures with Compliance Manager in GCC, GCC High 


https://aka.ms/ComplianceManagerGovBlogMar21  


Microsoft CMMC Acceleration Program Update – January 2021 


https://aka.ms/CMMCAccelerationProgramUpdate  


Using Advanced Audit for your forensic investigation capability 


https://aka.ms/AdvAuditBlog  


Advanced eDiscovery demo for Gov cloud (video) 


https://aka.ms/GovAdvancedeDiscoveryVideo  


Enhanced regulatory, legal and forensic investigation capabilities now in the Government Cloud  


https://aka.ms/M365ComplianceforGovBlog  


Microsoft 365 Public Roadmap link to check status on upcoming Microsoft 365 compliance solution features  


Microsoft 365 Roadmap: Microsoft 365 compliance solutions 


[DevTest Labs] Decommissioning preview API's '2015-05-21-preview' & '2017-04-26-preview' in 90 days

This article is contributed. See the original author and article here.

There were a few preview API’s that were made available in the previous years for Azure DevTest Labs, with the goal of enabling early access to certain features and functionalities.


We have incorporated all the functionalities related to below preview API’s in the latest API specs, that were generally made available and we have decided to decommission below DTL preview API’s by June 17, 2021.


  •   2015-05-21-preview

  •   2017-04-26-preview


If you are still using any of the above preview API’s, We recommend to migrate and use the latest DTL REST API Specs that were generally made available. The decommissioning does not impact our current API version in preview, 2018-10-15-preview.


2015-05-21-preview’ and2017-04-26-previewAPI versions would be decommissioned on June 17, 2021 and if you are using the preview API’s, we request you to kindly migrate before June 17, 2021.


As always, please reach out to us in case of any questions or concerns.


–  DevTest Labs Product Team


Hidden Treasure Part 1: Additional Performance Insights in DISKSPD XML

Hidden Treasure Part 1: Additional Performance Insights in DISKSPD XML

This article is contributed. See the original author and article here.

Written by Jason Yi, PM on the Azure Edge & Platform team at Microsoft. 


Acknowledgements: Dan Lovinger


Imagine this, you have an Azure Stack HCI cluster set up and ready to go. But you have that lingering question: What is your cluster’s storage performance potential? In such cases, you can rely on micro-benchmarking tools such as DiskSpd. And if you are not aware, the tool helps you customize and configure your own synthetic workloads by tweaking built in parameters. For more information, you can read about it here.


“Visible” and Clean Data


Most folks who already have experience with DiskSpd are likely familiar with the txt output option, which is also displayed in the terminal. The purpose behind this output was to present the data in a human readable format. We also aggregated some of the finer details to generate practical metrics for the users. This also means that we determined which metrics would be considered valuable. But, did you know that there is an option to output in XML, which reveals additional, granular data such as the total IOs achieved per second.


Let’s first take a few moments to review the txt output. As you may know, this output is split into four different sections:


Input settings:


Picture1.png


CPU utilization details:


Picture2.png


Total IO performance metrics:


Picture3.png


Latency percentile analysis (-L parameter):


Picture4.png


This result produces a detailed view of a couple performance metrics. That’s great, but what if you are interested in other data insights? If you did not read carefully through the DiskSpd wiki page, you may have missed the fact that there is a “hidden feature.” There is another output format that generates an XML file. This can be invoked by the -Rxml parameter and piped into an XML file with your preferred file name. But wait, there’s more! If you peep into the XML file, you will notice that there is more data than what was originally shown in the txt output, such as the total IOs achieved per second. More specifically, the XML output reveals more granular data as opposed to the aggregated data for the human eyes. If you wish to take a look, be warned – your eyes will burn from the squinting.


Table of Contents: XML


Before your eyes burn, let’s create a brief table of contents for the XML file.


<System> Under this element, you have some basic information regarding the system itself, such as the server/VM name, DiskSpd version, number of processors, etc.


Picture5.png


<Profile> Under this element, you will find your input parameters from when you ran DiskSpd. To name a few, this includes the queue depth, thread count, warm up time, test duration, etc. There are quite a few sub-elements within this section. Luckily, most of them are self-explanatory, and so let us focus on a few of them.


  • <TimeSpans> Under this element, you will find <TimeSpan> elements. Each of those <TimeSpan> elements represent one DiskSpd test run. As you may have guessed, the content within <TimeSpan> contains a set of parameters that you, the user, specifies. For example, you can see that the <requestcount> element is set to 32 since we initially set the queue depth to be 32 when we ran DiskSpd. You can think of this section as being analogous to the “input settings” result in the txt output.


Picture6.png


<TimeSpan> This element is not to be confused with the above <TimeSpan> element. This section contains the results of your DiskSpd test. It is similar to the data presented in the txt file, but with added granular data. More specifically, you can view the CPU usage, IOPS statistics and latency statistics (average total milliseconds, standard deviation, etc.), in their respective sub-elements:


  • <CpuUtilization>

    • The CPU data is broken down per core.


  • <Latency>

    • The latency data is broken down into separate “buckets” where each bucket corresponds to 1 percentile rank, in ascending order from 0 to 100%.


  • <Iops>

    • The IOPS data is broken down into separate “buckets” where each bucket corresponds to the IO data for 1 millisecond.


Picture7.png


This may give rise to the question; can you modify the contents of this XML file and pipe it back into DiskSpd? Yes, you absolutely can! In fact, there is another parameter precisely for this purpose (-X). Here are the following steps to get you started: (great for batch testing!)


  1. Before using this parameter (-X), you will need to preserve the contents within the <Profile> element. Any other data that exists in the XML file may be discarded. If you plan to run the DiskSpd test with modified input parameters, be sure to make the appropriate changes in the <Profile> section.

  2. Optional: If you plan to run multiple DiskSpd tests, you can add more <TimeSpan> elements under <Profile>, with your desired input parameters.

  3. You can then run DiskSpd with the -X parameter which will take the XML file path as input and output a new XML (or txt) file with the newly generated result.


Picture8.png


Bonus: Script to Extract IOPS


In case you wanted to start somewhere, I’ve included a short script that takes in a DiskSpd XML output named “output.xml” and extracts the total IOs achieved per second into a neat CSV file for you to view (ensure they are in the same path). This might be a good place to start if you want to get more data insights about IOPS. **Foreshadowing**


Final Remarks


Hopefully, this provides a solution for those situations where you always wanted a more detailed form of data or to run DiskSpd batch tests. You can also imagine that there are a variety of ways you can manipulate the XML output through PowerShell scripts. Alas, this is for another day.


*Script Below*


# Written by Jason Yi, PM
# 12/2020


<#
.PARAMETER d
integer number of diskspd runs (can consider it as duration since each run is one second long)
.PARAMETER path
the path to the test file
.PARAMETER rw_flag
the default is 0. 0 represents that the user wants to input their custom read/write ratio whereas 1 represents that the user wants a randomized read/write ratio
.PARAMETER g_min
the minimum g parameter (g parameter is the throughput threshold)
.PARAMETER g_max
the maximum g parameter (g parameter is the throughput threshold)
.PARAMETER b
the block size in bytes
.PARAMETER r
random IO aligned to specified size in bytes
.PARAMETER o
the queue depth
.PARAMETER t
the number of threads
.PARAMETER w
the ratio of write tests to read tests
#>
Param (
[Parameter(Position=0,mandatory=$true)][int]$d,
[Parameter(Position=2,mandatory=$true)][string]$path, # C:ClusterStorageCSV01IO.dat
[int]$rw_flag = 0,
[int]$g_min = 0,
[int]$g_max = 8000,
[int]$b = 4096,
[int]$r = 4096,
[int]$o = 32,
[int]$t = 4,
[int]$w = 0)


Function Create-Timespans{
<#
.DESCRIPTION
This function takes the input number of diskspd runs (or duration) and lasts for that input number of seconds while randomizing
the throughput threshold within a specified range. Includes same parameters initially passed in by user.
#>
Param (
[int]$d,
[string]$path,
[int]$g_min,
[int]$g_max,
[int]$b,
[int]$r,
[int]$o,
[int]$t,
[int]$w,
[int]$rw_flag
)


[xml]$xml=@”
<Profile>
<Progress>0</Progress>
<ResultFormat>xml</ResultFormat>
<Verbose>false</Verbose>
<TimeSpans>
<TimeSpan>
<CompletionRoutines>false</CompletionRoutines>
<MeasureLatency>true</MeasureLatency>
<CalculateIopsStdDev>true</CalculateIopsStdDev>
<DisableAffinity>false</DisableAffinity>
<Duration>1</Duration>
<Warmup>0</Warmup>
<Cooldown>0</Cooldown>
<ThreadCount>0</ThreadCount>
<RequestCount>0</RequestCount>
<IoBucketDuration>1000</IoBucketDuration>
<RandSeed>0</RandSeed>
<Targets>
<Target>
<Path>$path</Path>
<BlockSize>$b</BlockSize>
<BaseFileOffset>0</BaseFileOffset>
<SequentialScan>false</SequentialScan>
<RandomAccess>false</RandomAccess>
<TemporaryFile>false</TemporaryFile>
<UseLargePages>false</UseLargePages>
<DisableOSCache>true</DisableOSCache>
<WriteThrough>true</WriteThrough>
<WriteBufferContent>
<Pattern>sequential</Pattern>
</WriteBufferContent>
<ParallelAsyncIO>false</ParallelAsyncIO>
<FileSize>1073741824</FileSize>
<Random>$r</Random>
<ThreadStride>0</ThreadStride>
<MaxFileSize>0</MaxFileSize>
<RequestCount>$o</RequestCount>
<WriteRatio>$w</WriteRatio>
<Throughput>0</Throughput>
<ThreadsPerFile>$t</ThreadsPerFile>
<IOPriority>3</IOPriority>
<Weight>1</Weight>
</Target>
</Targets>
</TimeSpan>
</TimeSpans>
</Profile>
“@


# 1 flag means that the user wishes to randomize the rw ratio
# 0 flag means that the user wishes to control the rw ratio
# Basically, throw an error when the flag is no 0 or 1
if ( ($rw_flag -ne 1) -and ($rw_flag -ne 0) ){
throw “Invalid rw_flag value. Please choose 0 to provide your own rw ratio, or 1 to randomize the rw ratio.

}


$path = Get-Location
# loop up until the number of runs (duration) and add new timespan elements
for($i = 1; $i -lt $d; $i++){


$g_param = Get-Random -Minimum $g_min -Maximum $g_max
$true_w = Get-Random -Minimum 0 -Maximum 100


# if there is only one timespan, add another
if ($xml.Profile.Timespans.ChildNodes.Count -eq 1){


# clone the current timespan element, modify it, and append it as a child
$new_t = $xml.Profile.Timespans.Timespan.Clone()
$new_t.Targets.Target.Throughput = “$g_param”
if ($rw_flag -eq 1){
$new_t.Targets.Target.WriteRatio = “$true_w”
}
$null = $xml.Profile.Timespans.AppendChild($new_t)


}
else{


# clone the current timespan element, modify it, and append it as a child
$new_t = $xml.Profile.Timespans.Timespan[1].Clone()
$new_t.Targets.Target.Throughput = “$g_param”
if ($rw_flag -eq 1){
$new_t.Targets.Target.WriteRatio = “$true_w”
}
$null = $xml.Profile.Timespans.AppendChild($new_t)


}
}


# show updated result
$xml.Profile.Timespans.Timespan
# save into xml file
$xml.Save(“$pathexpand_profile.xml”)


}
#
# SCRIPT BEGINS #
#


# create the xml file with diskspd parameters
Create-Timespans -d $d -g_min $g_min -g_max $g_max -path $path -b $b -r $r -o $o -t $t -w $w -rw_flag $rw_flag


# create path, input file, and node variables
$path = Get-Location
# feed profile xml to DISKSPD with -X parameter (Running DISKSPD)
Invoke-Expression “.diskspd.exe -X’$pathexpand_profile.xml’ > output.xml”

$file = [xml] (Get-Content “$pathoutput.xml”)


$nodelist = $file.SelectNodes(“/Results/TimeSpan/Iops/Bucket”)
$ms = $nodelist.getAttribute(“SampleMillisecond”)


# store the bucket objects into a variable
$buckets = $file.Results.TimeSpan.Iops.Bucket


# change the millisecond values to seconds
$time_arr = 1..$d
foreach ($t in $time_arr){
$buckets[$t-1].SampleMillisecond = “$t”
}


# select the objects you want in the csv file
$nodelist |
Select-Object @{n=’Time (s)’;e={[int]$_.SampleMillisecond}},
@{n=’Total IOs’;e={[int]$_.Total}} |
Export-Csv “$pathiops_stat_seconds.csv” -NoTypeInformation -Encoding UTF8 -Force # Have to force encoding to be UTF8 or data is in one column (UCS-2)


# import modified csv once more
$fileContent = Import-csv “$pathiops_stat_seconds.csv”


# if duration is less than 7 (number of percentile ranks), then add empty rows to fill that gap
if ($d -lt 7 ) {
for($i=$d; $i -lt 7; $i++) {
# add new row of values that are empty
$newRow = New-Object PsObject -Property @{ “Time (s)” = ” }
$fileContent += $newRow
}
}


# show output in the terminal
$fileContent | Format-Table -AutoSize


# export to a final csv file
$fileContent | Export-Csv “$pathiops_stat_seconds.csv” -NoTypeInformation -Encoding UTF8 -Force

Attack Surface Reduction Rules – Warn Mode with MEM/M365 Defender

Attack Surface Reduction Rules – Warn Mode with MEM/M365 Defender

This article is contributed. See the original author and article here.

Introduction 


This is John Barbare and I am a Sr Customer Engineer at Microsoft focusing on all things in the Cybersecurity space. In a previous blog back in July, 2020, I walked through a demo of setting up an Attack Surface Reduction (ASR) rule policy in Microsoft Endpoint Manager (MEM) for your Windows Operating Systems and how to view the detections once applied. 


Since then, Microsoft has introduced a new “Warn Mode” in addition to the Audit and Block modes previously. With that said, I will give a brief overview of ASR Rules, demo what the differences are in the different modes, show custom security notifications for your organization, and the hunt for ASR rule alerts in the new Microsoft 365 Defender unified portal. 


What are Attack Surface Reduction Rules? 


Attack surface reduction rules help prevent software behaviors that are often abused to compromise your device or network. For example, an attacker might try to run an unsigned script off a USB drive, or have a macro in an Office document make calls directly to the Win32 API. ASR rules can constrain these kinds of risky behaviors and improve your organization’s defensive posture to decrease your risk considerably from being attacked with Ransomware, various other types of malware, and other attack vectors.  


If you are evaluating or executing a proof of concept from a 3rd party HIPS (Host Intrusion Prevention System) over to ASR rules, this article will assist you in the planning, development, and proper configuration in MEM. With the complete end to end protection Microsoft offers, this article will focus on the Attack Surface Reduction component of Windows Defender Exploit Guard. Prevent actions and apps that are commonly used by malware, such as launching executables from email (.exe, .dll, .scr, .ps, .vbs, and .js).


  • Scripts or applications that launch child processes 

  • Most rules can be set to Audit to monitor activity prior to being set to enforce 

  • All rules support exclusions based on file or folder names 

  • ASR rules support environmental variables and wildcards 


ASR rules may block legitimate applications from making changes, so these features come with both an Audit mode and a Block mode and a newly released Warn mode. I always recommend to my customers when configuring ASR rules for the first time to conduct the changes in Audit mode first so it will allow for testing of the policy before moving any of the rules into Block mode. But now we can audit, then warn, before placing into block mode so our users know that a risky behavior is being detected. This is exactly like using SmartScreen where the user goes to website that is malicious, and is warned but given the choice to bypass or not continue at all. This is great before rolling out a new feature and will provide some great context around the warn mode feature.  


Warn mode  


With the new warn mode, whenever content is blocked by an ASR rule, users see a dialog box that indicates the content is blocked. The dialog box also offers the user an option to unblock the content. The user can then retry their action, and the operation completes. When a user unblocks content, the content remains unblocked for 24 hours, and then blocking resumes. Warn mode helps your organization have ASR rules in place without preventing users from accessing the content they need to perform their tasks. 


Supported OS for Warn Mode and Requirements 


Warn mode is supported on devices running the following versions of Windows OS: 


Microsoft Defender Antivirus must be running with real-time protection in Active mode. 


In addition, make sure Microsoft Defender Antivirus and antimalware updates are installed. 


  • Minimum platform release requirement: 4.18.2008.9 

  • Minimum engine release requirement: 1.1.17400.5 


Exceptions to Warn Mode 


The following three ASR rules are not supported in Warn Mode: 


  1. Block JavaScript or VBScript from launching downloaded executable content (GUID d3e037e1-3eb8-44c8-a917-57927947596d) 

  2. Block persistence through WMI event subscription (GUID e6db77e5-3df2-4cf1-b95a-636979351e5b)

  3. Use advanced protection against ransomware (GUID c1db55ab-c21a-4637-bb3f-a12568109d35) 


In addition, warn mode is not supported on devices running older versions of Windows. In those cases, ASR rules that are configured to run in warn mode will run in block mode. 


Setting up Warn Mode Using Microsoft Endpoint Manager 


The first item we want to do is make sure that all the devices we want to push the new ASR rule policy are showing up inside MEM admin center. This paper assumes you have enrolled all the devices for your preferred method, and we are checking to make sure the devices are shown before creating or pushing out a new policy. Navigate to the Microsoft Endpoint Manager admin center and login with your credentials. Once logged in you will arrive at the home page. 


MEM HomeMEM Home


Select “Devices” and then “All devices” to make sure the device you will be applying the new ASR rule Policy has been synchronized. 


All Devices PageAll Devices Page


Next, we will select the “Endpoint Security” tab which is under the “Device” tab. 


Endpoint Security HomeEndpoint Security Home


This will bring you into the main policy dashboard to create the new ASR Warn rule policy. First you will select “Attack Surface Reduction” under the “Manage” tab. Select “create policy” at the top, and then a window will open to pick the operating system “Platform” and “Profile”. For “Platform”, select Windows 10 and later and for “Profile”, select Attack Surface Reduction Rules and click “Create” at the bottom.  


Creating the Profile/PolicyCreating the Profile/Policy


This will bring you to the creation of the profile for ASR. Name the profile in the “basics” tab and then provide a brief description and click next. 


Name the ProfileName the Profile


Configuration Settings 


The next tab, “Configuration settings” is where you will configure the ASR rules. Here we have placed all the ASR rules in warn except the ones that are not allowed. From selecting the third ASR rule, one can see all the settings for the rule including the new Warn mode. You can also search for a setting in the top box underneath the settings and before the ASR rules. After placing them in the correct mode, select next.  


Selecting Warn Mode for the ASR Rule PolicySelecting Warn Mode for the ASR Rule Policy


Assignments 


Next, we will have the option to assign the policy to select groups, all users, all devices, or all users and devices. Here we are targeting just a select group and will pick the IT Group for this new policy. Selecting the groups to include and IT Group will target the devices inside the group and then click select and then click next. This is the equivalent to applying a policy to an organizational unit in Group Policy Objects.  


Adding AssignmentsAdding Assignments


Many users ask when to use user groups and when to use device groups. The answer depends on your goal. Use device groups when you do not care who is signed in on the device, or if anyone is signed in. You want your settings to always be on the device. Use user groups when you want your settings and rules to always go with the user, whatever device they use. 


Review and Create 


Now let’s head over to finalizing up the newly created profile on the review and create profile page. You will see all the settings for our new Warn ASR policy, and you can confirm before selecting create. Go ahead and click on create to save the new ASR policy. 


Creating the ProfileCreating the Profile


 The next page will bring you to the summary page where you can view the new ASR rule policy you just created. When you select the policy name that you have created, you will be redirected to the overview page which will display more detailed information. 


Viewing the new ProfileViewing the new Profile


When you select a tile from this view, MEM displays additional details for that profile if they are available. In this case, it applied my new ASR Rule Warn Mode policy to my lab test machine that I targeted successfully.  


Profile Synced to Targeted MachineProfile Synced to Targeted Machine


Testing Out the New Warn Mode 


In my lab, I will test out one of the rules to show you what Warn mode looks like when triggering an ASR Rule with my newly applied ASR Warn mode policy. In the first instance I have a malicious Microsoft Word Document that will create multiple child processes. As seen below, I open the document and then bypass the security warning and click on Enable Content. 


Bypassing Security WarningBypassing Security Warning


After bypassing the alert, a Windows Security notification is presented with a dialog box that indicates the content is blocked. The dialog box also offers me the new option to unblock the content. The dialog box below has been increased in size to show you the full warning.  


Warn Mode NotificationWarn Mode Notification


If the ASR Policy would have been in Block mode, the below dialog box would have been presented to the user.  


Block Mode NotificationBlock Mode Notification


As one can see during testing or implementation of ASR Rules, you can see the real value of using Warn mode versus going strait to Audit and then full Block mode. This way you can let your users know you will be implementing a new security policy and they will be warned before full implementation. 


Customizing the Dialog Box 


If your organization wants to display a customized notification from Windows Security to display options to call, email, or redirect the user to a help portal, the instructions can be found here. I will not walk through the steps, but the screenshot below depicts what a customized notification would look like when an ASR Rule or any other Windows Security notification is displayed.  


Customized Dialog Box from DefenderCustomized Dialog Box from Defender


Advanced Hunting with ASR Rules in Microsoft 365 Defender 


Microsoft Defender 365 provides detailed reporting for events as part of its alert investigation scenarios. You can query Microsoft Defender 365 data by using advanced hunting using KQL (Kusto Query Language).  Login into Microsoft 365 Defender and select Hunting and then Advanced Hunting blade at the top. The query we will run is the following: 


DeviceEvents 


where ActionType startswith ‘Asr’ 


Advanced Hunting for ASR TriggersAdvanced Hunting for ASR Triggers


Monitoring the ASR Rules in Microsoft 365 Defender 


In the same window, select Configuration Management blade under Endpoints and then select Go to Attack Surface Management. Select the detections tab to see a more fine-grained ASR rule detection graph in Audit and Block mode over a period time and what has been detected.  


Microsoft 365 Defender ASR Rule Line Chart TriggersMicrosoft 365 Defender ASR Rule Line Chart Triggers


Conclusion 


Thanks for taking the time to read this article and I hope you understand the new Warn mode for ASR rules and how you can use it in your organization during testing and pre-implementation. Using the new unified portal – Microsoft Defender 365 – to hunt for ASR detections and see a graph of what is getting triggered will further show the value for any IT Manager the value of the Microsoft 365 security stack. Hope to see you in the next blog and always protect your endpoints! 


Thanks for reading and have a great Cybersecurity day! 


Follow my Microsoft Security Blogs: http://aka.ms/JohnBarbare  and  also on LinkedIn.