by Contributed | Apr 15, 2021 | Technology
This article is contributed. See the original author and article here.
By Mark Hopper – Program Manager II | Microsoft Endpoint Manager – Intune
Microsoft Intune has the capability to integrate and connect with numerous external services. These connectors can include Microsoft services such as Microsoft Defender for Endpoint, third–party services such as Apple Business Manager, on–premises integrations such as the Certificate Connector for Intune, and many more.
Monitoring the health of an Intune environment is often a common focus for Microsoft Endpoint Manager customers. Today, admins can check their Intune tenant’s connector health using the Tenant Status page in the Microsoft Endpoint Manager admin center. However, many customers have expressed interest in exploring what options are available to proactively notify their teams when an Intune connector is determined to be unhealthy.
This blog will walk through the configuration steps to create an automated cloud flow using Power Automate that will notify a team or an individual when an Intune connector is unhealthy. The walkthrough will use the NDES Certificate Connector as an example, but this same flow logic can be leveraged across all Intune connectors in your environment. If you are not familiar with Power Automate, it’s a “low-code” Microsoft service that can be used to automate repetitive tasks to improve efficiencies for organizations. These automated tasks are called flows.
While the flow outlined in this blog will use email as the example notification method, keep in mind that flexibility and customization is key here. You can implement alternative notification methods that best aligns with your organization’s workflows such as mobile push notifications to the Power Automate app, Microsoft Teams channel posts, or even generating a ticket in your Helpdesk system if it can integrate with Power Automate. You can find a list of services that have published Power Automate connectors here.
Requirements
- Azure Active Directory
- Microsoft Intune
- Microsoft Power Automate
Note: The example flow in this blog leverages the HTTP action, which is a premium connection action. For more information on Power Automate licensing, see the page
Permission
|
Graph Endpoints
|
Intune Connector
|
DeviceManagementConfiguration.Read.All
|
ndesConnector
androidManagedStoreAccountEnterpriseSettings
|
NDES
Managed Google Play
|
DeviceManagementServiceConfig.Read.All
|
applePushNotificationCertificate
vppToken
depOnboardingSettings
windowsAutopilotSettings
mobileThreatDefenseConnector
|
APNS Certificate
VPP Tokens
DEP Tokens
Autopilot
MTD
|
- Perform an HTTP GET request to each connector’s Microsoft Graph REST API endpoint.
- Parse the JSON response returned from Graph API.
- If there can be multiple connectors for a given Graph endpoint, use an Apply to each step. For example, only one APNS cert can be configured per Intune tenant, so an Apply to each would not be required. However, there can be numerous VPP tokens or NDES Connectors in a given tenant, so this step will loop through each connector returned in the response.
- Evaluate each connector’s health state.
- If determined to be unhealthy, send an email notification to a specified email address to notify the relevant admin or team.
Create a Power Automate flow to evaluate Intune Connector health
- To begin, open the Power Automate admin console, create a new scheduled cloud flow. For this example, the flow is configured to run once an hour.
 Creating a new Power Automate flow in the Power Automate admin console.
Note: Ensure to not run this flow on an overly aggressive schedule to reduce the risk of throttling! Graph API and Intune service-specific throttling limits can be found here: Microsoft Graph throttling guidance. Power Platform request limits and allocations can be found here: Requests limits and allocations.
- Create a new HTTP action under the reoccurrence trigger using Active Directory OAuth as your authentication method. This action will retrieve the NDES Connectors by querying the https://graph.microsoft.com/beta/deviceManagement/ndesConnectors endpoint. In this example, this step is named “Get NDES Connectors”.
 HTTP action properties for the ndesConnectors flow.
Method: GET
URI: https://graph.microsoft.com/beta/deviceManagement/ndesConnectors
Authentication: Active Directory OAuth
Authority: https://login.microsoft.com
Tenant: Directory (tenant) ID from Overview blade in your Azure AD App Registration
Authority: https://graph.microsoft.com
Client ID: Application (client) ID from Overview blade in your Azure AD App Registration
Credential type: Secret
Secret: Secret key value generated while configuring the Azure AD App Registration.
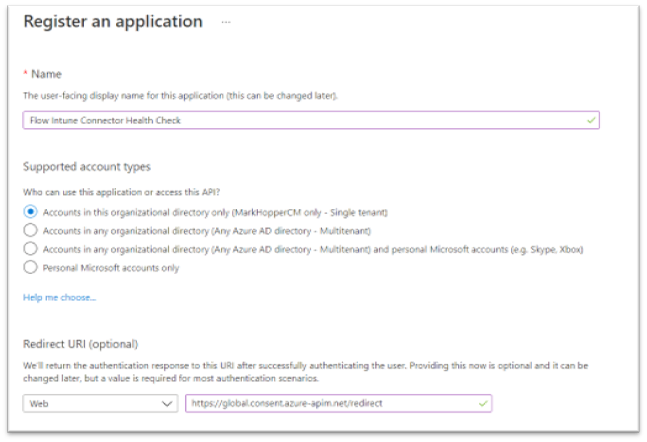
 Overview of the Flow Intune Connector Health Check.
 Secret key value generated while configuring the Azure AD App Registration.
- Create a new step to parse the JSON response returned from the GET request using the Parse JSON action. This will allow the flow to use values returned from our HTTP request for our connector health evaluation, as well as our notification message.
Content: Use the ‘Body’ dynamic content value generated from the previous step.
Schema: You can find the JSON schema by running a test GET request in Graph Explorer, and using the response to generate the schema. For example, run the following query in Graph Explorer: https://graph.microsoft.com/beta/deviceManagement/ndesConnectors.
 Example GET request in Graph Explorer for the “ndesConnectors” query.
This should return a JSON response. Copy this JSON response and paste it into Generate from sample in your Parse JSON step. This should generate the following schema, which will allow the flow to use the values in the JSON response such as state and lastConnectionDateTime as Dynamic Values in future steps to check if our connector is healthy. Here is what the JSON schema generated from the response should look like:
{
    "type": "object",
    "properties": {
        "@@odata.context": {
            "type": "string"
        },
        "value": {
            "type": "array",
            "items": {
                "type": "object",
                "properties": {
                    "id": {
                        "type": "string"
                    },
                    "lastConnectionDateTime": {
                        "type": "string"
                    },
                    "state": {
                        "type": "string"
                    },
                    "displayName": {
                        "type": "string"
                    }
                },
                "required": [
                    "id",
                    "lastConnectionDateTime",
                    "state",
                    "displayName"
                ]
            }
        }
    }
}
- Create a Condition step to check the NDES Connector health. For this step, the only condition to check is to see if state is not equal to active. Your health check should look similar to this:
 Condition step to check the NDES Connector health.
Note: When you set the Condition step, the flow will automatically create an Apply to each step (think of it as a for-each loop). The reason for this behavior is that the “Parse NDES Connector Response” step returns an array which could contain multiple NDES connectors. The Apply to each step ensures each NDES Connector in the response has ran through the health check.
- Next, create a step to send an email to your specified email address if the connector is determined to be unhealthy using the Send an email notification (V3) action. In this example, the email body is customized to include details such as the display name of the connector that is unhealthy, last connection time, and additional troubleshooting resources.
 Email notification check to send a customized email notification.
- Save, and test the flow. If your NDES connector is in an unhealthy state, the email addresses specified should receive a message similar to this:
 Example screenshot of an email notification sent to an admin.
Note: If your connector is currently active and healthy, but you want to test the email notification, temporarily set your health check condition to check for a state that would return “Yes”. For example, state is equal to active. Make sure to switch this back once you have confirmed the notification is sent as expected.
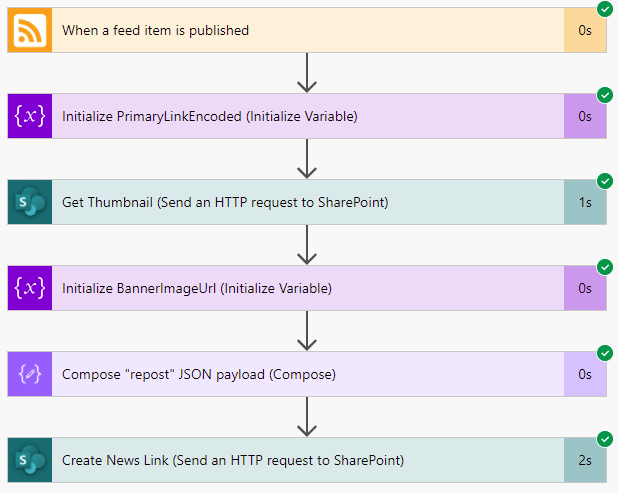
You should now have a working automated cloud flow that scans Graph for NDES connector details, checks the connector’s health, and sends out an email notification if the connector is determined to be in an unhealthy state on an hourly schedule. The completed flow should look like this:
 Overview of a working automated cloud flow that scans Graph for NDES connector details.
- Now, you can apply these same set of steps for the remaining Intune connectors in your environment. Either in different flows, or as parallel branches under the same recurrence.
 Additional Intune connector resources you could add in your environment.
Connector Health Check Examples
Properties that can be used to determine each connector’s health status can be found in Microsoft’s Graph API documentation for Intune.
For commonly used Intune connectors, here are some health check examples that can be used or built on for the health check Condition step, as well as their Graph URI endpoints for the HTTP step:
Apple Push Notification Certificate
URI: https://graph.microsoft.com/beta/deviceManagement/applePushNotificationCertificate
expirationDateTime is less than addToTime(utcNow(), 61, ’day’)
Apple VPP Tokens
URI: https://graph.microsoft.com/beta/deviceAppManagement/vppTokens
lastSyncStatus is equal to failed
or
state is not equal to valid
Apple DEP Tokens
URI: https://graph.microsoft.com/beta/deviceManagement/depOnboardingSettings
lastSyncErrorCode is not equal to 0
or
tokenExpirationDateTime is less than addToTime(utcNow(), 61, ’day’)
Managed Google Play
URI: https://graph.microsoft.com/beta/deviceManagement/androidManagedStoreAccountEnterpriseSettings
bindStatus is not equal to boundAndValidated
or
lastAppSyncStatus is not equal to success
Autopilot
URI: https://graph.microsoft.com/beta/deviceManagement/windowsAutopilotSettings
syncStatus is not equal to completed
or
syncStatus is not equal to inProgress
Mobile Threat Defense Connectors
URI: https://graph.microsoft.com/beta/deviceManagement/mobileThreatDefenseConnectors
partnerState is not equal to enabled
or
partnerState is not equal to available
Considerations
You can create a flow for each individual Intune connector, or you can create parallel branches under your recurrence trigger that check multiple connectors’ health in the same flow.
For example, you may not want to check your Managed Google Play connector in the same flow as your NDES connector. Or, you may want to check your DEP token expiration on a different cadence than your DEP token sync status. Flexibility is key here- use what works best for your organization!
Without custom connector
|
With custom connector
|
- Leverages Azure AD application permissions.
- HTTP requests will run without administrative user credentials. These will continue to operate as long as the Azure AD Enterprise App secret key being used is valid.
|
- Leverages Azure AD delegated permissions.
- HTTP requests will be run using an administrator account who has proper permissions to check the respective Intune connector health. The connector may fail to run and require reauthentication if the account used for the connection has a password change, access tokens revoked, or needs to satisfy an MFA requirement. In this blog, we executed Graph API requests using the HTTP action without creating a Graph API custom connector. However, an alternative method could be creating for Graph, and configuring the HTTP requests as custom actions to read the Graph Intune connector endpoints. Here are some considerations when deciding which method may work best for your organization:
|
More information can be found here: 30DaysMSGraph – Day 12 – Authentication and authorization scenarios.
- Not all connectors can have multiple instances. For example, an Apply to each step will not be necessary for the APNS certificate health check. Since only one APNS can be configured in a tenant at a time, an array would not be returned in the JSON response.
- For health checks where you are evaluating connector or token expirations, you should customize your health checks based on your organization’s needs. For example, the Microsoft Endpoint Manager admin center will start flagging a DEP token or APNS certificate as nearing expiration when the expiration date is 60 days away. However, you may prefer to check for and send these notifications a few weeks or a month in advance rather than 60 days, every hour until it is renewed.
- Consider leveraging secure inputs and outputs for steps in the flow that handle your Azure AD app’s secret key. By default, in Power Automate, you can see inputs and outputs in the run history for a flow. When you enable secure inputs and outputs, you can protect this data when someone tries to view the inputs and outputs and instead display the message “Content not shown due to security configuration.”
- In addition to secure inputs and outputs, consider leveraging Azure Key Vault and the Azure Key Vault Power Automate Connector to handle storage and retrieval of your Azure AD app’s secret key. Keep in mind that actions for this connector will be run using an administrator account who has proper permissions to check the respective Key Vault. The connector may fail to run and require reauthentication if the account used for the connection has a password change, access tokens revoked, or needs to satisfy an MFA requirement.
You should now have an understanding of how you can leverage Power Automate and Graph API to proactively notify your team when an Intune connector is in an unhealthy state. Please let us know if you have any additional questions by replying to this post or by reaching out to @IntuneSuppTeam on Twitter.
Additional Resources
For further resources on Graph API, Power Automate, and Intune connectors, please see the links below.
by Contributed | Apr 15, 2021 | Technology
This article is contributed. See the original author and article here.
As we continue to evolve the Universal Print Microsoft Graph API, we’ve changed and replaced some API endpoints and data models to refine the way apps and services interact with the Universal Print platform.
Additionally, all Universal Print APIs now require permission scopes. The documentation for each API endpoint lists permission scopes that grant access.
For a full list of available permissions, see the Universal Print permissions section of the Microsoft Graph permissions reference. Delegated permissions grant capabilities on behalf of the user currently logged in, and application permissions grant permissions that can access the data of all users in a tenant.
What you need to know
These changes may break any applications and services that rely on the Beta version of Microsoft Graph. If your application is running in production and relies on the Universal Print Microsoft Graph API, we recommend using v1.0 which will never have breaking changes.
Time to take action
Please review the API usage of your applications and ensure that you are not relying on any of the deprecated endpoints. Removal of deprecated endpoints will begin on July 1, 2021.
To see the list of deprecated and changed APIs, see the Microsoft Graph Changelog. Use the filtering controls to select the following options:
- Versions: beta
- Change type: “Change” and “Deletion”
- Services: Devices and apps > Cloud printing
Learn more
To learn more about Universal Print, visit out the Universal Print site.
by Contributed | Apr 15, 2021 | Technology
This article is contributed. See the original author and article here.
There’s a blog for that
A somewhat common complaint I’ve heard from organizations I’ve worked with is that folks within the organization frequently are unaware of press releases, blogs, or other information the organization is publicly sharing. In fact, I’m guilty of it as well. On numerous occasions, I’ve gone to a coworker for some quick troubleshooting only to be told “I wrote a blog for that”.
Now that Microsoft Viva Connections is here, I’ve been putting a lot of energy into my company’s SharePoint home site and trying to come up with ways to break down the information silo’s we’ve just naturally accrued over the years.
Fortunately, it turned out that our company blog already had an RSS feed setup, which opened up some opportunities, one of which was to create a flow in Power Automate that automatically creates a SharePoint “News Link” in our home site whenever a new blog post is published to our public site.
So, with this blog, we’ll walk through the steps used to accomplish that feat.
Triggered
As with any flow, we need something to kick things off. I was afraid that this was going to be the biggest technical challenge but, thankfully, it turns out that there is a trigger purpose built to do exactly what we need: the When a feed item is published trigger!

As you can see, the configuration here is dead simple. You simply provide it the URL to an RSS feed and select either the PublishDate or UpdatedOn values. We’ll stick with the default PublishDate setting so that we’re only being triggered by brand new articles.
So, with this configuration, our flow will be executed anytime a new article is published to the XBOX news RSS feed.
Once triggered, seemingly regardless of the specific RSS feeds schema, a standardized JSON object is returned to the flow that gives us most of what we need.
{

    “body”: {

        “id”: “https://news.xbox.com/en-us/?p=152438”,

        “title”: “Wasteland 3: The Battle of Steeltown Releasing June 3 “,

        “primaryLink”: “https://news.xbox.com/en-us/2021/04/15/wasteland-3-the-battle-of-steeltown-releasing-june-3/”,

        “links”: [

            “https://news.xbox.com/en-us/2021/04/15/wasteland-3-the-battle-of-steeltown-releasing-june-3/”

        ],

        “updatedOn”: “0001-01-01 00:00:00Z”,

        “publishDate”: “2021-04-15 14:00:00Z”,

        “summary”: “The Wasteland 3 team here at inXile is very excited to announce the first narrative expansion for Wasteland 3: The Battle of Steeltown will be releasing June 3. Since the game’s launch last August, we’ve been working on adding new features, quality of life changes, and fixing bugs and improving game stability and performance. But […]”,

        “copyright”: “”,

        “categories”: []

    }

}
Even better, this data gets turned into variables we can access through the Dynamic Content selector in Power Automate.

Take a picture, it’ll last longer
One thing we don’t get is any sort of image to show, which is a bummer because without them, all of our News Links would end up looking like the below image.

Thankfully, SharePoint has a handy-dandy little service hidden away that can help.
If you ever created a new “News Link”, you’ll know that you simply give SharePoint the URL to your article and it auto-magically snags the title, summary and a thumbnail image to use. If you open up your browser’s developer tools, you can see that SharePoint calls this _api/SP.Publishing.EmbedService/EmbedData endpoint, passing along an encoded URL and some additional query strings. It turns out that this is what handles all that ‘magic’ and it’s also something we can leverage for our own ends here!
Thanks to the output of our trigger, we know the URL of the blog post we’re working with, and we can access it through the  variable. However, we do need to make sure that the URL is in the right format, so we’ll create our own variable to make it so.

We’ll call it PrimaryLinkEncoded, make it a string, and initialize its value using the following expression: concat(‘%27’,encodeUriComponent(triggerOutputs()?[‘body/primaryLink’]),’%27′)
Once run, we’ll end up with an encoded URL surrounded by apostrophes, which is what the EmbedData service expects.
Now that we have that we just need to call the aforementioned service using the Send an HTTP request to SharePoint action.

We’ll be making a GET request to the root of our SharePoint site. Technically, this could be any SharePoint site you have access to, but since we’ll be posting news articles to our home site, we’ll just stick with that.
For the Uri configuration, we’re calling the previously mentioned service with a few required query string parameters like so: _api/SP.Publishing.EmbedService/EmbedData?url=@{variables(‘PrimaryLinkEncoded’)}&version=1&bannerImageUrl=true
We’re passing along the encoded URL we created in the last step, specifying version 1 (which is required, despite their only being one version) and we’re asking for the bannerImageUrl to be included (otherwise we’re not getting )
We only need to include one header, the accept header, with a value of application/json;odata.metadata=minimal.
Finally, to make things a bit easier to use in a moment, we’ll capture the output of this request into a variable using the Initialize Variable action again, like so.

We’re creating a new string variable named BannerImageUrl and we’re setting its value using the following expression: outputs(‘Get_Thumbnail’)?[‘body’]?[‘d’]?[‘ThumbnailUrl’]
Compose yourself
Now that we’ve got just about everything we can get, we need to put into the format that SharePoint expects when creating a News Link item, so it’s time to prepare our payload using the Compose action.

It’s a fairly simply and (mostly) self-explanatory bit of JSON, so we won’t dwell on it much. Below is the exact JSON used in the above screenshot.
{

  “BannerImageUrl”: @{variables(‘BannerImageUrl’)},

  “Description”: @{triggerOutputs()?[‘body/summary’]},

  “IsBannerImageUrlExternal”: true,

  “OriginalSourceUrl”: @{triggerOutputs()?[‘body/primaryLink’]},

  “ShouldSaveAsDraft”: false,

  “Title”: @{triggerOutputs()?[‘body/title’]},

  “__metadata”: {

    “type”: “SP.Publishing.RepostPage”

  }

}
Spread the word
The only thing left to do now is make our post, which will do by using another Send an HTTP request to SharePoint action, shown below.

This time, we’ll be making a POST to the _api/sitepages/pages/reposts endpoint (which is what SharePoint does when you post a news link).
Our headers are only slightly more involved. Our endpoint is expecting to receive and will return JSON, so we need to include the appropriate headers…
{

  “accept”: “application/json”,

  “content-type”: “application/json;odata=verbose;charset=utf-8”

}
Last but not least, we need to include the Output of the compose action we created in the previous step so that SharePoint knows what we’re sharing.
Once that’s all setup, go ahead and save.
Wrapping up
At this point, you’re done developing. The only thing left to do is wait, really. Once new items are published to the RSS feed, you’ll eventually see them start showing up in your News web parts!

by Contributed | Apr 15, 2021 | Technology
This article is contributed. See the original author and article here.
Written by Jason Yi, PM on the Azure Edge & Platform team at Microsoft.
Acknowledgements: Dan Lovinger, Principal Software Engineer
On the last episode of discovering hidden treasure, we took a closer look at what type of data lies within the DiskSpd XML output. Today, we will examine an example of how to take advantage of that data and create new and practical insights.
DiskSpd on Azure
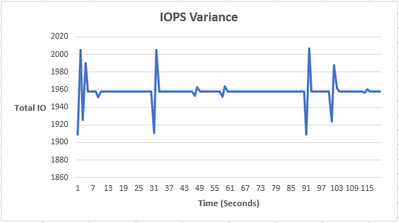
Let’s say that we are using Azure VMs to simulate some workload using DiskSpd. To visualize the data, let’s go ahead and use a short script that takes the XML output and extracts the total IOs per bucket into a CSV file for a more graphical view.
As you can see, the IOPS are relatively constant, with an occasional bump. The reason is because we are maxing out the total number of IOPS on our Azure environment (3-node cluster using Standard B2ms) can handle. Azure also artificially throttles the IOPS limit based on your VM size and drive type. In our case, the VM limit is 1920 IOPS and you can see that our peak is ~1950 IOPS. The occasional spike and drop in IOPS is likely due to Azure attempting to rebalance itself and locate the throttle limit.
Using Azure VMs, we can see that the IOPS values are relatively constant, but that’s not very interesting nor is it representative of a real workload. The workloads in the real world are much messier and random. Perhaps there is a way to replicate random IO activity to represent a typical day to day activity. Well, you are in luck, because there is a script for that – Let’s try it!
Randomize IOPS experiment
Note: The IOPS variance is purely artificial and for educational purposes only. By no means does this replicate any real-world IO scenario.
To help demonstrate this experiment, I’ve written a short script called “iops_randomizer.ps1”, to simulate random IO activity. The script uses a set of parameters to run DiskSpd in short, one second bursts. The IO values are randomized each second by using the (-g) parameter to throttle the throughput, which in turn affects the IOPS limit. Here are the parameters for the script:
- -d (mandatory) = The number of DiskSpd tests. Because each test run corresponds to one second, you can think of this as the total duration of the script.
- -path (mandatory) = the path to the test file.
- -rw_flag = Takes in one of two options, zero or one. 0 represents that the user wants to input their custom read/write ratio whereas 1 represents that the user wants a randomized read/write ratio, without providing the -w parameter value. The default selection will be 0 and if the user does not provide a complementary -w parameter value, the script will use a default value of -w 0 (100% read).
- -g_min = The minimum value possible when randomizing the throughput (defines the min range). The default value is 0 bytes per milliseconds.
- -g_max = The maximum value possible when randomizing the throughput (defines the max range). The default value is 8000 bytes per milliseconds.
- -b = The block size in bytes. The default is 4096 bytes (4KiB).
- -r = The random I/O aligned to the specified size in bytes. The default is 4096 bytes (4KiB).
- -o = The outstanding IO requests per target per thread. The default is 32.
- -t = The number of threads per target file. The default is 4.
- -w = The percentage of operations that are write requests. The default is 0% writes, 100% reads.
Note: You may find that your IOPS values are ridiculously small. This is because the default parameters are not optimized to your powerful environment. Consequently, you may need to experiment with the (-g) parameter range. Remember that because they are in bytes per milliseconds, you will need to perform some unit conversion to confirm that you are efficiently randomizing your values.
Here is the conversion I used:

Let’s now try running the following script:

After about 120 seconds, you should see 3 files in your current directory.
- expand_profile.xml : This file is created when the script is first run and contains all the DiskSpd test runs with their respective parameters. This is later fed into DiskSpd as an input. As a result, the file only contains the <Profile> element. You may use this file to modify any parameters you desire and feed it back into DiskSpd.
- output.xml : This is the finalized output file that is created after the DiskSpd test is complete.
- iops_stat_seconds.csv : This file contains the clean data for the number of IOs for each second the DiskSpd test was run.
Now that we have the csv output, we can create a graph that plots total IO vs time (seconds). We now have some variance in the number of IOs!

IO Percentiles
As you’ve just seen, there is potential in experimenting with the xml output. Perhaps you wish to derive other data that may be valuable for your situation. For example, maybe we want to examine the percentile values of the IO operations. Let’s actually try it, we have a second script called “get_iops_percentile.ps1” that takes the iops_stat_seconds.csv file and calculates the percentile scores for the IO values. After running the script, you should see a file called iops_percentiles.csv as well as a copy of the output on the PowerShell terminal.

These percentile values can help us understand the different segmentations of IO values, gauge the average IO output for each second, and identify trends. In our example, we can see that 99% of the IOPS are less than ~1635.
Bonus: rw_flag
This section is to provide more information on the rw_flag to clear up any potential confusion. You may be wondering what is the difference between using 0 and 1?
The main difference is that with an rw_flag of 0, you the user, can provide an additional write to read ratio parameter (-w) value. For example, if you provide 30, this means 30% of the IO will be writes and 70% of the IO will be reads. This also means that every DiskSpd test will use 30 as the write to read ratio, producing a consistent result between read IOs and write IOs in the long run.
However, with an rw_flag of 1, the user does not need to specify any read/write ratio. Instead, the ratio is randomized each second between 0% and 100%.
Using the performance monitor within Windows Admin Center, the result may look something like this: (left side uses rw_flag=0, right side uses rw_flag=1)

Final remarks
Today’s experiment was one example of extrapolating new data from the XML output. If you believe DiskSpd is not giving you a specific metric and wish to infer other data, this may be one method of manually discovering new “treasures.” Have fun!
*Script 1: iops_randomizer*
# Written by Jason Yi, PM

<#
.PARAMETER d
integer number of diskspd runs (can consider it as duration since each run is one second long)
.PARAMETER path
the path to the test file
.PARAMETER rw_flag
the default is 0. 0 represents that the user wants to input their custom read/write ratio whereas 1 represents that the user wants a randomized read/write ratio
.PARAMETER g_min
the minimum g parameter (g parameter is the throughput threshold)
.PARAMETER g_max
the maximum g parameter (g parameter is the throughput threshold)
.PARAMETER b
the block size in bytes
.PARAMETER r
random IO aligned to specified size in bytes
.PARAMETER o
the queue depth
.PARAMETER t
the number of threads
.PARAMETER w
the ratio of write tests to read tests
#>
Param (
[Parameter(Position=0,mandatory=$true)][int]$d,
[Parameter(Position=2,mandatory=$true)][string]$path, # C:ClusterStorageCSV01IO.dat
[int]$rw_flag = 0,
[int]$g_min = 0,
[int]$g_max = 8000,
[int]$b = 4096,
[int]$r = 4096,
[int]$o = 32,
[int]$t = 4,
[int]$w = 0)

Function Create-Timespans{
<#
.DESCRIPTION
This function takes the input number of diskspd runs (or duration) and lasts for that input number of seconds while randomizing
the throughput threshold within a specified range. Includes same parameters initially passed in by user.
#>
Param (
[int]$d,
[string]$path,
[int]$g_min,
[int]$g_max,
[int]$b,
[int]$r,
[int]$o,
[int]$t,
[int]$w,
[int]$rw_flag
)


[xml]$xml=@"
<Profile>
<Progress>0</Progress>
<ResultFormat>xml</ResultFormat>
<Verbose>false</Verbose>
<TimeSpans>
<TimeSpan>
<CompletionRoutines>false</CompletionRoutines>
<MeasureLatency>true</MeasureLatency>
<CalculateIopsStdDev>true</CalculateIopsStdDev>
<DisableAffinity>false</DisableAffinity>
<Duration>1</Duration>
<Warmup>0</Warmup>
<Cooldown>0</Cooldown>
<ThreadCount>0</ThreadCount>
<RequestCount>0</RequestCount>
<IoBucketDuration>1000</IoBucketDuration>
<RandSeed>0</RandSeed>
<Targets>
<Target>
<Path>$path</Path>
<BlockSize>$b</BlockSize>
<BaseFileOffset>0</BaseFileOffset>
<SequentialScan>false</SequentialScan>
<RandomAccess>false</RandomAccess>
<TemporaryFile>false</TemporaryFile>
<UseLargePages>false</UseLargePages>
<DisableOSCache>true</DisableOSCache>
<WriteThrough>true</WriteThrough>
<WriteBufferContent>
<Pattern>sequential</Pattern>
</WriteBufferContent>
<ParallelAsyncIO>false</ParallelAsyncIO>
<FileSize>1073741824</FileSize>
<Random>$r</Random>
<ThreadStride>0</ThreadStride>
<MaxFileSize>0</MaxFileSize>
<RequestCount>$o</RequestCount>
<WriteRatio>$w</WriteRatio>
<Throughput>0</Throughput>
<ThreadsPerFile>$t</ThreadsPerFile>
<IOPriority>3</IOPriority>
<Weight>1</Weight>
</Target>
</Targets>
</TimeSpan>
</TimeSpans>
</Profile>
"@


# 1 flag means that the user wishes to randomize the rw ratio
# 0 flag means that the user wishes to control the rw ratio
# Basically, throw an error when the flag is no 0 or 1
if ( ($rw_flag -ne 1) -and ($rw_flag -ne 0) ){
throw "Invalid rw_flag value. Please choose 0 to provide your own rw ratio, or 1 to randomize the rw ratio.
"
}

$path = Get-Location
# loop up until the number of runs (duration) and add new timespan elements
for($i = 1; $i -lt $d; $i++){

$g_param = Get-Random -Minimum $g_min -Maximum $g_max
$true_w = Get-Random -Minimum 0 -Maximum 100

# if there is only one timespan, add another
if ($xml.Profile.Timespans.ChildNodes.Count -eq 1){

# clone the current timespan element, modify it, and append it as a child
$new_t = $xml.Profile.Timespans.Timespan.Clone()
$new_t.Targets.Target.Throughput = "$g_param"
if ($rw_flag -eq 1){
$new_t.Targets.Target.WriteRatio = "$true_w"
}
$null = $xml.Profile.Timespans.AppendChild($new_t)

}
else{

# clone the current timespan element, modify it, and append it as a child
$new_t = $xml.Profile.Timespans.Timespan[1].Clone()
$new_t.Targets.Target.Throughput = "$g_param"
if ($rw_flag -eq 1){
$new_t.Targets.Target.WriteRatio = "$true_w"
}
$null = $xml.Profile.Timespans.AppendChild($new_t)

}
}

# show updated result
$xml.Profile.Timespans.Timespan
# save into xml file
$xml.Save("$pathexpand_profile.xml")

}
#
# SCRIPT BEGINS #
#


# create the xml file with diskspd parameters
Create-Timespans -d $d -g_min $g_min -g_max $g_max -path $path -b $b -r $r -o $o -t $t -w $w -rw_flag $rw_flag


# create path, input file, and node variables
$path = Get-Location
# feed profile xml to DISKSPD with -X parameter (Running DISKSPD)
Invoke-Expression ".diskspd.exe -X'$pathexpand_profile.xml' > output.xml"

$file = [xml] (Get-Content "$pathoutput.xml")


$nodelist = $file.SelectNodes("/Results/TimeSpan/Iops/Bucket")
$ms = $nodelist.getAttribute("SampleMillisecond")

# store the bucket objects into a variable
$buckets = $file.Results.TimeSpan.Iops.Bucket

# change the millisecond values to seconds
$time_arr = 1..$d
foreach ($t in $time_arr){
$buckets[$t-1].SampleMillisecond = "$t"
}

# select the objects you want in the csv file
$nodelist |
Select-Object @{n='Time (s)';e={[int]$_.SampleMillisecond}},
@{n='Total IOs';e={[int]$_.Total}} |
Export-Csv "$pathiops_stat_seconds.csv" -NoTypeInformation -Encoding UTF8 -Force # Have to force encoding to be UTF8 or data is in one column (UCS-2)

# import modified csv once more
$fileContent = Import-csv "$pathiops_stat_seconds.csv"

# if duration is less than 7 (number of percentile ranks), then add empty rows to fill that gap
if ($d -lt 7 ) {
for($i=$d; $i -lt 7; $i++) {
# add new row of values that are empty
$newRow = New-Object PsObject -Property @{ "Time (s)" = '' }
$fileContent += $newRow
}
}

# show output in the terminal
$fileContent | Format-Table -AutoSize

# export to a final csv file
$fileContent | Export-Csv "$pathiops_stat_seconds.csv" -NoTypeInformation -Encoding UTF8 -Force
*Script 2: get_iops_percentiles*
# Written by Jason Yi, PM

Function Get-IopsPercentiles{
<#
.DESCRIPTION
This function expects an array of sorted iops, length of the iops array, and an array of percentiles. For the given array of percentiles,
it returns the calculated percentile value for the set of iops numbers.

.PARAMETER sort_iops
array of sorted iops values from the input file
.PARAMETER iops_len
length of the sort_iops array
.PARAMETER percentiles
array of the percentiles you wish to find
#>
Param (
[array]$sort_iops,
[int]$iops_len,
[array]$percentiles)

$new_iops = New-Object System.Collections.ArrayList($null)
# loop through the percentiles array
foreach ($k in $percentiles) {

[Double]$num = ($iops_len - 1) * $k + 1

# if num is equal to 1 then add the first element to array
if ($num -eq 1) {

[void]$new_iops.Add( $sort_iops[0])
}

# if num is equal to the length of array then add the last element to array
elseif ($num -eq $iops_len) {
[void]$new_iops.Add( $sort_iops[$iops_len-1])
}

else {
$val = [Math]::Floor($Num)

#get decimal portion of the num
[Double]$dec = $num - $val

[void]$new_iops.Add( $sort_iops[$val - 1] + $dec * ($sort_iops[$val] - $sort_iops[$val - 1]))
}

}
return $new_iops

}


# Set path and import the csv file
$path = Get-Location
$file = Import-Csv "$pathiops_stat_seconds.csv"

#$sort_iops = $file."Total IOPS" | Sort-Object -Property {$_ -as [decimal]}


# sort the values in IOPS column in ascending order
$sort_iops = [decimal[]] $file."Total IOs"
[Array]::Sort($sort_iops)

# remove the empty or 0 values
$sort_iops = @($sort_iops) -ne '0'

$iops_len = $sort_iops.Length
#$percentiles = (1,25,50,75,90,95,99)
$percentiles = (.01,.25,.50,.75,.90,.95,.99)

# find the calculated percentiles and put them in an array
$new_iops = Get-IopsPercentiles $sort_iops $iops_len $percentiles

# if the old iops length is less than the length of the new calculated iops scores, then that new length is the iops_len
$new_iops_len = $new_iops.Length
if($iops_len -le $new_iops_len){
$iops_len = $new_iops_len
}


# loop through all the CSV rows and insert 2 new columns for the percentile rank and scores
for ($i = 0; $i -lt $iops_len; $i++) {
$value = if ($i -lt $percentiles.Count) { $percentiles[$i] } else { $null }
$file[$i] | Add-Member -MemberType NoteProperty -Name "Percentile Rank" -Value $value

$value2 = if ($i -lt $percentiles.Count) { $new_iops[$i] } else { $null }
$file[$i] | Add-Member -MemberType NoteProperty -Name "IOPS %-tile Score" -Value $value2

}

# Show output to terminal
$file | Format-Table -AutoSize

# Export to a new CSV file
$file | Export-Csv -Path "$pathiops_percentiles.csv" -NoTypeInformation -Force
by Contributed | Apr 15, 2021 | Technology
This article is contributed. See the original author and article here.
Helm is the package manager for Kubernetes itself. Learn with Amit Khandelwal on Data Exposed how you can use Helm from your Windows machine to deploy SQL Server 2019 containers on Kubernetes all in less than 5 minutes.
Watch on Data Exposed
Resources:
Deploy SQL Server on Azure Kubernetes Service cluster via Helm Charts – on a windows client machine
View/share our latest episodes on Channel 9 and YouTube!
 Granting admin consent for the organization in Azure Active Directory.
 Example screenshot of the Client secrets “Value” and “ID”.
Recent Comments