by Contributed | Jul 27, 2021 | Technology
This article is contributed. See the original author and article here.
Simplify your app authoring experience with the latest updates in Power Apps. The new modern app designer makes model-driven apps far more accessible and easier to build. Customize pages, then generate Power Fx formulas that write themselves when you specify what you want using natural language. Emma Cooper, Senior Program Manager for Microsoft Power Apps, joins Jeremy Chapman to share how these updates make it easier to build apps and bring in advanced functionality with very low code.
Build your own model-driven apps:
- Fully working app, no formulas or code building
- Generate data already stored in Dataverse
- Preview, then publish
Customize your apps:
- Add custom pages
- Build custom logic with Power Fx
- Make apps available in Microsoft Teams
QUICK LINKS:
01:34 — Office Depot’s model-driven app
02:41 — How to build a model-driven app
04:58 — How to customize your app
06:44 — What is Power Fx?
09:56 — Make apps available in Teams
10:25 — Wrap up
Link References:
Get a full list of the Power Fx functions available at https://aka.ms/powerfxfunctions
For tips, tricks, and guidance on Power Apps, go to https://aka.ms/powerappsresources
Check out our show on Dataverse at https://aka.ms/MechanicsDataverse
Unfamiliar with Microsoft Mechanics?
We are Microsoft’s official video series for IT. You can watch and share valuable content and demos of current and upcoming tech from the people who build it at Microsoft.
Keep getting this insider knowledge, join us on social:
Video Transcript:
– Coming up, if you’re new to Power Apps, or maybe it’s been a while since you built your last one, we’re joined today by Program Manager Emma Cooper to look at the latest updates to the app authoring experience, from the new modern app designer that makes it easier to build model-driven app experiences with custom pages, then generating Power Fx formulas that write themselves when you specify what you want using natural language, and also a lot more. So, Emma, thanks for joining us on Microsoft Mechanics today.
– Thank you so much for having me.
– So I think most people will be familiar with the drag-and-drop PowerPoint-like experience of creating canvas apps, but now with model-driven apps, with the latest round of updates, we’ve made things a lot easier.
– Yeah, that’s right. We’ve re-imagined how to make model-driven apps far more accessible and easier to build. In Power Apps, like you mentioned, there’s really two types of apps. There’s the canvas app, where you’re literally building out the app experience by inserting controls and then binding them to data, or what we’re covering today with model-driven apps, where we’ve worked really hard to simplify the authoring experience. For example, the app in this case is generated from the data and relationships you have in your tables in Dataverse. And with the modern app designer, just as you’ve always been able to do with canvas apps, we’ve also made it far easier for you to customize the user experience.
– Okay, and model-driven apps, in many respects, because they start from the data source, they can quickly get more sophisticated, but still be really easy to build. And by the way, if you’re new to Dataverse, it’s a powerful and managed data backend really for any data that your apps and services can use. So in fact, we actually did a show on this recently with Mark Mercuri that you can check out at aka.ms/MechanicsDataverse. But Emma, can you walk us through an example?
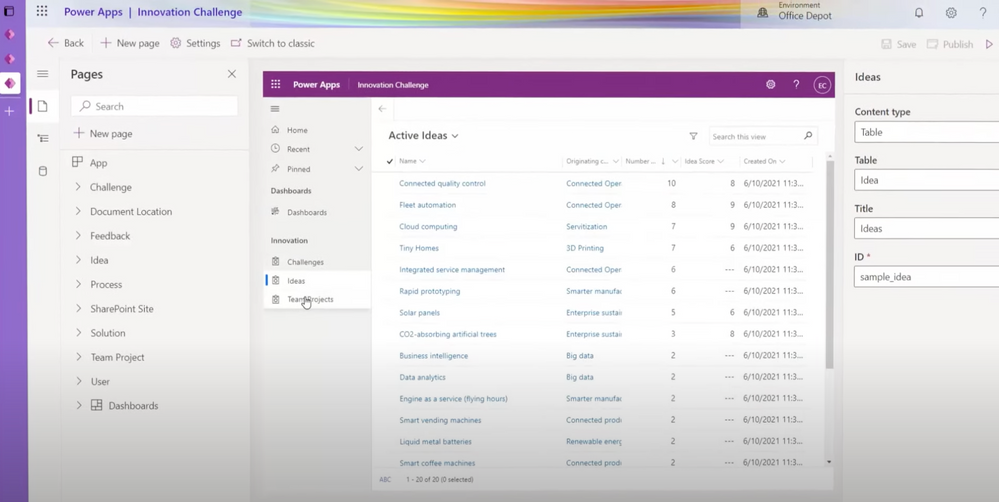
– Yeah, I’d be happy to. So I’m going to show you what the US-based office supply retailer Office Depot is doing. And so they’ve built a power dev platform that allows literally dozens of their maker citizen developers at Office Depot to build apps that boost their everyday productivity, as well as make them discoverable inside of Teams. So let me show you what they’ve built. And so here you can see they have a model-driven Power App with custom pages to help them with their new project requests. And this provides a modern experience on top of their legacy system and process. And so it can create new requests and is themed with Office Depot’s branding. The app also lets them manage requests with a sophisticated search and filter inside of this grid. It’s using Dataverse on the backend and these experiences help classify costs and approve budget requests. And so here you can add line items. For example, I can add the finance type, the location, determine the team, resource type, and specifics for resources and timing. And something really cool, it calculates for you what the budget is going to be using Power Fx and Excel-based expression language.
– Right, and this app actually looks pretty great. What’s the experience then now to build out something like this?
– Yeah, it’s pretty easy to get started. All you need to do is go to make.powerapps.com and select build a model-driven app from blank. And we’ll use the newly released modern app designer. I’ll name this app Project Requests App and then hit Create. Now there’s a lot of different components for how an app comes together and we’ve taken and simplified these concepts into pages that you add to your app, which is usually easier for most people to understand. And so I’ll add a new page and there’s a few different options here to choose from based on the experience that I want. A table-based view and form will give us the rich, sophisticated grid and form on top of the Dataverse table. And a dashboard gives us a page of charts for analyzing our data, while a custom page lets us build from scratch to make whatever we want. And so here I’ll choose table-based view and form because I want that rich grid layout to view and search my Project Requests. And so right here, we get a view of all of the tables of corporate data available in Dataverse, so you can easily add whatever you want from your Dataverse environment. So I’ll search for project requests and I’ll select the project request table. And just like that, it populates a grid and a form generated from data with search and filtering and more. And you notice that we didn’t drag or drop components, write any formulas, or build any code. This is a fully working app right out of the box. And I can even interact with the preview and see how the app will behave right away. So I’ll add a new project request, say, for new equipment, and I can save that and see it reflected. And so if I wanted to, I could publish this app right now for my team to use. And by default, as I change the app dimensions, you’ll see that its layout is also responsive. And in this authoring experience, I can test it out on different form factors like desktop, tablet, or phone to see how it will look. And I’ll pick desktop here. I can continue to customize my app by selecting edit on one of my views. I can drag and drop to reorder the columns and sort the data. Now I can edit my forms in the same way and add columns if I need to. And so going back to my form, I’ll add a column for audit requested. I can even add additional columns to the underlying Dataverse table right in line here as well for capturing additional data. So I’ll add one now called reviewer comments.
– So you were able to update how the form looks and really edit the table itself all in line, but what else have you and the team done to make it easier to customize the user experience?
– Well, now you can also build a custom page and add it to your app. And so this is a brand new capability that allows you to leverage the power of the canvas inside of a model-driven app. I’ll go back to our page selection and choose custom and create a new custom page. So custom pages use the same technology as canvas apps where you can drag and drop controls or custom components onto the screen and lay them out just as you like. I can add Office Depot’s header with custom branding and I can update the text, like changing the page title to new request. I’ll add a progress indicator, showing the state for the request, and then a footer to show the totals, followed by a form to edit the data for this request. I can also connect to hundreds of different data sources, but for this one, I want to connect to my project requests in Dataverse. And so now we need a way to go see all of the requests on our project request view in the model-driven app. I’ll add a button, and update it to say see all requests. So we can use Power Fx low-code formulas for any custom logic. And at the top here, we have a formula bar that’s very similar to Excel, and that’s intentional since Power Fx is based on Excel. So let me show you how this works. In this case, I want to navigate to the project requests view when someone selects this button, and that’s a perfect case for the navigate function. So I’ll type navigate, then project, and that will show me a list of options to view. And I’ll choose this one for project requests views, and I’ll add a dot to drill in one level deeper and choose active project requests. And notice how the smart IntelliSense helped me complete that formula.
– And I really see what you mean by the convergence and the authoring experience across Power Apps and now model-driven apps. Then you also have the ability to bring in more custom capability with Power Fx and that transforms things even further. But for those people who might be new to Power Fx, can you explain what it is and how it’s useful?
– Yeah, absolutely. Power Fx is an open source formula language for low code that’s based on Excel. And the reason it’s so powerful is that while point-and-click tools are great for assembling workflows, many real-world solutions need a layer of custom logic. And that custom logic is where many low-code platforms hit a cliff to require traditional code. With Power Fx, you can build this custom logic yourself, which uses your knowledge of Excel. For example, here I’m adding up values like using the familiar SUM expression to calculate the total cost of each project request, just like I would in an Excel sheet. And we’ve been working hard on integrating Power Fx with more products across the Power Platform, and one of these places we can take a look at is model-driven commanding. So when I look at my model-driven app, there’s a list of commands that appears on the top of forms and grids that let users perform actions. And I can edit these with the new command designer. So for Office Depot, they need to flag a request for audit on their form. So to do that, I’ll click in the ellipse and choose edit command bar, and then I’ll select the main form. There are default commands, like create new or save, however quite often there are custom behaviors that are needed in processes, like our flag for audit command. So previously, all of this logic was handwritten and tended to be really error prone. And now with the new designer, it’s as easy as adding a new command. I’ll call it flag for audit and I can choose an icon. The next thing I’ll want to do here is add the Power Fx expression to update the record. So I’ll use the patch function to update an existing field. And there’s a lot of functions that you can choose from, and I’m just scratching the surface here. You can get a full list of the Power Fx functions available at aka.ms/powerfxfunctions.
– So now you’ve got a very rich data-driven experience that’s fully customized and you also leveraged Power Fx to create custom actions and logic.
– Right, and what’s exciting is that you don’t even need to know Power Fx or Excel to be able to do any of this. We’ve also made it easier than ever to create those experiences using AI tools like GPT-3 and PROSE to help automatically generate those Power Fx formulas. So OpenAI GPT-3 is one of the most advanced natural language AI models on the planet. And it’s been fine tuned to understand natural language and how Power Fx formulas are constructed, allowing a maker to describe the logic just like they would to a coworker or a friend, and then the code writes itself. You can do this by using the ideas capability in Power Apps Studio. So here, I’ll select ideas on this gallery. Now I can just tell Power Apps what I’d like to see. For example, with Office Depot, I can say, show me project requests. It suggests the name of the table in the app that cost, and I’ll choose total expense cost, more than 10,000 or have an ongoing expense. Based on this input and the context from the app, such as your table and controls, Power Apps will generate the most relevant Power Fx formula for you to select from, filtering out results that can’t pass the formula syntax check and now I can select this formula that I want to use and see it update. And so it’s really that easy.
– And you also mentioned though, that Office Depot are making these apps available in Microsoft Teams. How does that work?
– Yeah, they are, and this greatly helps increase the level of discoverability of these apps by users. And so with just a few clicks, I can add an app to a Teams channel with our teams who works on these projects. I’ll add a tab, select Power Apps, and then search and filter to select our Project Requests app. I’ll hit save, and now everyone can find and use the app inside one of their Teams channels from their device of choice.
– So lots of great updates to make it easier, not just to build apps, but also to bring in advanced functionality all in a really low-code way. So where can people go to learn more?
– Well, the best way to learn is to try out these capabilities for yourself, and everything I’ve shown you here today is rolling out over the next several weeks. You can also check out aka.ms/powerappsresources for tips and tricks and more guidance.
– Thanks, Emma, for sharing all of these updates. And of course, keep watching Microsoft Mechanics for the latest news and updates from Microsoft. And subscribe to our channel if you haven’t already. And as always, thanks so much for watching.

by Contributed | Jul 26, 2021 | Technology
This article is contributed. See the original author and article here.
This is the next installment of our blog series highlighting Microsoft Learn Student Ambassadors who achieved the Gold milestone and have recently graduated from university. Each blog in the series features a different student and highlights their accomplishments, their experience with the Student Ambassadors community, and what they’re up to now.
Today we’d like to introduce Khushboo Verma who is from India and graduated in May from the Indira Gandhi Delhi Technical University for Women with a degree in Computer Science Engineering.
Responses have been edited for clarity and length.
When you joined the Student Ambassador community in 2018, did you have specific goals you wanted to reach, such as a particular skill or quality? What were they? Did you achieve them? How has the program impacted you in general?
My aim behind joining was to connect with a community beyond my campus to be able to bring opportunities and resources to my local community. I wanted to learn valuable skills – both technical and interpersonal – so that I can uplift those around me. The Student Ambassador program helped me grow above and beyond my initial goal. It truly empowered me by providing me an opportunity to connect with passionate student developers from all over the world. It helped me understand what an inclusive and diverse community looks like and also helped me discover my true potential.
I vividly remember my first event as a Student Ambassador when I delivered a talk on Azure in a room full of developers, some of them having many years of industry experience. That talk helped me realize my passion for tech communities and for public speaking. It opened a sea of opportunities for me. From that day to the present day, I have grown immensely. I’ve gained confidence and skills; it has been possible because of the support I’ve continuously received from the program. It has helped me build a personal brand for myself, and it also provided inspiration we receive from mentors like Pablo Veramendi, the Microsoft Learn Student Ambassadors Global Program Director, who are so passionate to empower the community and do their best everyday to bring the best out of us. I’ve witnessed the community grow exponentially ever since I’ve joined, and I feel super proud to be a part of a community that is literally transforming lives.
What are the accomplishments that you’re the proudest of and why?
I’ve organized multiple events as a Student Ambassador, and I’ve impacted more than 2000 student developers, but I’m most proud of the “Microsoft Student HackDay” I organized on my campus. The idea behind the hackathon was to introduce the women on my campus to the cloud computing landscape. I’m from an all-women university, and only a handful of my peers were aware about cloud computing and had never tried it hands-on. With the support of Arkodyuti Saha, Developer Relations Program Manager at Microsoft, I organized a 2-day hackathon on campus in which 80 women participated in a beginner workshop on chatbots in Azure. At the end of the hackathon, we were surprised to see that the participants had built amazing projects even though some of them learned about Azure and chatbots for the first time during the workshop. That event made me believe that women can achieve incredible heights if they receive the right guidance.
Another accomplishment I’m really proud of is that as a Gold Ambassador, I was selected to speak at international conferences like Microsoft Build 2020 as part of a panel discussion titled “Learn how to succeed in Hackathons” and Microsoft Ignite 2020 (“Intro to GitHub”). It helped me boost my confidence and provided me the platform to showcase my skills to a much wider audience.
What do you have planned after graduation?
I am really passionate about technology and communities. I did a summer internship at Microsoft India as a software engineering intern. During that internship, I got to learn a lot about software engineering, interacted with senior leaders from Microsoft, and fell in love with Microsoft’s culture. I received a pre-placement offer after my internship, and I’ll be joining Microsoft India full time as a software engineer after graduation. I’m really excited for this upcoming chapter of my life.
If you could redo your time as a Student Ambassador, is there anything you would have done differently?
If I could start all over again, I would network with more people. The Microsoft Student Learn Ambassador program brings together students from varied backgrounds from all over the world and provides us a platform to interact, learn, and lead together. Initially, I was afraid of reaching out to new people because of imposter syndrome but eventually, I realized everyone was really helpful and supportive. Each Student Ambassador has something amazing to teach to the community, and the more I interact with them, the more I learn. So one thing that I would have done differently would be to interact and collaborate with more people.
If you were to describe the community to a student who is interested in joining, what would you say about it to convince him or her to join?
This is a program for every student out there who has a passion to learn, share, and connect with others. If you’re passionate about technology and have a desire to create an exponential impact in the world, then come and join our amazing community. You’ll not only get wonderful opportunities, but you’ll also learn great technical and interpersonal skills, you’ll build long lasting connections, and you’ll become a better leader and a better individual. The community is welcoming, honors diversity and inclusion, and values your ideas.
What advice would you give to new Student Ambassadors?
My advice to all the new Student Ambassadors would be to take initiatives and push yourself to transform your ideas into reality. Network and collaborate with as many people as you can – you’ll get to learn a lot. Help and uplift your community. And lastly, don’t doubt your own capabilities, and don’t be afraid to ask questions, as no question is ever stupid.
What is your motto in life, your guiding principle?
I’d like to share one of my favorite quotes that acts as a guiding principle for me: “As long as you’ve got passion, faith, and are willing to work hard, you can do anything you want in this life.” At the end of the day, I want to be happy with whatever I do, and I want my life to be meaningful, impactful and fulfilling.
What is one random fact about you that few people are aware of?
One random fact about me is that I can’t go without listening to music even for a single day. Music runs in my veins, haha.
Good luck to you in your journey, Khushboo!
by Contributed | Jul 23, 2021 | Technology
This article is contributed. See the original author and article here.
Both tools below – ProcDump and DebugDiag – work similarly: they can attach themselves as debuggers to a process, then, when the machine is on high-CPU, collect one or more memory dump(s) from that specific process.
Note that the tools won’t “know” what process is consuming the CPU unless we dig deeper in the performance counters. If using ProcDump, it easier if we are sure ahead of time what’s the culprit – the process that is “eating” much CPU.
Both tools need administrative rights to be run.
DebugDiag is the preferred tool, since it automates some steps, adds more explicit context, and includes automated memory dump analysis capabilities too.
Using the command-line ProcDump
ProcDump does not require installation. But one needs to be specific about the PID to which it is attaching. That PID needs to be determined prior to starting ProcDump. Debug Diag is able to determine the PID itself, if the Application Pool is specified.
- Download the tool and copy it on a disk folder, for example D:Temp-Dumps
https://docs.microsoft.com/en-us/sysinternals/downloads/procdump
- Open an administrative console, from where to run commands.
Navigate to where the ProcDump tool was placed (D:Temp-Dumps).
- Find the process ID, the PID, of the IIS w3wp.exe worker process executing your application.
From the administrative console, you can use AppCmd IIS tool to list processes for application pools:
C:WindowsSystem32InetSrvappcmd.exe list wp
- In the administrative console, start the following command to collect dumps (but don’t hit enter yet).
D:Temp-Dumps> procdump.exe -accepteula -ma -c 85 -n 3 -s 7 [PID]
You may want to redirect the console output of ProcDump to a file, to persist the recording of the encountered exceptions:
D:Temp-Dumps> procdump.exe -accepteula -ma -c 85 -n 3 -s 7 [PID] > Monitoring-log.txt
Replace [PID] with the actual Process ID integer number identified at the step 2.
Please make sure that there is enough disk space on the drive where dumps are collected. Each process dump will take space in the disk approximately the same size the process uses in memory (column Commit Size in Task Manager). For example, if the w3wp.exe process memory usage is ~1 GB, then the size of a dump file will be around 1 GB.
- Start reproducing the problem: issue requests that would render the process to consume CPU; or leave the command running until the high-CPU occurs.
- Please wait until all the dumps are written and then compress the files before uploading the dumps to the workspace.
Using the UI tool DebugDiag, Debug Diagnostics Collection
DebugDiag requires installation, but it is able to determine itself the whatever process instance – PID – happens to execute for an application pool at some point in time; even when that process may occasionally crash or be recycled, hence restarted with different PID.
#1.
Download Debug Diagnostic and install it on IIS machine:
https://www.microsoft.com/en-us/download/details.aspx?id=49924 v2.2 (if 32-bit system)
https://www.microsoft.com/en-us/download/details.aspx?id=102635 v2.3.1 (only supports 64-bit OS)
#2.
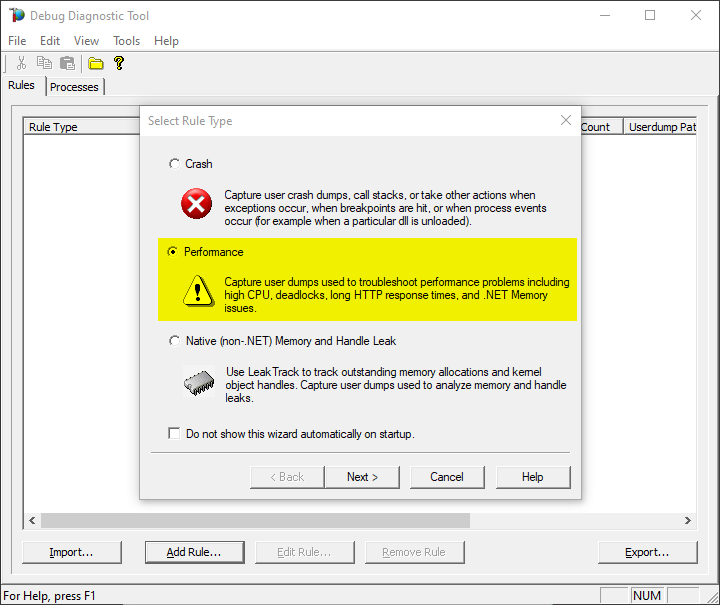
Create a new rule selecting Performance and then clicking on “Next” next button.
You also can create the rule by right-click and selecting “Add rule”, or clicking the “Add rule” button at the bottom.
#3.
Select the second option “Performance Counters” and then “Next”.

#4.
Click on Add Perf Triggers…

#5.
The select %Processor Time from the Processor category and select the _Total instance


Note:
You might need to determine the w3wp.exe#N instance by looking into the Task Manager, sorting by w3wp.exe PID.
Or use one of the following commands in an administrative command-line console, to find out the PIDs:
> C:WindowsSystem32InetSrvappcmd.exe list wp
> TaskList.exe | find “w3wp.exe” /i
> TaskList.exe /FI “IMAGENAME eq w3wp.exe”
#6.
Select the action click on Edit Thresholds

#7.
Select Above, set 80 as this threshold and 5 in for this number of seconds
You might need to adjust the threshold value to what you’re seeing on your system. You should know better how you define “High-CPU” (maybe, in your case, High-CPU means anything above 60%; your experience or expectations matter here).


#8.
Click on Next

#9.
Click on Add Dump Target

#10.
Select Web application pool as Target type and select the application pool

#11.
Click on Next

#12.
Set 10 seconds at Generate a UserDump every…
Set 3 at Stop after Generating…
Select Collect Full UserDumps.

#13.
Type down a descriptive name, i.e. “My App eats a lot of CPU” and select the dump files path.
Keep in mind you’re collecting 4 dumps. Please make sure that there is enough disk space on the drive where dumps are collected. Each process dump will take space in the disk approximately the same size the process uses in memory (column Commit Size in Task Manager). For example, if the w3wp.exe process memory usage is ~2 GB, then the size of each dump file will be around 2 GB.
Do not choose a disk in network/UNC; choose a local disk.

#14.
Select “Activate rule now” option and click on “Finish”

#15.
Watch the rule in DebugDiag; it should tell you how many dumps are collected (present in the selected dumps folder).

#16.
Once the memory dumps are collected and fully written on disk…
Archive each dump file in its own ZIP and prepare to hand over to the support engineer; upload in a secure file transfer space.
Remember my article about how exceptions are handled and how to collect memory dumps to study them. We can double check if a crash occurred or not: read about w3wp.exe crashes.
Aside: Just in case you are wondering what I use to capture screenshots for illustrating my articles, check out this little ShareX application in Windows Store.
by Contributed | Jul 23, 2021 | Technology
This article is contributed. See the original author and article here.
Collect series of memory dumps for memory leak analysis of a process using the steps below.
With such series of memory dumps we can later analyze the consumption trends:
- Objects accumulating in the .NET heaps and not being removed by Garbage Collection;
- Managed modules that are being created and taking up space.
- Too many threads with rather large call stacks, etc.
#1: Have tool installed
Download Debug Diagnostic and install it on IIS machine:
https://www.microsoft.com/en-us/download/details.aspx?id=49924 v2.2 (if 32-bit system)
https://www.microsoft.com/en-us/download/details.aspx?id=102635 v2.3.1 (only supports 64-bit OS)
#2: Start collection rule
Run Debug Diagnostics Collection. Open the tool with admin rights.
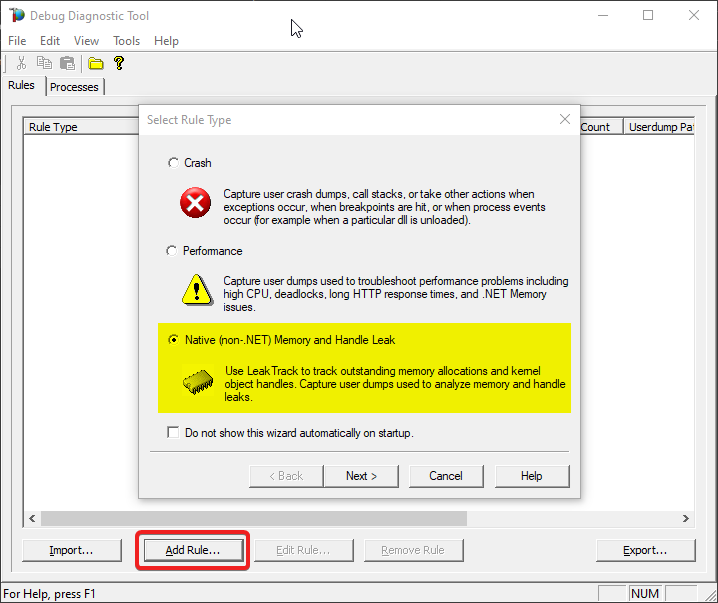
And a pop-up will come, to create a rule for dump collection. Select Memory and Handle Leak, then Next.
#3: Select process by PID
You should see the list of processes now: please select the worker process from the list which you’re having the memory problem. Press Next.
If you have multiple worker processes, you can use command-line utility appcmd.exe from an administrative console to see the list of worker processes with associated application pools.
> C:WindowsSystem32inetsrvappcmd.exe list wp

#4: Configure
On the next window:
Select the maximum number of dumps you would collect (you’ll have the chance to set it later too). A minimum of 3 dumps would be needed for an analysis.
Then press Configure on Userdump generation section.

#5: First dump in series
Select Generate userdump when private bytes reach option and set the value to whatever you know it should be the normal consumption – let’s say 900 MB.
#6: Next dumps in series
Set the and each additional … MB threafter option to – let’s say – 300 MB and finally Save & Close.
This will collect dump when memory consumption goes up to 900 Megs and will continue to take dump for each additional 300 Megs
(until the maximum number of dumps is reached, set in the previous/parent window).

#7: Cleanup investigated process
Select Auto-unload Leak Track when rule is completed or deactivated on Rule completion section.
(DebugDiag injects a module in worker process to do its job; we shouldn’t leave the module there.)
#8: Place cap on dumps count
Set Maximum number of userdumps created by this rule to at least 3 (10 is the default).
The more, the better; but mind the space on disk.

#9: Dumps location
After selecting Next, you will set the location where the dumps will be written.
Please make sure that there is enough disk space on the drive where dumps are collected. Each process dump will take space in the disk approximately the same size the process uses in memory (column Commit Size in Task Manager). For example, if the w3wp.exe process memory usage is ~2 GB, then the size of each dump file will be around 2 GB.
Please do not choose a disk in network/UNC; choose a local disk.

#10: Go!
Finally activate the rule

#11: Make sure we do get dumps
After that observe the dump count in the main DebugDiag window.
You need to re-create the leak definition if the PID/Process ID changes in the Task Manager for the worker process.
You can tweak the memory tracking values differently based on your observations.
Eg. Start from 1.5 GB and take additional dump for every additional 500 MB etc.
#12: Upload
Archive each dump file in its own ZIP and prepare to hand over to the support engineer; upload in a secure file transfer space.
Remember my article about how exceptions are handled and how to collect memory dumps to study them. We can double check if a crash occurred or not: read about w3wp.exe crashes.
Aside: Just in case you are wondering what I use to capture screenshots for illustrating my articles, check out this little ShareX application in Windows Store.
by Contributed | Jul 22, 2021 | Technology
This article is contributed. See the original author and article here.
Call Summary:
Unfortunately, we had technical difficulties and were unable to record this month’s call. We’ll record the presentations again and update this blog with links when they are ready.
This month’s community call featured presentations:
- Shared mailboxes in Outlook – Juan Balmori (Microsoft) and Ankush Oberoi (Microsoft) discussed shared mailboxes and shared folders. Shared mailbox is now in preview and we encourage you to try it out and give us feedback at https://github.com/OfficeDev/office-js/issues.
- Message recipients changed event for Outlook – Elizabeth Samuel (Microsoft) shared a new PnP sample demonstrating how to use the Recipients Changed event to tag an email when there are external recipients.
Q&A (Question & Answers)
Due to the technical difficulties we had on this call, we could not access the chat to read your questions and provide follow-up. If you had a question that did not get answered during the call, or in this blog, please reach out to us by using our short survey form. We’ll address any questions you have during the next call.
Can you add some additional error handling around failure cases for an Outlook add-in that uses the On-send event? We have a scenario where if an On-send add-in fails due to service outage users are unable to send emails unless an admin performs a companywide deactivation of the add-in. It would be helpful to let end-users still send their emails if the On-send add-in fails to load or throws an unhandled exception.
That’s by design for the On-send event when we released the 1.8 requirement set. The good news is that the team is working on enabling a new version of this event that will deal with the “add-in unavailable” cases. We are working to get this into preview soon, so please keep an eye out on future community calls.
On the iOS and Android platforms, you only support Outlook API 1.5. Do you think we will see support for 1.6+ before 2022?
We have this in our backlog, but we don’t yet have an ETA.
Outlook on mobile still does not support compose mode add-ins, or the On-send event. This was a highly requested feature on the UserVoice system. When will Outlook on mobile support both of these? How did the ‘Exclaimer’ add-in from June 2021’s community call work on Outlook mobile without support for compose mode add-ins?
We have this in our backlog, but we don’t yet have an ETA. The Exclaimer add-in isn’t designed for use on Outlook on mobile.
Is there a way to write a CSV file to the local computer’s storage where the add-in is running?
Office Add-ins run in a browser runtime and only have the capabilities of any web app running in a browser. It’s not possible to write directly to disk from the browser in any way that works cross-platform. A recommended approach to write to a CSV file is to write to files using Microsoft Graph and OneDrive.
Resources
Outlook shared mailbox
PnP: Use Outlook event-based activation to tag external recipients (preview)
Office Add-ins community call
Office Add-ins feedback
The next Office Add-ins community call is on Wednesday, August 11, 2021 at 8:00AM PDT. Get the calendar invite at https://aka.ms/officeaddinscommunitycall.

Recent Comments