This article is contributed. See the original author and article here.
Collect series of memory dumps for memory leak analysis of a process using the steps below.
With such series of memory dumps we can later analyze the consumption trends:
- Objects accumulating in the .NET heaps and not being removed by Garbage Collection;
- Managed modules that are being created and taking up space.
- Too many threads with rather large call stacks, etc.
#1: Have tool installed
Download Debug Diagnostic and install it on IIS machine:
https://www.microsoft.com/en-us/download/details.aspx?id=49924 v2.2 (if 32-bit system)
https://www.microsoft.com/en-us/download/details.aspx?id=102635 v2.3.1 (only supports 64-bit OS)
#2: Start collection rule
Run Debug Diagnostics Collection. Open the tool with admin rights.
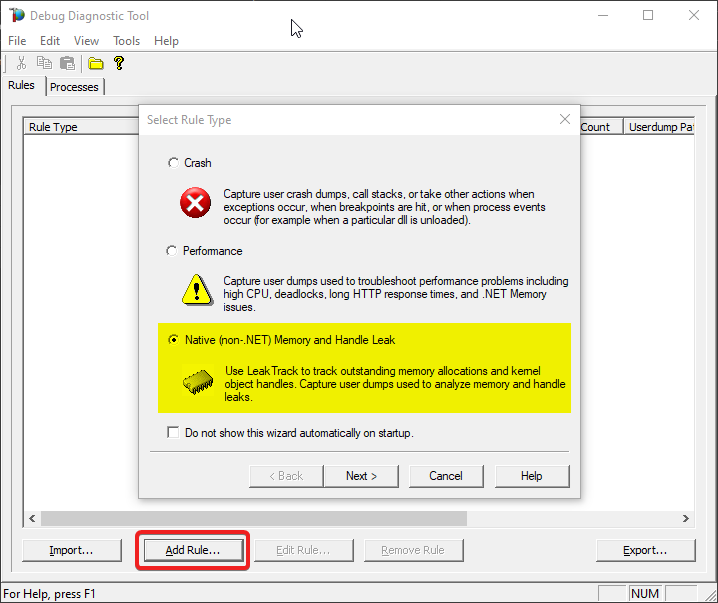
And a pop-up will come, to create a rule for dump collection. Select Memory and Handle Leak, then Next.
#3: Select process by PID
You should see the list of processes now: please select the worker process from the list which you’re having the memory problem. Press Next.
If you have multiple worker processes, you can use command-line utility appcmd.exe from an administrative console to see the list of worker processes with associated application pools.
> C:WindowsSystem32inetsrvappcmd.exe list wp

#4: Configure
On the next window:
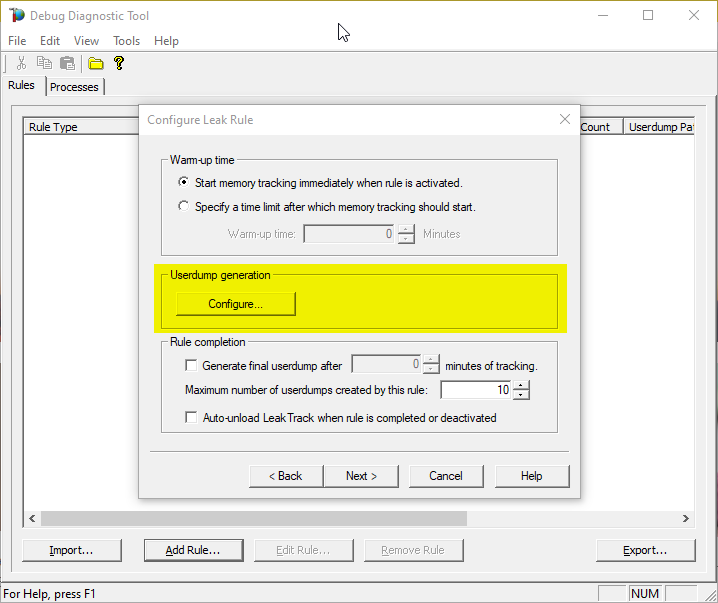
Select the maximum number of dumps you would collect (you’ll have the chance to set it later too). A minimum of 3 dumps would be needed for an analysis.
Then press Configure on Userdump generation section.
#5: First dump in series
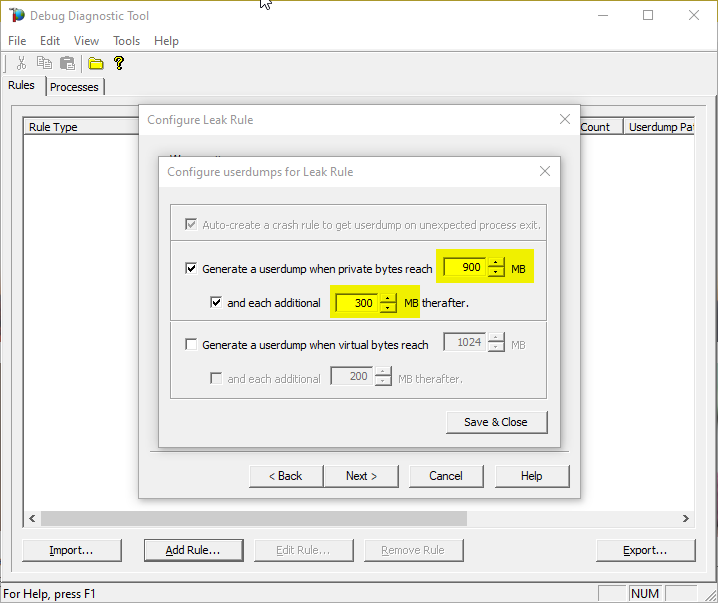
Select Generate userdump when private bytes reach option and set the value to whatever you know it should be the normal consumption – let’s say 900 MB.
#6: Next dumps in series
Set the and each additional … MB threafter option to – let’s say – 300 MB and finally Save & Close.
This will collect dump when memory consumption goes up to 900 Megs and will continue to take dump for each additional 300 Megs
(until the maximum number of dumps is reached, set in the previous/parent window).
#7: Cleanup investigated process
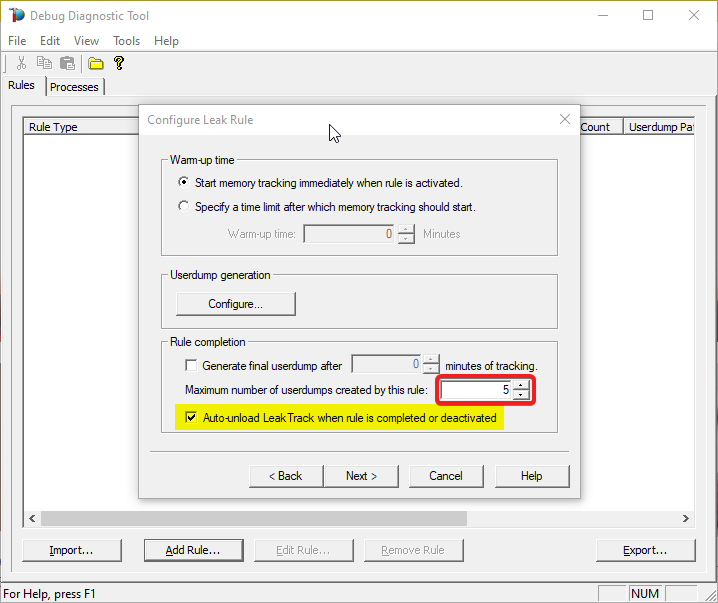
Select Auto-unload Leak Track when rule is completed or deactivated on Rule completion section.
(DebugDiag injects a module in worker process to do its job; we shouldn’t leave the module there.)
#8: Place cap on dumps count
Set Maximum number of userdumps created by this rule to at least 3 (10 is the default).
The more, the better; but mind the space on disk.
#9: Dumps location
After selecting Next, you will set the location where the dumps will be written.
Please make sure that there is enough disk space on the drive where dumps are collected. Each process dump will take space in the disk approximately the same size the process uses in memory (column Commit Size in Task Manager). For example, if the w3wp.exe process memory usage is ~2 GB, then the size of each dump file will be around 2 GB.
Please do not choose a disk in network/UNC; choose a local disk.
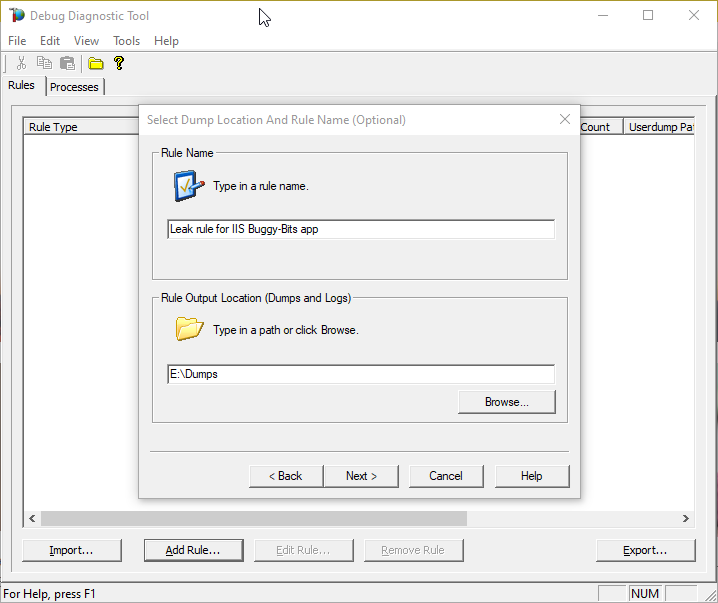
#10: Go!
Finally activate the rule
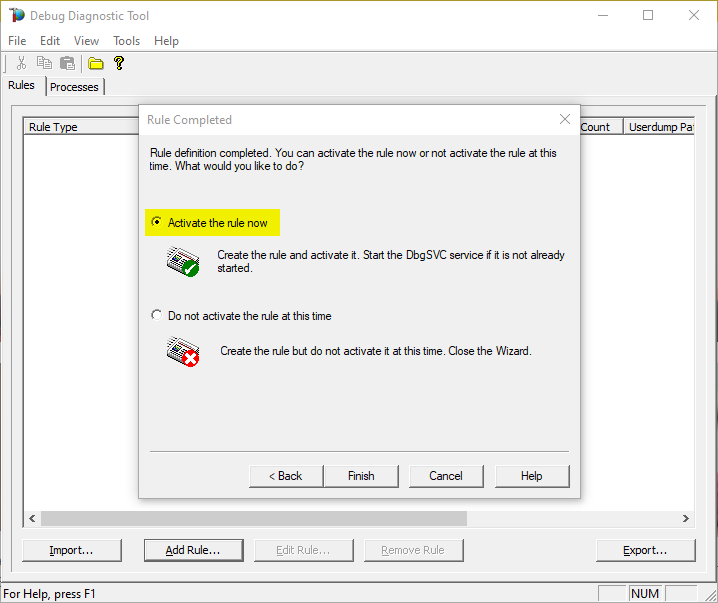
#11: Make sure we do get dumps
After that observe the dump count in the main DebugDiag window.
You need to re-create the leak definition if the PID/Process ID changes in the Task Manager for the worker process.
You can tweak the memory tracking values differently based on your observations.
Eg. Start from 1.5 GB and take additional dump for every additional 500 MB etc.
#12: Upload
Archive each dump file in its own ZIP and prepare to hand over to the support engineer; upload in a secure file transfer space.
Remember my article about how exceptions are handled and how to collect memory dumps to study them. We can double check if a crash occurred or not: read about w3wp.exe crashes.
Aside: Just in case you are wondering what I use to capture screenshots for illustrating my articles, check out this little ShareX application in Windows Store.
Brought to you by Dr. Ware, Microsoft Office 365 Silver Partner, Charleston SC.


Recent Comments