by Scott Muniz | Aug 12, 2020 | Uncategorized
This article is contributed. See the original author and article here.
Imagine that we have some non-trivial subsystem – e.g. product retrieval for user query – and need to know how good it is and decide if it is the bottleneck for the overall system. Or we have 2 competing solutions and need to choose the better one.
It is generally accepted that to make such decisions, we need to measure the subsystem; to do the measurement, in turn, we need ground truth data – in most cases, labeled by humans or crowdsourced labelers. Depending on our main goal and task specifics, one labeling setup may be better than another.
This post discusses ground truth labeling setups for ranking and helps to choose the most appropriate one for a use-case. Here by ranking we mean a task to establish an order on multiple items. It is common for many applications, such as search engines (for products/images/webpages) or recommendation systems, where ranking is done by relevance to a user query or a user profile. Ranking can be also based on universal properties of items to be ranked, e.g. ranking images by attractiveness.
Setups of ground truth data labeling
One can distinguish three main setups for ground truth data labeling:
- Absolute Gain Estimation – each item is labeled independently from each other on an established absolute scale (usually from 0 to 1); note that in case of relevance-based ranking, item includes both constituents, e.g. a pair of a user query and an image to be ranked.
- Relative ordering – labeler sees all items and directly introduces order on them.
- Side-by-side – labeler compares just 2 items at once and provides label reflecting result of such comparison; the label may be binary or multivalued.
For example, if all we need is to compare 2 subsystems and it is relatively easy to understand which of 2 items is better, then Side-by-side is the way to go. In another case, when we try to answer how far the current ranking subsystem is from the ideal one, then Absolute gain estimation may be a better choice.
See a detailed comparison of these setups in the following table:
|
Setup
|
Absolute Gain Estimation (AGE)
|
Relative ordering (RO)
|
Side-by-Side (SBS)
|
|
Description
|
Having just one item (per query), return number reflecting quality of this item
|
Introduce an order on collection of items (per query)
|
Compare 2 items (per query) and decide which item is better (maybe, with scale – how much better)
|
|
Where can be used (tasks)
|
1. Estimate how far we are from ideal
2. Estimate priority of the task
3. Estimate ROI
4. Estimate not only quality of ranking subsystem, but also quality of the items to be ranked (say, if all items have score around 0.1, then even perfect ranking wouldn’t improve overall quality and better items need to be added to the system)
5. Training data collection
6. Compare any number of systems
|
1. Training data collection
2. Compare any number of systems
|
1. Compare Prod vs New (to decide if ship new model or not)
2. Compare system with competitor
3. Train gains for levels (by Maximum Likelihood estimation)
|
|
How can be implemented
|
(See details in the section below)
1. Predefined levels (Excellent/Good/Fair/Bad)
2. Slider-like
|
1. Best-worst scaling
2. Direct swapping of items until needed order is achieved
|
Show two items and choose one of predefined levels (e.g. on Likert scale or on 1-100 slider)
|
|
Possible metrics
|
(n)DCG
MAP
MRR (binary)
|
Rank correlation coefficients (e.g. Kendall-tau)
|
Win/loss ratios (possibly, weighted): (wins-losses)/(wins+losses+ties)
McNemar’s test
|
|
Main pros
|
Universal
Easy to combine with other measurements
|
Most similar to actual ranking, thus best for corresponding tasks (low overhead, high speed, etc.)
|
Most similar to actual comparison, thus best for corresponding tasks (high sensitivity, low overhead, high speed, etc.)
Can include scale (e.g. Likert)
|
|
Main cons
|
Hard to define and judge – needed to describe/imagine Ideal and Worst items for each query – as a result, worse sensitivity for Training and Comparison
|
Can’t differentiate scenarios with 2 items: 1-0.1 vs 0.6-0.5
Can hardly support labeling of big number of items (say, greater than 10)
|
By design, requires 2 items to compare.
|
There may be hybrids of them, e.g.
- RO + AGE: firstly, do Relative ordering, then assign scale for all items by doing costly AGE for the best and the worst items for the query.
- SBS + AGE: do Side-by-side with items that have known absolute gains (e.g. 0.9, 0.5, 0.1) of another query (harder to compare, esp. medium cases)
Note that we can use different Setups for different tasks, such as use AGE for measurements, but RO for gathering training data. Simple way to do this is to assign uniform gains after ordering (1 for the top, 0 for the last, etc.), then train ranker on this. This is not ideal but can be better in case of too few levels for the data or too costly AGE labeling.
Implementations of Absolute Gain Estimation
There are 2 general methods to obtain non-binary ranking-like labels:
|
Method
|
Predefined levels
|
Slider-like
|
|
UX Implementation
|
Radio buttons
|
Slider
|
|
Number of distinct levels
|
2-5
|
10-100
|
|
Levels naming
|
Named, e.g. Perfect/Good/Fair/Bad
|
Not named
|
|
Guidelines
|
Clear, distinctive
|
Short, general, unbiased
|
|
Judges’ requirements
|
High
|
Medium
|
|
Judgements per item
|
2-3 per item
|
5-10 per item
|
|
Agreement
|
Alpha Krippendorff’s
|
Correlation coefficient
|
|
Speed of judgments
|
Low
|
Medium
|
|
Interpretability
|
Medium
|
Low
|
|
Flexibility
|
Medium
|
High
|
|
Stability (anti-variance)
|
Medium
|
Low
|
|
For which tasks to use
|
Complex, formalizable, well-defined, homogenous
|
Subjective, heterogenous
|
|
Examples
|
TREC collections
Most of scientific papers in Information retrieval; in most cases, just binary: relevant/irrelevant
|
Machine Translation in Bing: “we had people just score the translation on a scale, like, just a slider, really, and tell us how good the translation was. So, it was a very simple set of instructions that the evaluators got. And the reason we do that is so that we can get very consistent results and people can understand the instructions.”
|
Again, there may be combinations of them, e.g. firstly solve binary problem (Bad vs Not bad) by Predefined levels method, then solve quality/attractiveness problem, which usually are more subjective, by Slider-like method.
Also, slider method can be used as a preliminary step to construct Predefined levels method:
- Ask multiple judges to rank items and then to explain their choices.
- Infer levels and their definitions from these explanations (e.g. cluster them and analyze).
To sum up, it may be beneficial to firstly outline the most important questions to be answered by measurement, then to collect all task specifics – what is the type of items, how hard to define ideal item, etc. – in order to finally design the most suitable measurement strategy.
by Scott Muniz | Aug 12, 2020 | Azure, Microsoft, Technology, Uncategorized
This article is contributed. See the original author and article here.
Migrating your on prem server estate to Azure is something that you’ll often hear me talk about at events, or on this blog. And when I am talking about datacentre migrations, you’ll often hear me mention how Azure Migrate can help you on that journey, with your assessment and migrations needs. Recently, when I was presenting my “Start your data centre Migration Journey with Azure Migrate” at a recent user group talk I mentioned that Azure Migrate can help you migrate from other locations such as AWS, or GCP, etc, which prompted some discussion on how at the end of my session. And I wanted to share more about that. :grinning_face:
I’ve dealt with some companies that have already moved some resources into the cloud, but not into Azure and the companies strategy or direction has changed and they are looking to consolidate everything into Azure. So, their migration path and tooling has to not only support their on prem resources it needs to support the migration from the other cloud provider as well.
Azure Migrate introduced the functionality to assess physical servers in December 2019, which was to serve an ask customers, but it also allowed those that didn’t have access to the hypervisor level of their virtual machines to make use of Azure Migrate. And ultimately this is the functionality that allows you to use Azure Migrate to assess and migrate your virtual machines from AWS, GCP or another cloud provider into Azure.
In my previous blog post and video, I talked about assessing your AWS environment with Azure Migrate.
The video below shows you the process of using Azure Migrate to migrate your AWS virtual machines into Azure. You can watch the full video here or on Microsoft Channel 9.
You can find more information here:
I hope you enjoyed the video if you have any questions feel free to leave a comment.

by Scott Muniz | Aug 12, 2020 | Uncategorized
This article is contributed. See the original author and article here.
Follow me on Twitter, happy to take your suggestions on topics or improvements /Chris
Docker solves a lot of problems like:
– Creating a reproduceable environment, great if you want Dev, Staging and Pro to look the same
– Helps with onboarding. Onboarding developers used to take weeks before they had installed all the programs, all the libraries, configured everything correctly
– Works on my machine AND in the Cloud. The Docker container is a black box that runs the same everywhere cause you specify what’s in there from, variables, libs, app and hosting layer.
– Microservice architecture, a lot of system today are split up into many small pieces APIs. To build all of these small pieces you need a container technology like Docker.
As a new developer, learning about using containers is a must as so many Companies use it and it’s used evreywhere from Web, to ML to IoT.
Here’s a collection of tutorials I wrote that takes you from the very beginning:

- Sign up for a free Azure account To use containers in the Cloud like a private registry you will need a free Azure account
- Docker part I – basics This part covers what Docker is and why I think you should use it. It brings up concepts such as images and containers and takes you through building and running your first container
- Docker part II – volumes this is about Volumes and how we can use volumes to persist data but also how we can turn our development environment into a Volume and make our development experience better
- Docker part III – databases, linking and networks this is about how to deal with Databases, putting them into containers and how to make containers talk to other containers using legacy linking but also the new standard through networks
- Docker part IV – introducing Docker Compose this is how we manage more than one service using Docker Compose ( this is 1/2 part on Docker Compose)
- Docker part V- going deeper with Docker Compose this part is the second and concluding part on Docker Compose where we cover Volumes, Environment Variables and working with Databases and Networks
- Dockerfile great practices for beginners This is a guide that will ensure your Docker Image will be as small as possible but also ensure it’s performant and you understand why you should use certain commands.
- Improve your Docker workflow with this VS Code extension VS Code can really help you with your Docker workflow with this extension, build run, author, deploy, lot’s of great commands
- This two-part series Part I, Creating your Microservices with Docker Part II, Bring your container to the Cloud show how you can use Docker to build Microservices with Docker Compose as part of building and Cloud Hosted API
- Want to keep using Docker in the Cloud? This shows how you can build your containers and bring them with you to the Cloud
- My crash course and learning journey with Docker, I describe how I as a frontend developer barely understood what I was doing to finally understanding why I needed Docker and took the needed time to learn it and leverage its features
by Scott Muniz | Aug 12, 2020 | Azure, Microsoft, Technology, Uncategorized
This article is contributed. See the original author and article here.
Authored by Grace Hsu
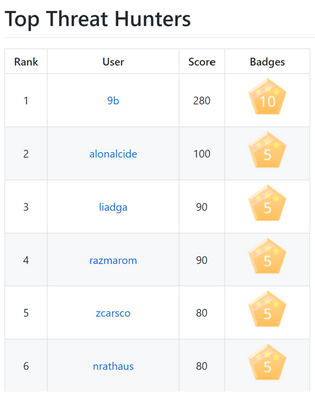
Calling all security enthusiasts! As threats evolve rapidly, the only way to stay ahead of adversaries is to join forces. Working together is critical to solve the common challenges we face. The Azure Sentinel Threat Hunters community provides opportunities for you to collaborate with other security experts, troubleshoot problems, share analytics and code, and continuously learn more about new innovations in the security space. To recognize the growing list of amazing contributors to our threat hunters community, we are excited to announce a new Azure Sentinel Github Leaderboard Program!
The Azure Sentinel Github repo is a one-stop shop for you to find, use and contribute to Azure Sentinel, including analytics rules and detections, exploration queries, workbooks, playbooks, and much more. The new leaderboard program enables us to showcase the Top 20 Threat Hunters, based on their previous GitHub contributions as well as the new value they add to Azure Sentinel!

Making any contribution in the categories listed on the Github wiki and submitting Github Issues will count towards the leaderboard. In addition to earning points to level up on the leaderboard, Threat Hunters will have the opportunity to redeem exclusive badges.
As you earn points and badges, you will unlock new Threat Hunter capabilities! Stay tuned for opportunities to learn and grow. To explore existing resources, check out the Tech Community Webinars and Security Ninja Trainings!
Learn more about the Azure Sentinel Leaderboard Program, view top contributors, and start making your way up the leaderboard by contributing to the GitHub repo!
![[Announcement] New Power Circuit Speakers Bureau Network Group](https://www.drware.com/wp-content/uploads/2020/08/large-566-710x675.)
by Scott Muniz | Aug 12, 2020 | Uncategorized
This article is contributed. See the original author and article here.
Are you part of the Microsoft Power Platform community?
Want to shout about how Power Platform has changed your life from the rooftops? Ready to share about #LessCodeMorePower magic with other technologists at virtual events around the world?
With the massive popularity of Power Platform, there is also a growing need for Power Platform speakers from ALL backgrounds, speaking different languages and sharing their unique perspectives and stories with the broader community. This is why we’ve partnered with the Chief VolunTELLer @Dona Sarkar to create the brand new Power Circuit Speaker Bureau – a place where speakers passionate about Power Platform can exchange ideas/ speaker best practices, offer up speaking opportunities/gigs with one another and help build a solid speaker community that can spread critical knowledge about Power Platform worldwide.
 Learn about the new Power Circuit Speaker Bureau
Want to dive in? Here’s how to join the Power Circuit Speaker Bureau:
1. Download the Microsoft Community Mentors app (make sure you’re on the latest v3.0!)
2. Log in with your Tech Community credentials (Note: You will need to be a member of the Humans of IT Community). If you are not already a member, you will be prompted to complete your Tech Community registration and officially join the Humans of IT community.
3. Tap “Community” on the bottom row menu on the app
4. On the top menu bar, tap “Networks”
5. Scroll down to “Power Circuit Speaker Bureau”, and hit “Join Network”
That’s it! Once you complete the 5 steps above, you’re in! Now go #DoTheThing and help grow this community of speakers so that together, you can take on the world.
#HumansofIT
#LessCodeMorePower

by Scott Muniz | Aug 12, 2020 | Uncategorized
This article is contributed. See the original author and article here.
We are constantly keeping the Microsoft Defender ATP Ninja training up-to-date to include the latest content. If you want to refresh your knowledge and get updated, here is what has been added since it was published in July:
Legend:
|
Product videos
|
 Webcast recordings Webcast recordings
|
 Tech Community Tech Community
|
|
 Docs on Microsoft Docs on Microsoft
|
 Blogs on Microsoft Blogs on Microsoft
|
 GitHub GitHub
|
|
⤴ External
|
 Interactive guides Interactive guides
|
|
|
Module
|
What’s new
|
|
SecOps Fundamentals:
Module 4. Attack surface reduction
|
|
SecOps Intermediate:
Module 2. Threat and vulnerability management
|
|
|
SecOps Expert:
Module 4. Advanced hunting
|
- Webinar series, episode 1: KQL fundamentals (MP4, YouTube)
- Webinar series, episode 2: Joins (MP4, YouTube)
- Webinar series, episode 3: Summarizing, pivoting, and visualizing Data (MP4, YouTube)
- Webinar series, episode 4: Let’s hunt! Applying KQL to incident tracking (MP4, YouTube)
|
|
SecAdmin Fundamentals:
Module 3. Grant and control access
|
|
SecAdmin Intermediate:
Module 1. Threat and vulnerability management |
|
|
SecAdmin Intermediate:
Module 2. Attack surface reduction
|
|
|
SecAdmin Expert:
Module 2. Advanced hunting
|
|

Recent Comments