by Scott Muniz | Aug 10, 2020 | Uncategorized
This article is contributed. See the original author and article here.
System Center Data Protection Manager offers enterprise grade backup and recovery of critical workloads. We are excited to announce the release of Update Rollup 2 for System Center 2019 Data Protection Manager. This update rollup includes new features, critical bugs fixes and removes deployment blockers. This blog will cover the new features that are part of this release.
Support for SQL Server Failover Cluster Instance (FCI) using Cluster Shared Volume (CSV)
A lot of SQL server users are looking to deploy SQL Server on a Failover Cluster instead of using a traditional cluster storage. This is advantageous for a couple of reasons:
- Users don’t need to carve out separate LUNs for each SQL instance.
- CSV makes SQL nodes highly available, resilient and fault tolerant by automatically routing traffic in case of node failure.
Why backup is needed for SQL Server on CSV?
SQL Server on CSVs provides users with fault tolerance, high availability and resiliency, but it doesn’t guarantee that the data is safe in event of accidental deletion of data, data corruption, or ransomware attacks. In these scenarios, users would want a solution that they can use to restore their “clean” data from a previous point in time.
DPM 2019 UR2 version introduces the support for protecting and recovering SQL Server Failover Cluster Instances on Cluster Shared Volumes. If you were already using SQL Server on CSVs, you can go ahead and start protecting your SQL DBs with DPM 2019 UR2. Learn more.
Optimized Migration for Backed Up Workloads
DPM 2019 supports a key customer requirement–migration of backed up workload data. There are several reasons why backed up workload migration is needed:
- Backups take long time due to high fragmentation on current backup volume
- The current backup volume could have reached the limit of maximum allowed storage size
- The underlying storage box can have hardware issues and need to be retired
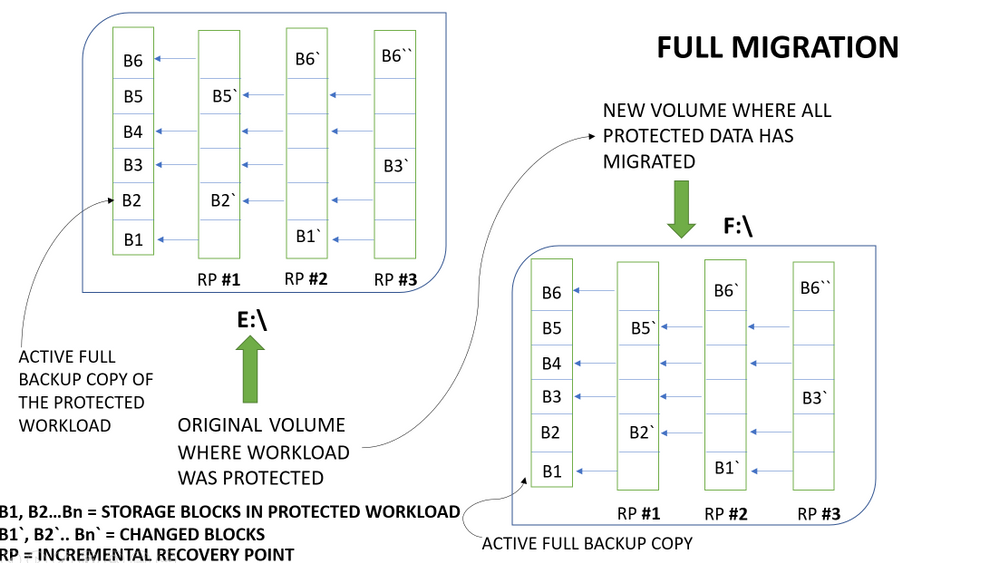
The visualization below explains how DPM currently implements backed up workload migration:

The above example represents a file which has 6 blocks of data – B1 to B6. The incremental recovery points store the changed blocks and metadata about unchanged blocks.
With this implementation of backed up workload migration, all the backup data (the full backup copy along with recovery points) is copied from the old backup volume to the new backup volume.
What’s new with DPM 2019 UR2 optimized migration?
DPM 2019 UR2 introduces the concept of optimized migration, which allows you to move protected workloads from an old volume to a new volume in a much faster way. The enhanced migration process migrates only active backup copy (Active Replica) to the new volume. All the new recovery points are created on the new volume while existing recovery points are maintained on the existing volume. This less data transfer compared to the full volume migration approach results in a faster data source migration.
The visualization below explains how DPM implements optimized migration:

With this implementation of optimized migration for backup workload data, only the full backup copy is copied from the old backup volume to the new backup volume. As the old recovery points are kept on the existing volume and only the full backup copy is migrated to the new volume, the migration process finishes fast. For more information on how to enable this feature in DPM 2019 UR2, please refer to the documentation here.
SQL Server 2019 support as DPM database
SQL Server 2019 is the latest version of SQL Server. Since a lot of SQL users have migrated to SQL 2019, DPM has also introduced support for SQL 2019 as its database starting DPM 2019 UR2 release.
Now you can install SQL Server 2019 on a remote server, or on the DPM server. The database must be installed and running before you install DPM. Learn more.
Offline Backup using Azure Data Box
With DPM 2019 UR1 we announced the preview of offline seeding using Azure Data Box integration and now with UR2, this feature is open for any DPM customer to try out.
With this integration, DPM customers can overcome the challenge of moving terabytes of backup data from on-premises to Azure storage. This also reduces the time a customer takes to onboard to Azure backup for long term retention of on-premises workload backups. This also reduces the time a customer takes to onboard to Azure backup for long-term retention of on-premises workload backups.
The below graphic illustrates how the offline seeding works for DPM customers looking to move terabytes of backup data to Azure storage. Learn More.

In addition, here is a link to the list of issues that have been fixed as part of the UR2 release for DPM.
We hope you are as excited about the release of Update Rollup 2 for DPM 2019 as we are. We will continue to work on more updates and new features, and we would love to hear your feedback in the comments section below!
by Scott Muniz | Aug 9, 2020 | Alerts, Microsoft, Technology, Uncategorized
This article is contributed. See the original author and article here.
Last time we look at how to get started with GraphQL on dotnet and we looked at the Azure App Service platform to host our GraphQL server. Today we’re going to have a look at a different approach, using Azure Functions to create run GraphQL in a Serverless model. We’ll also look at using JavaScript (or specifically, TypeScript) for this codebase, but there’s no reason you couldn’t deploy a dotnet GraphQL server on Azure Functions or deploy JavaScript to App Service.
Getting Started
For the server, we’ll use the tooling provided by Apollo, specifically their server integration with Azure Functions, which will make it place nicely together.
We’ll create a new project using Azure Functions, and scaffold it using the Azure Functions Core Tools:
func init graphql-functions --worker-runtime node --language typescript
cd graphql-functions
If you want JavaScript, not TypeScript, as the Functions language, change the --language flag to javascript.
Next, to host the GraphQL server we’ll need a Http Trigger, which will create a HTTP endpoint in which we can access our server via:
func new --template "Http Trigger" --name graphql
The --name can be anything you want, but let’s make it clear that it’s providing GraphQL.
Now, we need to add the Apollo server integration for Azure Functions, which we can do with npm:
npm install --save apollo-server-azure-functions
Note: if you are using TypeScript, you need to enable esModuleInterop in your tsconfig.json file.
Lastly, we need to configure the way the HTTP Trigger returns to work with the Apollo integration, so let’s open function.json within the graphql folder, and change the way the HTTP response is received from the Function. By default it’s using a property of the context called res, but we need to make it explicitly return be naming it $return:
{
    "bindings": [
        {
            "authLevel": "function",
            "type": "httpTrigger",
            "direction": "in",
            "name": "req",
            "methods": ["get", "post"]
        },
        {
            "type": "http",
            "direction": "out",
            "name": "$return"
        }
    ],
    "scriptFile": "../dist/graphql/index.js"
}
Implementing a Server
We’ve got out endpoint ready, it’s time to start implementing the server, which will start in the graphql/index.ts file. Let’s replace it with this chunk:
import { ApolloServer, gql } from "apollo-server-azure-functions";

const typeDefs = gql`
    type Query {
        graphQLOnAzure: String!
    }
`;
const resolvers = {
    Query: {
        graphQLOnAzure() {
            return "GraphQL on Azure!";
        }
    }
};

const server = new ApolloServer({ typeDefs, resolvers });
export default server.createHandler();
Let’s talk about what we did here, first up we imported the ApolloServer which is the server that will handle the incoming requests on the HTTP Trigger, we use that as the very bottom by creating the instance and exporting the handler as the module export.
Next, we imported gql, which is a template literal that we use to write our GraphQL schema in. The schema we’ve created here is pretty basic, it only has a single type, Query on it that has a single member to output.
Lastly, we’re creating an object called resolvers, which are the functions that handle the request when it comes in. You’ll notice that this object mimics the structure of the schema we provided to gql, by having a Query property which then has a function matching the name of the available queryable values.
This is the minimum that needs to be done and if you fire up func start you can now query the GraphQL endpoint, either via the playground of from another app.
Implementing our Quiz
Let’s go about creating a more complex solution, we’ll implement the same Quiz that we did in dotnet.
We’ll start by defining the schema that we’ll have on our server:
const typeDefs = gql`
    type Quiz {
        id: String!
        question: String!
        correctAnswer: String!
        incorrectAnswers: [String!]!
    }

    type TriviaQuery {
        quizzes: [Quiz!]!
        quiz(id: String!): Quiz!
    }

    schema {
        query: TriviaQuery
    }
`;
Now we have two types defined, Quiz and TriviaQuery, then we’ve added a root node to the schema using the schema keyword and then stating that the query is of type TriviaQuery.
With that done, we need to implement the resolvers to handle when we request data.
const resolvers = {
    TriviaQuery: {}
};
This will compile and run, mostly because GraphQL doesn’t type check that the resolver functions are implemented, but you’ll get a bunch of errors, so instead we’ll need implement the quizzes and quiz resolver handlers.
Handling a request
Let’s implement the quizzes handler:
const resolvers = {
    TriviaQuery: {
        quizzes: (parent, args, context, info) => {
            return null;
        }
    }
};
The function will receive 4 arguments, you’ll find them detailed on Apollo’s docs, but for this handler we really only need one of them, context, and that will be how we’ll get access to our backend data source.
For the purposes of this blog, I’m skipping over the implementation of the data source, but you’ll find it on my github.
const resolvers = {
    TriviaQuery: {
        quizzes: async (parent, args, context, info) => {
            const questions = await context.dataStore.getQuestions();
            return questions;
        }
    }
};
You might be wondering how the server knows about the data store and how it got on that context argument. This is another thing we can provide to Apollo server when we start it up:
const server = new ApolloServer({
    typeDefs,
    resolvers,
    context: {
        dataStore
    }
});
Here, dataStore is something imported from another module.
Context gives us dependency injection like features for our handlers, so they don’t need to establish data connections themselves.
If we were to open the GraphQL playground and then execute a query like so:
query {
    quizzes {
        question
        id
        correctAnswer
        incorrectAnswers
    }
}
We’ll get an error back that Quiz.correctAnswer is a non-null field but we gave it null. The reason for this is that our storage type has a field called correct_answer, whereas our model expects it to be correctAnswer. To address this we’ll need to do some field mapping within our resolver so it knows how to resolve the field.
const resolvers = {
    TriviaQuery: {
        quizzes: async (parent, args, context, info) => {
            const questions = await context.dataStore.getQuestions();
            return questions;
        }
    },

    Quiz: {
        correctAnswer: (parent, args, context, info) => {
            return parent.correct_answer;
        },

        incorrectAnswers: (parent, args, context, info) => {
            return parent.incorrect_answers;
        }
    }
};
This is a resolver chain, it’s where we tell the resolvers how to handle sub-fields of an object and it acts just like a resolver itself, so we have access to the same context and if we needed to do another DB lookup, we could.
Note: These resolvers will only get called if the fields are requested from the client. This avoids loading data we don’t need.
You can go ahead and implement the quiz resolver handler yourself, as it’s now time to deploy to Azure.
Disabling GraphQL Playground
We probably don’t want the Playground shipping to production, so we’d need to disable that. That’s done by setting the playground property of the ApolloServer options to false. For that we can use an environment variable (and set it in the appropriate configs):
const server = new ApolloServer({
    typeDefs,
    resolvers,
    context: {
        dataStore
    },
    playground: process.env.NODE_ENV === "development"
});
For the sample on GitHub, I’ve left the playground enabled.
Deploying to Azure Functions
With all the code complete, let’s look at deploying it to Azure. For this, we’ll use a standard Azure Function running the latest Node.js runtime for Azure Functions (Node.js 12 at the time of writing). We don’t need to do anything special for the Functions, it’s already optimised to run a Node.js Function with a HTTP Trigger, which is all this really is. If we were using a different runtime, like .NET, we’d follow the standard setup for a .NET Function app.
To deploy, we’ll use GitHub Actions, and you’ll find docs on how to do that already written, and I’ve done a video on this as well. You’ll find the workflow file I’ve used in the GitHub repo.
With a workflow committed and pushed to GitHub and our App Service waiting, the Action will run and our application will be deployed. The demo I created is here.
Conclusion
Throughout this post we’ve taken a look at how we can create a GraphQL server running inside a JavaScript Azure Functions using the Apollo GraphQL server, before finally deploying it to Azure.
When it comes to the Azure side of things, there’s nothing different we have to to do run the GraphQL server in Azure Functions, it’s just treated as a HTTP Trigger function and Apollo has nice bindings to allow us to integrate the two platforms together.
Again, you’ll find the complete sample on my GitHub for you to play around with yourself.
This post was originally published on www.aaron-powell.com.
by Scott Muniz | Aug 9, 2020 | Uncategorized
This article is contributed. See the original author and article here.
> This is a set of tutorials that was just released on the topic of Node.js. It takes you from the very beginning of your developer journey with Node.js to tell you the what and whys of Node.js to teaching you debugging, file management, dependency management, and even web development.
The full path is found here LEARN module path on Node.js
-1- Introduction to Node.js
This is a great primer if you are considering to use Node.js. It will explain the why but also show you can use it from the command-line.
This module teaches you the following:
- Explain what Node.js is
- Describe how Node.js works
- Identify when to use Node.js
- Create and run a Node.js script from the command line
Introduction to Node.js
-2- Create a new Node.js project and work with dependencies
Node.js has a rich ecosystem of packages that you can install and use in your app. Once installed these packages becomes dependencies that you need to learn how to manage as they will be with the project for a while. This module, therefore, teaches dependency management but also everything that goes with it like:
- Initialize Node.js projects
- Understand what the manifest file package.json consist of and use it to your advantage
- Add and remove packages to your Node.js project
- Manage your package dependencies and update them in a predictable way
Manage dependencies
-3- Work with files and directories
Working with files and directories is a great skill to have regardless of the programming language used. This module takes you through a lot of things that are good to know when dealing with input and output.
Sample:
const fs = require('fs').promises;
const items = await fs.readdir("stores");
console.log(items); // [ 201, 202, sales.json, totals.txt ]
This module teaches you the following:
- Work with directories
- Create and delete files
- Read from files
- Write to files
- Parse data in files
Work with files and directories
-4- Debugging
Being able to debug efficiently can save you a lot of time. This module takes you through all that you might possibly need to know to be really good at debugging in Node.js. The module covers the following topics:
- Use VS Code debugger with a Node.js program.
- Create breakpoints and run your code step by step to find issues.
- Inspect your program state at any execution step.
- Rewind the call stack to find the source of an exception.
Debugging module
-5- Use Express to build a Web App
Sample:
const express = require('express');
const app = express();
app.get('/', (req, res) => res.send('Welcome to the app'))
app.listen(8000, () => console.log('Server up and running'))
This module teaches you the following:
- Describe the core concepts of the web framework Express
- Configure middleware to control how a request is handled
- Respond to HTTP requests with different types of content like text and JSON
- Send data to an Express endpoint
Build web apps
by Scott Muniz | Aug 8, 2020 | Alerts, Microsoft, Technology, Uncategorized
This article is contributed. See the original author and article here.
This blog is authored and technically implemented by @Hesham Saad with hearty thanks to our collaborator and use-cases executive mind brain @yazanouf
Before we dig deep on monitoring TEAMS CallRecords Activity Logs, please have a look at “Protecting your Teams with Azure Sentinel” blog post by @Pete Bryan on how to ingest TEAMS management logs into Azure Sentinel via the O365 Management Activity API
Collecting TEAMS CallRecords Activity Data
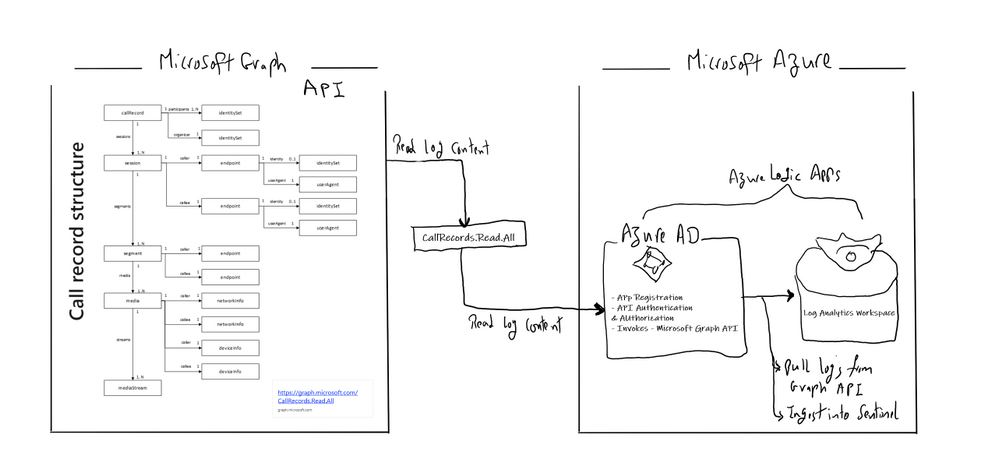
This section we will go into details on how to ingest TEAMS CallRecords activity logs into Azure Sentinel via the Microsoft Graph API and mainly leveraging CallRecords API which is a Graph webhook API that will give access to the Calls activity logs. SOC team can subscribe to changes to CallRecords via Azure Sentinel and using the Microsoft Graph webhook subscriptions capability, allowing them to build near-real-time reports from the data or to alert on specific scenarios , use cases which mentioned above.
Technically you can use the call records APIs to subscribe to call records and look up call records by IDs, the call records API is defined in the OData sub-namespace, microsoft.graph.callRecords.
So, what are the key resources types returned by the API ?
| Resource |
Methods |
Description |
| CallRecord |
Get callRecord |
Represents a single peer-to-peer call or a group call between multiple participants |
| session |
Get callRecord
List sessions |
A peer-to-peer call contains a single session between the two participants in the call. Group calls contain one or more session entities. In a group call, each session is between the participant and a service endpoint. |
| segment |
Get callRecord
List sessions |
A segment represents a media link between two endpoints. |
The callRecord entity represents a single peer-to-peer call or a group call between multiple participants, sometimes referred to as an online meeting. A peer-to-peer call contains a single session between the two participants in the call. Group calls contain one or more session entities. In a group call, each session is between the participant and a service endpoint. Each session contains one or more segment entities. A segment represents a media link between two endpoints. For most calls, only one segment will be present for each session, however sometimes there may be one or more intermediate endpoints. For more details click here
Below is the main architecture diagram including the components to deploy Teams CallRecords Activity Logs Connector:

Deployment steps:
Register an App
Create and register Azure AD APP to handle the authentication and authorization to collect data from the Graph API. Here are the steps – navigate to the Azure Active Directory blade of your Azure portal and follow the steps below:
- Click on ‘App Registrations’
- Select ‘New Registration’
- Give it a name and click Register.
- Click ‘API Permissions’ blade.
- Click ‘Add a Permission’.
- Click ‘Microsoft Graph’.
- Click ‘Application Permissions’.
- Search for ‘CallRecords’, Check CallRecords.Read.All. Also, Search for ‘Directory’ and Check Directory.ReadWrite.All and ‘Click ‘Add permissions’.
- Click ‘grant admin consent’.
- Click ‘Certificates and Secrets’.
- Click ‘New Client Secret’
- Enter a description, select ‘never’. Click ‘Add’.
- Note– Click copy next to the new secret and store it somewhere temporarily. You cannot come back to get the secret once you leave the blade.
- Copy the client Id from the application properties and store it.
- Copy the tenant Id from the main Azure Active Directory blade and store it.


Deploy a Logic App
Last step is to collect the CallRecords activity data and ingest it into Azure Sentinel via a Logic App.
Navigate to Azure Sentinel workspace, click at Playbooks blade and follow the steps below:
- Click on ‘Add Playbook’
- Select ‘Resource Group’, type a name to your logic app for example ‘TeamsCalls-SecurityGraphAPI’ and toggle on ‘Log Analytics’
- Click ‘Review + Create’ then ‘Create’
- Open your new logic app ‘TeamsCalls-SecurityGraphAPI’
- Under ‘Logic app designer’, add the following steps:
- Add ‘Recurrence’ step and set the value to 10 minute for example
- Add ‘HTTP’ step to create CallRecords subscriptions, creating a subscriptions will subscribe a listener application to receive change notifications when the requested type of changes occur to the specified resource in Microsoft Graph, for more details on Create Subscriptions via Microsoft Graph API
- Method: POST
- URI: https://graph.microsoft.com/beta/subscriptions
- Body, note that you can edit ‘changeType’ value with ‘created,updated’ for example, ‘notificationUrl’ is the subscription notification endpoint for more details on notificationUrl
-
{
  "changeType": "created",
  "clientState": "secretClientValue",
  "expirationDateTime": "2022-11-20T18:23:45.9356913Z",
  "latestSupportedTlsVersion": "v1_2",
  "notificationUrl": "https://outlook.office.com/webhook/3ec886e9-86ef-4c86-bfff-2d0321f3313e@2006d214-5f91-4166-8d92-95f5e3ad9ec6/IncomingWebhook/9c6e121ed--x-x-x-x99939f71721fcbcc7/03c99422-50b0-x-x-x-ea-a00e-2b0b-x-x-x-12d5",
  "resource": "/communications/callRecords"
}
- Authentication Type: Active Directory OAuth
- Tenant: with Tenant ID copied above
- Audience: https://graph.microsoft.com
- Client ID: with Client ID copied above
- Credential Type: Secret
- Secret: with Secret value copied above
- Add ‘HTTP’ step to list all subscriptions:
- Method: GET
- URI: https://graph.microsoft.com/v1.0/subscriptions
- Authentication Type: Active Directory OAuth
- Tenant: with Tenant ID copied above
- Audience: https://graph.microsoft.com
- Client ID: with Client ID copied above
- Credential Type: Secret
- Secret: with Secret value copied above
- If you want to get all sessions details per specific call record session ID follow the below steps, noting that the below example is for a single CallRecord Session ID for the sake of demonstration and hence we added a variable item, you can simply add a loop step to get all sessions IDs from the created CallRecords subscription step:
- Method: GET
- URI: https://graph.microsoft.com/beta/communications/callRecords/@{variables(‘TEAMSCallRecordsID’)}/sessions
- Authentication Type: Active Directory OAuth
- Tenant: with Tenant ID copied above
- Audience: https://graph.microsoft.com
- Client ID: with Client ID copied above
- Credential Type: Secret
- Secret: with Secret value copied above
- Add ‘Send TEAMS CallRecords Data to Azure Sentinel LA-Workspace’ step, after doing the connection successfully via your Azure Sentinel Workspace ID & Primary key:
- JSON Request Body: Body
- Custom Log Name: TEAMSGraphCallRecords


The complete Playbook code view have been uploaded to github repo as well, please click here for more details and check out the readme section.
Monitoring TEAMS CallRecords Activity
When the Playbook run successfully, it will create a new custom log table ‘TEAMSGraphCallRecords_CL’ that will have the CallRecords activity logs, you might wait for a few minutes till the new CL table been created and the CallRecords activity logs been ingested.
Navigate to Azure Sentinel workspace, click at Logs blade and follow the steps below:
- Tables > Group by: Solution > Custom Logs: TEAMSGraphCallRecords_CL
- Below are the list of main attributes that have been ingested:
- TimeGenerated
- Type_s: groupCall
- modalities_s: Audio, Video, ScreenSharing, VideoBasedScreenSharing
- LastModifiedDateTime
- StartDateTime, endDateTime
- joinWebUrl_s
- organizer_user_displayname_s
- participants_s
- sessions_odata_context_s
- As you can see from the results below we get the complete TEAMS CallRecords activity logs.

Parsing the Data
Before building any detections or hunting queries on the ingested TEAMS CallRecords Activity data we can parse and normalize the data via a KQL Function to make it easier to use:

The parsing function have been uploaded as well to the github repo.
Part (2): we will share a couple of hunting queries and upload them to github, it’s worth to explore Microsoft Graph API as there are other TEAMS related APIs logs that can be ingested based on the requirements and use cases:
- TeamsActivity:
- Read all users’ teamwork activity feed
- TeamsAppInstallation:
- Read installed Teams apps for all chats
- Read installed Teams apps for all teams
- Read installed Teams apps for all users
- TeamsApp
- Read all users’ installed Teams apps
…etc

We will be continuing to develop detections and hunting queries for Microsoft 365 solutions data over time so make sure you keep an eye on GitHub. As always if you have your own ideas for queries or detections please feel free to contribute to the Azure Sentinel community.
by Scott Muniz | Aug 7, 2020 | Uncategorized
This article is contributed. See the original author and article here.
Do you have data going into S3 Buckets as files that you want to ingest into Azure Sentinel?
In this blog, I will show you how to create an AWS Lambda function running PowerShell to ingest the data into Azure Sentinel.
Spoiler (Highlight to read)
If you want to get right to the code. go
here.
If you want to get right to the code. go here.
Setup
To deploy this, you will need a machine prepared with the following:
- PowerShell Core – I recommend PowerShell 7 found here
- .Net Core 3.1 SDK found here
- AWSLambdaPSCore module – You can install this either from the PowerShell Gallery, or you can install it by using the following PowerShell Core shell command:
- Install-Module AWSLambdaPSCore -Scope CurrentUser
See the documentation here https://docs.aws.amazon.com/lambda/latest/dg/powershell-devenv.html
I recommend you review https://docs.aws.amazon.com/lambda/latest/dg/powershell-package.html to review the cmdlets that are part of AWSLambdaPSCore.
Review of the Code
Our script will be triggered when a log file is created in an S3 bucket. To create the base script, run the following PowerShell core command:
New-AWSPowerShellLambda -Template S3Event
The default template for and S3Event trigger is below:
# PowerShell script file to be executed as a AWS Lambda function.
#
# When executing in Lambda the following variables will be predefined.
# $LambdaInput - A PSObject that contains the Lambda function input data.
# $LambdaContext - An Amazon.Lambda.Core.ILambdaContext object that contains information about the currently running Lambda environment.
#
# The last item in the PowerShell pipeline will be returned as the result of the Lambda function.
#
# To include PowerShell modules with your Lambda function, like the AWS.Tools.S3 module, add a "#Requires" statement
# indicating the module and version. If using an AWS.Tools.* module the AWS.Tools.Common module is also required.
#
# The following link contains documentation describing the structure of the S3 event object.
# https://docs.aws.amazon.com/AmazonS3/latest/dev/notification-content-structure.html

#Requires -Modules @{ModuleName='AWS.Tools.Common';ModuleVersion='4.0.6.0'}
#Requires -Modules @{ModuleName='AWS.Tools.S3';ModuleVersion='4.0.6.0'}

# Uncomment to send the input event to CloudWatch Logs
# Write-Host (ConvertTo-Json -InputObject $LambdaInput -Compress -Depth 5)

foreach ($record in $LambdaInput.Records) {
  $bucket = $record.s3.bucket.name
  $key = $record.s3.object.key

  Write-Host "Processing event for: bucket = $bucket, key = $key"

  # TODO: Add logic to handle S3 event record, for example
  $obj = Get-S3Object -Bucket $bucket -Key $key
  Write-Host "Object $key is $($obj.Size) bytes"
}
As you can see for each CreateObject event from S3 the default script pulls the bucket name ($bucket = $record.s3.bucket.name) and filename ($key = $record.s3.object.key) Then Write-Host will send an output to CloudWatch logs. Lastly it gets the file size using the Get-S3object cmdlet.
I used this basic template as a starter template. First, I added a function called Write-OMSLogFile which I got from Travis Roberts on GitHub here. In short, the function takes a hash table with the log data and a few parameters and uploads it to the Log Analytics REST API. The documentation on this API is here. The function needs three parameters you will need to provide:
- Line 158 – $WorkspaceId – you will need to enter the workspace id
- Line 159 – $WorkspaceKey – you will need to enter the workspace key
- Line 160 – $CustomLogName – you will need to enter the Custom Log name you want to use for the data.
After we have those setup, the first action we need to do is download the file from S3 to tmp storage.
Write-Host "Downloading $key to /tmp/$key"
Read-S3Object -BucketName $bucket -Key $key -File "/tmp/$key"
Write-Host "Downloaded $key to /tmp/$key"
Once we have the file, we need to process the file based on file type. I have made some simple assumptions.
- If its .csv its CSV data which is easy to import to a hash table using Import-CSV.
- If its .json, its JSON data which is easy to import to hash table using Get-Content | ConvertFrom-JSON
- Lastly, if it’s a .log file the data contains CEF formatted data which takes some special processing.
- I used some REGEX and splitting to break apart the CEF Message and then build a hash table of records.
- Or its not supported in this function yet.
#Determine if CSV or JSON or whatever
$FileName = "/tmp/$key"
if ($fileName -like "*.csv") {
  Write-Host "Handling CSV File"
  $data = import-csv $filename
}
elseif ($filename -like "*.json") {
  Write-Host "Handling JSON File"
  $Data = Get-Content $filename | ConvertFrom-Json
}
elseif ($filename -like "*.log") {
  Write-Host "Handling Log File"
  #Assuming CEF formatted logs
  $cefdata = Get-Content $filename
  $data = @()
  $cefmsg = @{}
  foreach ($line in $cefdata) {
    if ($line -like "*CEF:*") {
      #Write-Host "Handling CEF Data"
      $CEFtimegenerated = ($line -split '(?<time>(?:w+ +){2,3}(?:d+:){2}d+|d{4}-d{2}-d{2}Td{2}:d{2}:d{2}.[w-:+]{3,12})')[1]
      #$CEFHost = (($line -split '(?<time>(?:w+ +){2,3}(?:d+:){2}d+|d{4}-d{2}-d{2}Td{2}:d{2}:d{2}.[w-:+]{3,12})')[2] -split "CEF:")[0]
      #$CEFVersion = $line.Split("CEF: ").Split("|")[1]
      $CEFDeviceVendor = $line.split("|")[1]
      $CEFDeviceProduct = $line.split("|")[2]
      $CEFDeviceVersion = $line.split("|")[3]
      $CEFDeviceEventClassId = $line.split("|")[4]
      $CEFName = $line.split("|")[5]
      $CEFSeverity = $line.split("|")[6]
      $CEFExtension = $line.split("|")[7] -split '([^=s]+=(?:[]=|[^=])+)(?:s|$)'
      foreach ($extenstion in $CEFExtension) {
        if ($extenstion -like "*=*") { $cefmsg += @{$extenstion.Split("=")[0] = $extenstion.Split("=")[1] } }
      }
      $CEFmsg += @{TimeGenerated = $CEFtimegenerated }
      $CEFmsg += @{DeviceVendor = $CEFDeviceVendor }
      $CEFmsg += @{DeviceProduct = $CEFDeviceProduct }
      $CEFmsg += @{DeviceVersion = $CEFDeviceVersion }
      $CEFmsg += @{DeviceEventClassID = $CEFDeviceEventClassId }
      $CEFmsg += @{Activity = $CEFName }
      $CEFmsg += @{LogSeverity = $CEFSeverity }
      $data += $CEFmsg
      $cefmsg = @{}
    }
  }
  Write-Host "Finished Handling Log file"
}
else { Write-Host "$filename is not supported yet" }
Next we can upload the data to Log Analytics. The API supports up to 30MB per upload. Since FileSize is not equal to HashTable size which is normally less than JSON actual size, we need to convert the data to JSON and measure the actual size. I created a loop to add each record to a temp object until that object is greater than 25MB then upload that chunk and start over. I used 25MB as a safety. If its less than 25MB to start with then just upload the data as is.
#Test Size; Log A limit is 30MB
$tempdata = @()
$tempDataSize = 0
Write-Host "Checking if upload is over 25MB"
if ((($Data | Convertto-json -depth 20).Length) -gt 25MB) {
  Write-Host "Upload needs to be split"
  foreach ($record in $data) {
    $tempdata += $record
    $tempDataSize += ($record | ConvertTo-Json -depth 20).Length
    if ($tempDataSize -gt 25MB) {
       Write-OMSLogfile -dateTime (Get-Date) -type $CustomLogName -logdata $tempdata -CustomerID $workspaceId -SharedKey $workspaceKey
       Write-Host "Sending data = $TempDataSize"
       $tempdata = $null
       $tempdata = @()
       $tempDataSize = 0
    }
  }
  Write-Host "Sending left over data = $Tempdatasize"
  Write-OMSLogfile -dateTime (Get-Date) -type $CustomLogName -logdata $tempdata -CustomerID $workspaceId -SharedKey $workspaceKey
}
Else {
  #Send to Log A as is
  Write-Host "Upload does not need to be split, sending to Log A"
  Write-OMSLogfile -dateTime (Get-Date) -type $CustomLogName -logdata $Data -CustomerID $workspaceId -SharedKey $workspaceKey
}
Lastly we need to clean up the file we downloaded.
Remove-Item $FileName -Force
Deploy the code
The Lambda function will need an execution role defined that grants access to the S3 bucket and CloudWatch logs. To create an execution role:
- Open the roles page in the IAM console.
- Choose Create role.
- Create a role with the following properties.
- Trusted entity – AWS Lambda.
- Permissions – AWSLambdaExecute.
- Role name – lambda-s3-role.
The AWSLambdaExecute policy has the permissions that the function needs to manage objects in Amazon S3 and write logs to CloudWatch Logs. Copy the Amazon Resource Name (ARN) of the role created as you will need it for the next step.
To deploy the PowerShell script, you can create a Package (zip file) to upload to the AWS console or you can use the Publish-AWSPowerShell cmdlet. We will use the cmdlet.
Publish-AWSPowerShellLambda -Name YourLambdaNameHere -ScriptPath <path>/S3Event.ps1 -Region <region> -IAMRoleArn <arn of role created earlier> -ProfileName <profile>
You might need –ProfileName if your configuration of .aws/credentials file doesn’t contain a default. See this document for information on setting up your AWS credentials.
Here is the sample output from my running of the cmdlet.
…....
... zipping:   adding: runtimes/win/lib/netcoreapp3.1/Modules/Microsoft.WSMan.Management/Microsoft.WSMan.Management.psd1 (deflated 42%)
... zipping:   adding: runtimes/win/lib/netcoreapp3.1/Modules/CimCmdlets/CimCmdlets.psd1 (deflated 44%)
... zipping:   adding: runtimes/win/lib/netcoreapp3.1/Modules/Microsoft.PowerShell.Diagnostics/Microsoft.PowerShell.Diagnostics.psd1 (deflated 42%)
... zipping:   adding: runtimes/win/lib/netcoreapp3.1/Modules/Microsoft.PowerShell.Diagnostics/Event.format.ps1xml (deflated 58%)
... zipping:   adding: runtimes/win/lib/netcoreapp3.1/Modules/Microsoft.PowerShell.Diagnostics/Diagnostics.format.ps1xml (deflated 54%)
... zipping:   adding: runtimes/win/lib/netcoreapp3.1/Modules/Microsoft.PowerShell.Diagnostics/GetEvent.types.ps1xml (deflated 55%)
... zipping:   adding: runtimes/win/lib/netcoreapp3.1/Modules/Microsoft.PowerShell.Security/Microsoft.PowerShell.Security.psd1 (deflated 42%)
... zipping:   adding: runtimes/win/lib/netcoreapp3.1/Modules/PSDiagnostics/PSDiagnostics.psm1 (deflated 59%)
... zipping:   adding: runtimes/win/lib/netcoreapp3.1/Modules/PSDiagnostics/PSDiagnostics.psd1 (deflated 42%)
... zipping:   adding: runtimes/unix/lib/netcoreapp3.1/Modules/Microsoft.PowerShell.Utility/Microsoft.PowerShell.Utility.psd1 (deflated 59%)
... zipping:   adding: runtimes/unix/lib/netcoreapp3.1/Modules/Microsoft.PowerShell.Management/Microsoft.PowerShell.Management.psd1 (deflated 60%)
... zipping:   adding: runtimes/unix/lib/netcoreapp3.1/Modules/Microsoft.PowerShell.Host/Microsoft.PowerShell.Host.psd1 (deflated 35%)
... zipping:   adding: runtimes/unix/lib/netcoreapp3.1/Modules/Microsoft.PowerShell.Security/Microsoft.PowerShell.Security.psd1 (deflated 39%)
Created publish archive (/private/var/folders/hv/786wbs4n13ldvz9765nx8nv40000gn/T/S3toSentinel/bin/Release/netcoreapp3.1/S3toSentinel.zip).
Creating new Lambda function S3toSentinel
New Lambda function created
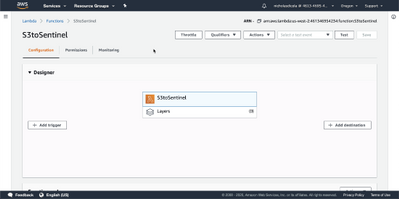
Once created, login to the AWS console. In Find services, search for Lambda. Click on Lambda.
Click on the lambda function name you used with the cmdlet. Click Add Trigger

Select S3. Select the bucket. Acknowledge the warning at the bottom. Click Add.

Your lambda function is ready to send data to Log Analytics.
Test the Code
To test your function, upload a support file to the S3 bucket defined in the trigger.

To view the results of your test, go the Lambda function. Click Monitoring tab. Click view logs in CloudWatch.

In CloudWatch, you will see each log stream from the runs. Select the latest. Here you can see anything from the script from the Write-Host cmdlet.

Go to portal.azure.com and verify your data is in the custom log. Run a query for your <CustomLogName>_CL. If this is a new custom log it may take a few minutes for results to show up. For more on queries see https://docs.microsoft.com/azure/azure-monitor/log-query/get-started-queries

NOTE: To process large files, you may need to increase the Lambda function timeout. For more information on timeouts see https://docs.aws.amazon.com/lambda/latest/dg/gettingstarted-limits.html

Next Steps:
I hope this will help some folks solve a unique challenge! You can find the full code and README here.
Thanks to @Chi_Nguyen, Joel Stidley, and @sarahyo for the help on this.
Best,
Nicholas DiCola
Security Jedi
by Scott Muniz | Aug 7, 2020 | Uncategorized
This article is contributed. See the original author and article here.
We are pleased to announce the availability of spare parts to assist enterprise customers to remove or replace SSD drives on Surface Laptop 3 (“Customer Repairable Units or CRUs”). This includes rubber feet (aka non-skid foot pads), cover screws that secure the chassis, and the single screw attached to the removable SSD (rSSD).
Commercial customers in the U.S. and Canada can place orders through their Surface Authorized Device Resellers for CRU parts will ship starting August 7, 2020. Global availability is expected later this year.
Customer repairable units
Parts are available in the following configurations:
Feet only
Bulk packages containing 30 sets of 4 feet are available in the following SKUs:
- Black. SKU #: 17M-00005
- Silver. SKU #: 17M-00006
- Teal. SKU #: 17M-00007
- Sandstone. SKU #: 17M-00008
Cover screws only
- Bulk package containing 30 sets of 4 screws. SKU# 17M-00009
rSSD screws only
- Bulk package containing 30 rSSD screws. SKU# 17M-000010
Removal instructions
Please note that only skilled IT technicians should attempt rSSD[1] replacement.
[1] Microsoft strongly recommends that only skilled technicians following Microsoft’s instructions perform rSSD replacement. Always use caution when undertaking do-it-yourself repair or replacement activities. Microsoft is not liable for damage to your device or any injuries sustained if you fail to follow this guidance. Further, any resulting damage to the product will not be covered under the Hardware warranty or Extended Service Plan. Depending on the service plan that you have selected, there may be a fee if you return a non-functional device without the original SSD. For more details on the service plan, features, and benefits of the coverage, please visit here for a copy of the Microsoft Complete terms and conditions.
by Scott Muniz | Aug 7, 2020 | Uncategorized
This article is contributed. See the original author and article here.
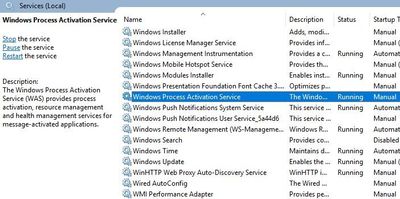
If your web applications stop responding requests, WAS is one of the services you should check first.
While troubleshooting an issue in a web server, I saw this error in the Event Viewer:
Event ID 7023: The Windows Process Activation Service service terminated with the following error: The system cannot find the file specified

Solution
Follow the steps below to fix this issue:
- Check c:/windows/system32/inetsrv/ folder. applicationHost.config file might be missing or it might be empty. If it is, go to c:/inetpub/history/ folder and copy the applicationHost.config file from there to inetsrv folder. Try to start Windows Process Activation Service again
- Go to c:inetpubtemp folder. Check if there is an apppools folder. If it doesn’t exist, create this folder. Try starting WAS again
- Open registry editor. Navigate to
HKEY_LOCAL_MACHINESYSTEMCurrentControlSetServicesWASParameters. Delete NanoSetup entry. Try again
- Go inetsrv folder. Duplicate applicationHost.config file. Name the new file applicationHost.config.tmp. Try to start Windows Process Activation Service again
by Scott Muniz | Aug 7, 2020 | Uncategorized
This article is contributed. See the original author and article here.
This week, Microsoft To Do announced the General Availability of Azure AD My Sign-Ins, the final release of the security configuration baseline settings for Windows 10 and Windows Server version 2004, and more.
@Eric Schrader is our Member of the Week, a great participant in this week’s Microsoft LIsts AMA.
View the Weekly Roundup for August 3-7 in Sway and attached PDF document.
by Scott Muniz | Aug 7, 2020 | Uncategorized
This article is contributed. See the original author and article here.
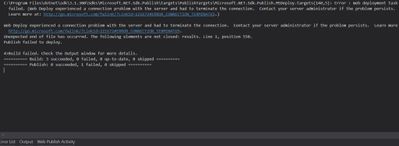
While publishing an application from Visual Studio to Azure App Service, you may come across this error message:
Web Deploy experienced a connection problem with the server and had to terminate the connection.
Learn more at: http://go.microsoft.com/fwlink/?LinkId=221672#ERROR_CONNECTION_TERMINATED

In the case I worked on, the project publishes successfully to Local IIS and Azure Functions but not to Azure App Service.
Solution
Follow the steps below to find a solution to this issue:
- Uninstall security software in the server and try again
- Make sure Management Services are installed (Add Role and Features > Web Server)
- Check if Web Management Services and Web Deploy Agent Service are running
- Make sure Fiddler or any other similar software is not running during the publish
- Check if TCP port 8172 are open
by Scott Muniz | Aug 7, 2020 | Uncategorized
This article is contributed. See the original author and article here.
In order to troubleshoot slowness in web, system administrators should analyze IIS logs, Failed Request Tracing logs, dump files, and HTTP.SYS logs to narrow down the issue.
In a slowness issue I worked on, these records in HTTPERR file took my attention:
2020-07-26 14:09:01 10.123.12.12 35316 10.12.123.123 80 - - - - - Timer_MinBytesPerSecond
2020-07-26 14:09:01 10.123.12.12 48012 10.12.123.123 80 - - - - - Timer_MinBytesPerSecond
Apparently, requests take more than 35 seconds to response due to a Timer_MinBytesPerSecond related issue.
What is MinBytesPerSecond?
It’s a parameter HTTP.SYS uses to determine what speed is allowed for the response to the client.
From the official document:
Specifies the minimum throughput rate, in bytes, that HTTP.sys enforces when it sends a response to the client. The minBytesPerSecond attribute prevents malicious or malfunctioning software clients from using resources by holding a connection open with minimal data. If the throughput rate is lower than the minBytesPerSecond setting, the connection is terminated.
The current implementation only terminates the connection after the time it would have taken to stream the entire response back to the connecting client at the minimum bandwidth transfer rate has elapsed. If the transfer rate goes below the value specified by minBytesPerSecond only for a small period of time, but the overall transfer rate is higher, the connection will not be terminated.
The default value is 240.
Solution
HTTP.SYS logs above shows that the root cause of the issue is the slow response throughput. The client is not receiving IIS response at a reasonable speed.
For Windows Server 2012 R2 (it was the server I worked on), IIS wants to send response at minimum 240 bytes per second. If the client cannot receive it at this minimum speed, IIS terminates the connection. This logic prevents the server against denial-of-service (DoS) attacks.
- Find out which clients are causing this issue
- The client machines might be in a slow network. If the issue is caused by the same client(s), you may be able to improve their condition to solve the issue
- Find out client IP addresses in the HTTPERR file and investigate their network as well as their OS
Remove or alter the threshold for minimum response rate
- If the client IPs are legit (not malicious sources or possible attackers), set
minBytesPerSecond to 0
- If the issue doesn’t happen again, play around the value (Try 500). It’s not recommended to set it 0 because it may make your application vulnerable to DoS attacks
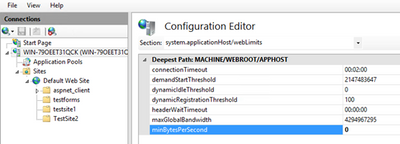
- Steps for changing
minBytesPerSecond:
- Go to IIS Manager
- Click on the server name
- Double click on Configuration Editor
- Go to “system.applicationHost/webLimits”
- Configure
minBytesPerSecond
- Reset IIS


Recent Comments