This article is contributed. See the original author and article here.
We will have our Service Fabric Community Q&A call for this month on Oct 15th 10am PDT.
Starting Aug 2020, we introduced a framework for our monthly community session. In addition to our normal Q&A in each community call we will focus on topics related to various components of the Service Fabric platform, provide updates to roadmap, upcoming releases, and showcase solutions developed by customers that benefit the community.
Join us to learn more on the above topics with cool demos on how to use them and ask us any questions related to Service Fabric, containers in Azure, etc. This month’s Q&A features one session on:
This article is contributed. See the original author and article here.
Be Inspired by the power of Microsoft 365 at the European SharePoint Conference (ESPC20) Online – powered by Microsoft Teams.
You’ll find expert-led tutorials (workshops), visionary keynotes, and informative breakout sessions, delivered by the world’s best independent Microsoft 365 experts and the incredible Microsoft Redmond team behind the products.
Take time to learn, ask questions and engage with fellow delegates via 1:1 chats or group networking to discover top tricks and helpful insights – all to help plan and ready for the next phases of your productivity updates and new ways of working.
Jeff Teper (CVP, Microsoft) and other Microsoft leaders will be giving keynotes that spans the globe and topics, plus Microsoft speakers delivering breakout sessions among thought leaders and members of the community from around the world. Review all Microsoft keynotes and sessions below and start your world journey today.
What: European SharePoint Conference 2020 – Online to learn more. Session schedule lists times in CEST; recordings will be available to watch post conference for registered delegates.
When: October 14th – 16th, 2020 (keynotes & sessions)
October 12th & 16th (pre- and post-event tutorials (workshops))
Presenters: 100+ sessions, 120+ speakers (MVPs, RDs, Microsoft and community members)
Cost: €49 – €339 (session and/or tutorial; discounts available for groups) | Book now
European SharePoint Conference 2020 – Online – October 14-16, 2020 (online training); pre- and post-event tutorial (workshops) October 12th & 16th.
ESPC20 Online offers you affordable, world-class Microsoft 365 learning at your fingertips, from wherever you are. Tune in live or catch up on-demand across 100+ sessions SharePoint, Office 365 & Azure experts including Microsoft team members, independent community leaders, RDs, MVPs & MCMs covering SharePoint, OneDrive, Yammer, Azure Arc, Power Apps, Microsoft Teams, Microsoft Stream, Microsoft Graph, Logic Apps, SharePoint Framework, Office 365 eDiscovery, PnP PowerShell, Microsoft Information Protection & Security, and so much more.
Hear from the best of the best – Microsoft Product Team members, RDs, MVPs, MCMs and independent experts.
All Microsoft keynotes, breakout sessions, and tutorial (workshop)
Shout out to community members Tracy O’Connell, Ray Glasheen and the #ESPC20 crew who are working hard to make it a great, virtual event – supporting and promoting the knowledge and expertise that reaffirms this: Microsoft 365 has the best tech community in the world – one that spans all oceans and continents.
ESPC is a chance to escape your daily routine and take the time to focus on you and your professional development.
This article is contributed. See the original author and article here.
One common challenge with Postgres for those of you who manage busy Postgres databases, and those of you who foresee being in that situation, is that Postgres does not handle large numbers of connections particularly well.
While it is possible to have a few thousand established connections without running into problems, there are some real and hard-to-avoid problems.
Since joining Microsoft last year in the Azure Database for PostgreSQL team—where I work on open source Postgres—I have spent a lot of time analyzing and addressing some of the issues with connection scalability in Postgres.
In this post I will explain why I think it is important to improve Postgres’ handling of large number of connections. Followed by an analysis of the different limiting aspects to connection scalability in Postgres.
In an upcoming post I will show the results of the work we’ve done to improve connection handling and snapshot scalability in Postgres—and go into detail about the identified issues and how we have addressed them in Postgres 14.
Why connection scalability in Postgres is important
In some cases problems around connection scalability are caused by unfamiliarity with Postgres, broken applications, or other issues in the same vein. And as I already mentioned, some applications can have a few thousand established connections without running into any problems.
A frequent counter-claim to requests to improve Postgres’ handling of large numbers of connection counts is that there is nothing to address. That the desire/need to handle large numbers of connection is misguided, caused by broken applications or similar. Often accompanied by references to the server only having a limited number of CPU cores.
There certainly are cases where the best approach is to avoid large numbers of connections, but there are—in my opinion—pretty clear reasons for needing larger number of connections in Postgres. Here are the main ones:
Central state and spikey load require large numbers of connections: It is common for a database to be the shared state for an application (leaving non-durable caching services aside). Given the cost of establishing a new database connection (TLS, latency, and Postgres costs, in that order) it is obvious that applications need to maintain pools of Postgres connections that are large enough to handle the inevitable minor spikes in incoming requests. Often there are many servers running [web-]application code using one centralized database.
To some degree this issue can be addressed using Postgres connection poolers like PgBouncer or more recently Odyssey. To actually reduce the number of connections to the database server such poolers need to be used in transaction (or statement) pooling modes. However, doing so precludes the use of many useful database features like prepared statements, temporary tables, …
Latency and result processing times lead to idle connections: Network latency and application processing times will often result in individual database connections being idle the majority of the time, even when the applications are issuing database requests as fast as they can.
Common OLTP database workloads, and especially web applications, are heavily biased towards reads. And with OLTP workloads, the majority of SQL queries are simple enough to be processed well below the network latency between application and database.
Additionally the application needs to process the results of the database queries it sent. That often will involve substantial work (e.g. template processing, communication with cache servers, …).
To drive this home, here is a simple experiment using pgbench (a simple benchmarking program that is part of Postgres). In a memory-resident, read-only pgbench workload (executed on my workstation 1, 20/40 CPU cores/threads) I am comparing the achievable throughput across increasing client counts between a non-delayed pgbench and a pgbench with simulated delays. For the simulated delays, I used a 1ms network delay and a 1ms processing delay. The non-delayed pgbench peaks around 48 clients, the delayed run around 3000 connections. Even comparing on-machine TCP connections to a 10GBe between two physically close machines moves the peak from around 48 connections closer to 500 connections.
Scaling out to allow for higher connection counts can increase cost: Even in cases where the application’s workload can be distributed over a number of Postgres instances, the impact of latency combined with low maximum connection limits will often result in low utilization of the database servers, while exerting pressure to increase the number of database servers to handle the required number of connections. That can increase the operational costs substantially.
Surveying connection scalability issues
My goal in starting this project was to improve Postgres’ ability to handle substantially larger numbers of connections. To do that—to pick the right problem to solve— I first needed to understand which problems were most important, otherwise it would have been easy to end up with micro-optimizations without improving real-world workloads.
So my first software engineering task was to survey the different aspects of connection scalability limitations in Postgres, specifically:
By the end of this deep dive into the connection scalability limitations in Postgres, I hope you will understand why I concluded that snapshot scalability should be addressed first.
Memory usage
There are 3 main aspects to problems around memory usage of a large numbers of connections:
Postgres, as many of you will know, uses a process-based connection model. When a new connection is established, Postgres’ supervisor process creates a dedicated process to handle that connection going forward. The use of a “full blown process” over the use of of threads has some advantages like increased isolation / robustness, but also some disadvantages.
One common complaint is that each connection uses too much memory. That is, at least partially, a common observation because it is surprisingly hard to measure the increase in memory usage by an additional connection.
In a recent post about measuring the memory overhead of a Postgres connection I show that it is surprisingly hard to accurately measure the memory overhead. And that in many workloads, and with the right configuration—most importantly, using huge_pages —the memory overhead of each connection is below 2 MiB.
Conclusion: connection memory overhead is acceptable
When each connection only has an overhead of a few MiB, it is quite possible to have thousands of established connections. It would obviously be good to use less memory, but memory is not the primary issue around connection scalability.
Cache bloat
Another important aspect of memory-related connection scalability issues can be that, over time, the memory usage of a connection increases, due to long-lived resources. This particularly is an issue in workloads that utilize long-lived connections combined with schema-based multi-tenancy.
Unless applications implement some form of connection <-> tenant association, each connection over time will access all relations for all tenants. That leads to Postgres’ internal catalog metadata caches growing beyond a reasonable size, as currently (as of version 13) Postgres does not prune its metadata caches of unchanging rarely-accessed contents.
Problem illustration
To demonstrate the issue of cache bloat, I created a simple test bed with 100k tables, with a few columns and single primary serial column index 2. Takes a while to create.
With the recently addedpg_backend_memory_contexts view it is not too difficult to see the aggregated memory usage of the various caches (although it would be nice to see more of the different types of caches broken out into their own memory contexts). See 3.
In a new Postgres connection, not much memory is used:
name
parent
size_bytes
size_human
num_contexts
CacheMemoryContext
TopMemoryContext
524288
512 kB
1
index info
CacheMemoryContext
149504
146 kB
80
relation rules
CacheMemoryContext
8192
8192 bytes
1
But after forcing all Postgres tables we just created to be accessed 4, this looks very different:
name
parent
size_bytes
size_human
num_contexts
CacheMemoryContext
TopMemoryContext
621805848
593 MB
1
index info
CacheMemoryContext
102560768
98 MB
100084
relation rules
CacheMemoryContext
8192
8192 bytes
1
As the metadata cache for indexes is created in its own memory context, num_contexts for the “index info” contexts nicely shows that we accessed the 100k tables (and some system internal ones).
Conclusion: cache bloat is not the major issue at this moment
A common solution for the cache bloat issue is to drop “old” connections from the application connection pooler after a certain age. Many connection pooler libraries / web frameworks support that.
As there is a feasible workaround, and as cache bloat is only an issue for databases with a lot of objects, cache bloat is not the major issue at the moment (but worthy of improvement, obviously).
Query memory usage
The third aspect is that it is hard to limit memory used by queries. The work_mem setting does not control the memory used by a query as a whole, but only of individual parts of a query (e.g. sort, hash aggregation, hash join). That means that a query can end up requiring work_mem several times over 5.
That means that one has to be careful setting work_mem in workloads requiring a lot of connections. With larger work_mem settings, practically required for analytics workloads, one can’t reasonably use a huge number of concurrent connections and expect to never hit memory exhaustion related issues (i.e. errors or the OOM killer).
Luckily most workloads requiring a lot of connection don’t need a high work_mem setting, and it can be set on the user, database, connection, and transaction level.
Snapshot scalability
There are a lot of recommendations out there strongly recommending to not set max_connections for Postgres to a high value, as high values can cause problems. In fact, I’ve argued that myself many times.
But that is only half the truth.
Setting max_connections to a very high value alone only leads at best (worst?) to a very small slowdown in itself, and wastes some memory. E.g. on my workstation 1 there is no measurable performance difference for a read-only pgbench between max_connections=100 and a value as extreme max_connections=100000 (for the same pgbench client count, 48 in this case). However the memory required for Postgres does increase measurable with such an extreme setting. With shared_buffers=16GBmax_connections=100 uses 16804 MiB, max_connections=100000 uses 21463 MiB of shared memory. That is a large enough difference to potentially cause a slowdown indirectly (although most of that memory will never be used, therefore not allocated by the OS in common configurations).
The real issue is that currently Postgres does not scale well to having a large number of established connections, even if nearly all connections are idle.
To showcase this, I used two separate pgbench6 runs. One of them just establishes connections that are entirely idle (using a test file that just contains sleep 1s, causing a client-side sleep). Another to run a normal pgbench read-only workload.
This is far from reproducing the worst possible version of the issue, as normally the set of idle connections varies over time, which makes this issue considerably worse. This version is much easier to reproduce however.
This is a very useful scenario to test, because it allows us to isolate the cost of additional connections pretty well isolated. Especially when the count of active connections is low, the system CPU usage is quite low. If there is a slowdown when the number of idle connections increases, it is clearly related to the number of idle connections.
If we instead measured the throughput with a high number of active connections, it’d be harder to pinpoint whether e.g. the increase in context switches or lack of CPU cycles is to blame for slowdowns.
Throughput of one active connection in presence of a variable number of idle connections
Throughput of 48 active connections in presence of a variable number of idle connections
These results7 clearly show that the achievable throughput of active connections decreases significantly when the number of idle connections increases.
In reality “idle” connections are not entirely idle, but send queries at a lower rate. To simulate that I’ve used the the below to simulate clients only occasionally sending queries:
sleep 100ms SELECT1;
Throughput of one active connection in presence of a variable number of mostly idle connections
Throughput of 48 active connections in presence of a variable number of mostly idle connections
The results8 show that the slightly more realistic scenario causes active connections to slow down even worse.
Cause
Together these results very clearly show that there is a significant issue handling large connection counts, even when CPU/memory are plentiful. The fact that a single active connection slows down by more than 2x due to concurrent idle connections points to a very clear issue.
A CPU profile quickly pinpoints the part of Postgres responsible:
Profile of one active connection running read-only pgbench concurrently with 5000 idle connections, bottleneck is clearly in GetSnapshotData()
Obviously the bottleneck is entirely in the GetSnapshotData() function. That function performs the bulk of the work necessary to provide readers with transaction isolation. GetSnapshotData() builds so called “snapshots” that describe which effects of concurrent transactions are visible to a transaction, and which are not. These snapshots are built very frequently (at least once per transaction, very commonly more often).
Even without knowing its implementation, it does make some intuitive sense (at least I think so, but I also know what it does) that such a task gets more expensive the more connections / transactions need to be handled.
Two blog posts by Brandur explain the mechanics and issues surrounding this in more detail:
Conclusion: Snapshot scalability is a significant limit
A large number of connections clearly reduce the efficiency of other connections, even when idle (which as explained above, is very common). Except for reducing the number of concurrent connections and issuing fewer queries, there is no real workaround for the snapshot scalability issue.
Connection model & context switches
As mentioned above, Postgres uses a one-process-per-connection model. That works well in a lot of cases, but is a limiting factor for dealing with 10s to 100s of thousands of connections.
Whenever a query is received by a backend process, the kernel needs to perform a context switch to that process. That is not cheap. But more importantly, once the result for the query has been computed, the backend will commonly be idle for a while—the query result has to traverse the network, be received and processed by the application, before the application sends a new query. That means on a busy server another process/backend/connection will need to be scheduled—another context switch (cross-process context switches are more expensive than doing process-kernel-same process, e.g. as part of a syscall).
Note that switching to a one-thread-per-connection model does not address this issue to a meaningful degree: while some of the context switches may get cheaper, context switches still are the major limit. There are reasons to consider switching to threads, but connection scalability itself is not a major one (without additional architectural changes, some of which may be easier using threads).
To handle huge numbers of connections a different type of connection model is needed. Instead of using a process/thread-per-connection model, a fixed/limited number of processes/threads need to handle all connections. By waiting for incoming queries on many connections at once and then processing many queries without being interrupted by the OS CPU scheduler, efficiency can very significantly be improved.
This is not a brilliant insight by me. Architectures like this are in wide use, and have widely been discussed. See e.g. the C10k problem, coined in 1999.
Besides avoiding context switches, there are many other performance benefits that can be gained. E.g. on higher core count machines, a lot of performance can be gained by increasing locality of shared memory, e.g. by binding specific processes/threads and regions of memory to specific CPU cores.
However, changing Postgres to support a different kind of connection model like this is a huge undertaking. That does not just require carefully separating many dependencies between processes and connections, but also user-land scheduling between different queries, support for asynchronous IO, likely a different query execution model (to avoid needing a separate stack for each query), and much more.
Conclusion: Start by improving snapshot scalability in Postgres
In my opinion, the memory usage issues are not as severe as the other issues discussed. Partially because the memory overhead of connections is less big than it initially appears, and partially because issues like Postgres’ caches using too much memory can be worked around reasonably.
We could, and should, make improvements around memory usage in Postgres, and there are several low enough hanging fruits. But I don’t think, as things currently are, that improving memory usage would, on its own, change the picture around connection scalability, at least not on a fundamental level.
In contrast, there is no good way to work around the snapshot scalability issues. Reducing the number of established connections significantly is often not feasible, as explained above. There aren’t really any other workarounds.
Additionally, as the snapshot scalability issue is very localized, it is quite feasible to tackle it. There are no fundamental paradigm shifts necessary.
Lastly, there is the aspect of wanting to handle many tens of thousands of connections, likely by entirely switching the connection model. As outlined, that is a huge project / fundamental paradigm shift. That doesn’t mean it should not be tackled, obviously.
Addressing the snapshot scalability issue first thus seems worthwhile, promising significant benefits on its own.
But there’s also a more fundamental reason for tackling snapshot scalability first: While e.g. addressing some memory usage issues at the same time,qs switching the connection model would not at all address the snapshot issue. We would obviously still need to provide isolation between the connections, even if a connection wouldn’t have a dedicated process anymore.
Hopefully now you understand why I chose to focus on Postgres snapshot scalability first. More about that in my next blog post.
DO$$ DECLARE
cnt int :=0;
v record; BEGIN FOR v INSELECT*FROM pg_class WHERE relkind =‘r’and relname LIKE‘foo%’ LOOP EXECUTE format(‘SELECT count(*) FROM %s’, v.oid::regclass::text);
cnt = cnt +1; IF cnt %100=0THEN COMMIT; ENDIF; END LOOP;
RAISE NOTICE ‘tables %1’, cnt; END;$$;
Even worse, there can also be several queries in progress at the same time, e.g. due to the use of cursors. It is however not common to concurrently use many cursors. ↩︎
This is with pgbench modified to wait until all connections are established. Without that pgbench modification, sometimes a subset of clients may not be able to connect, particularly before the fixes described in this article. See this mailing listpost for details. ↩︎
This article is contributed. See the original author and article here.
Using replication in a MySQL setup, allows to copy data from a master server to one or more MySQL replica servers. There are a couple of reasons of using MySQL replication:
It spreads read load across replica servers for improving performance;
Enhance business security, continuity and performance using cross-region read replica: the replica can be in a different region from the master server;
BI and analytical workloads can be used on a replica server without affecting the performance of the master server.
Regardless of scenario and the number of Azure Database for MySQL read replicas configured, since the replication is asynchronous there is a latency between master and replica server.
Replication latency due to IO or SQL errors
When the replication is started on the replica servers 2 threads are running:
IO thread that connects to the master server, reads the binary logs and copies them to a local file that is called relay log;
SQL thread that reads the events from relay log and applies them to the database.
First step to troubleshoot the replication latency is to check if the latency is either due to IO or SQL thread. As such on the replica server must be executed the following statement:
SHOW SLAVE STATUS
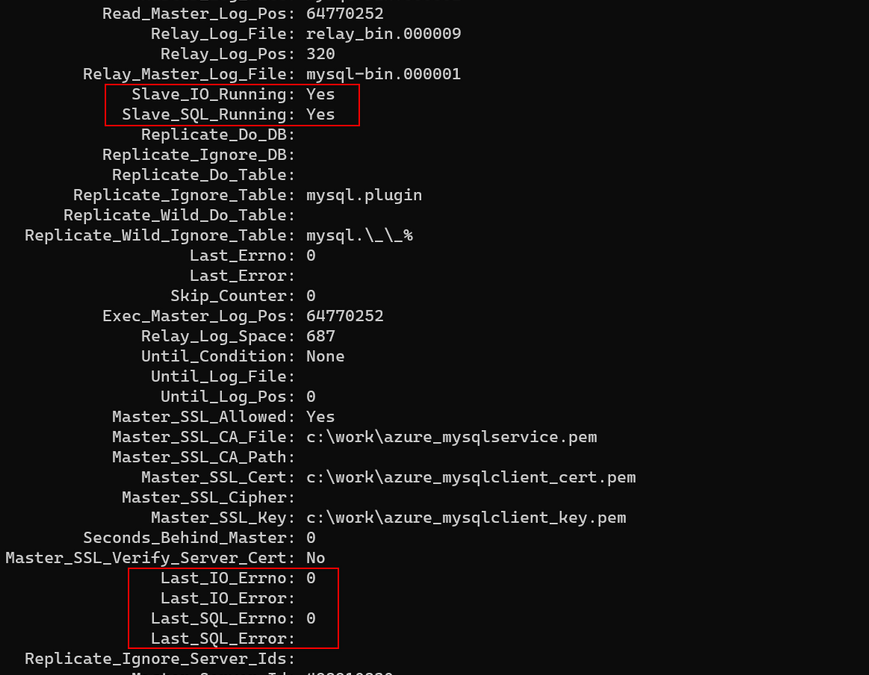
A typical output will look like:
Figure 1. SHOW SLAVE STATUS output
From above if Slave_IO_Running: Yes and Slave_SQL_Running: Yes then the replication is running, it is not broken. Shall be checked Last_IO_Errno/Last_IO_Error or Last_SQL_Errno/Last_SQL_Error that will hold the error number and error message of the most recent error that caused the SQL thread to stop. An error number of 0 and empty message means there is no error. Any error number not equal with 0, must be troubleshooted, can be checked as well the MySQL server error message reference for the given error number.
Replication Latency due to increase connections
A sudden spike in the number of connections increases the CPU usage for the simple fact that connections must be processed. In a situation when there is already a workload on the Azure Database for MySQL replica server and a sudden spike of connections is occurring the CPU will have to process the new connections and as a result the replication latency can increase. In such case the first step is to leverage the connectivity by using a connection pooler like ProxySQL.
Figure 2. Replication latency is increasing on new connections spike
As in most of the cases ProxySQL is implemented in a AKS cluster with multiple nodes or VM scale sets to avoid a single point of failure, sometimes connections spike can still occur. Out of the box MySQL will assign a thread for each connection, hence, thread pools that is supported from MySQL version 5.7 can be used. As such, we suggest enabling thread pooling on each MySQL replica server and properly configure thread_pool_min_threads and thread_pool_max_threads parameters based on the workload.
By default, thread_pool_max_threads = 65535 and this value simply will not gain any improvement as it will allow to create up till 65535 threads, which has no difference from the normal MySQL behavior. Instead, this parameter should be lowered to a value suitable for the workload. As an example, if this parameter is lowered to 200, even though there can be a couple of thousands of new connections, thread pool will allow to be processed a maximum of 200 connection threads.
After proper implementation of thread pools in Azure Database for MySQL replica servers, in case of a spike of connections the thread pool will limit the threads processed and the CPU will not increase, therefore replication will not be affected by the high number of new connections. We have seen big improvements in replication latency after implementing thread pool.
Figure 3. CPU and Replication latency not increasing on new connections spike (thread pool enabled)
Other keynote in here is that for enabling thread pools in Azure Database for MySQL parameter thread_handling must be changed from “one-thread-per-connection” to “pool-of-threads” and as this parameter is a static one, a server restart will be required for the change to apply. Although thread_pool_max_threads is a dynamic parameter, in a special case when reducing the value, for example from 1000 to 200, the MySQL server will not enlarge the thread pool furthermore, but also already existing threads will not be terminated, thus if the thread pool already contains 1000 threads, a server restart will be needed to reflect the new settings.
Replication latency due to no Primary or Unique key on a table
Azure Database for MySQL uses Row-Based replication, meaning that the master server writes events to the binary log about individual table row change, while the SQL Thread from the replica server will execute those changes to the corresponding table rows. Having no primary or unique key on a table it is also a common cause of replication latency, as some DML queries will need to scan all table rows to apply the changes from SQL thread.
In MySQL the primary key is an associated index that ensures fast query performance as it cannot include NULL values. Also, for InnoDB storage engine, the table data is physically organized to do ultra-fast lookups and sorts based on the primary key column or columns. Therefore, to ensure that the replica is able to keep up with changes from the source, we recommend adding a primary key on tables in the source server before creating the replica server or re-creating the replica server if you already have one.
Replication latency due to long running queries
It is possible that the workload on replica server to be the cause of the latency as the SQL thread cannot keep up with the IO thread. If it is the case, the slow query log should be enabled to help troubleshooting the issue. Slow queries can increase resource consumptions or slow down the server, thus replica will not be able to catch up with the master.
On the other hand, slow queries on master server can equally contribute to the latency as well. For instance, when a long running transaction on the master will complete, the data will be propagated to the replica server, but as it already took long to execute there will be already a delay. In such a case the latency is expected, thus long running queries should be identified and where possible to reduce the timings either by optimizing the query itself or breaking into smaller queries.
Replication latency due to DDL queries
Some DDL queries, especially ALTER TABLE can require a lock on a table, therefore should be used with caution in a replication environment. Depending on the ALTER TABLE statement executed, it might allow concurrent DML operations, for more details check MySQL Online DDL Operations. Also, some operations like CREATE INDEX will only finish when all transactions that accesses the table completed. In a replication scenario first the DDL command will be executed on the master server and only when completed will be propagated to the replica server(s).
In a heavy workload on both master and read replica servers an ALTER TABLE statement on the master server could take time to complete and the size of the table might be a contribution factor as well. When the operation completes, it will be propagated to the read replica server and depending on the ALTER statement it might require a lock on the table. In case a lock is required, the binary log will not be written, obviously the replication lag will start to increase from the moment the ALTER TABLE statement was propagated to the replica till the lock will be released. In such a case, the completion time will also depend on the workload on the replica or if there are long running transactions on the table that will increase the time furthermore.
Though Index dropping, renaming and creation should use INPLACE algorithm for the ALTER TABLE it will avoid copying table data, but may rebuild the table. Typically for INPLACE algorithm concurrent DML are supported, but an exclusive metadata lock on the table may be taken briefly during preparation and execution phases of the operation. As such, for CREATE INDEX statement the clauses ALGORITHM and LOCK may be used to influence the table copying method and level of concurrency for reading and writing, nevertheless adding a FULLTEXT or SPATIAL index will still prevent DML operations. See below an example of creating an index with ALGORITHM and LOCK clauses:
ALTER TABLE table_name ADD INDEX index_name (column), ALGORITHM=INPLACE, LOCK=NONE;
Unfortunately, for DDL statement that requires a lock, replication latency cannot be avoided, instead these types of DDL operations should be performed when less load is given, for instance during nighttime to reduce potential customer impact.
Replication latency due to replica server lower SKU
In Azure Database for MySQL read replicas are created with the same server configuration as the master. The replica server configuration can be changed after it has been created. However, if the replica server will be downgraded, the workload can cause higher resource consumption that in turn can lead to replication latency. Therefore, it is recommended that the replica server’s configuration should be kept at equal or greater values than the source to ensure the replica is able to keep up with the master.
This article is contributed. See the original author and article here.
Howdy folks,
Today we’re announcing GA of Conditional Access for the Office 365 Suite! This makes it a whole lot easier to configure Conditional Access policy for Office 365. With a single click, you confidently set policy on all of the Office 365 apps, including Exchange Online, SharePoint Online, and Microsoft Teams, as well as micro-services used by these well-known apps.
We released Conditional Access for the Office 365 Suite to public preview in February, right before many employees switched to remote work in response to COVID-19, causing organizations to quickly update their access policies. The simplified experience helped thousands of organizations make this shift, so we also added it to our secure remote access guidance. Since February, we’ve seen the usage of this policy grow to over 7 million active users.
With the GA release, if you haven’t already updated your policies to use the Office 365 Suite, you should do so now. Review any policies you have targeting individual Office apps to see if they can switch to Office 365 policy targeting.
Using the Office 365 Suite ensures your users will have consistent policy requirements across Office 365. Office 365 apps use shared services for an integrated experience, like access to files, calendar, and contact information. Inconsistent policy across these services result in end-users being interrupted or blocked at unexpected times with additional security prompts.
Targeting the Office 365 Suite also means you don’t need to watch for new apps and manually update your policy as they become available—Conditional Access does that for you.
Share your feedback!
The Office 365 Suite in Conditional Access is the best way to apply policy to Office 365 apps. Here is some additional documentation so you can learn more about the Conditional Access for the Office 365 suite.
Thank you to all our users who tried the preview and provided feedback. GA of this feature is just a start: we’re continuing to build richer options for Conditional Access and Office 365 so please keep the feedback coming.
This article is contributed. See the original author and article here.
In my last blog I talked about the policy-driven governance with Enterprise-Scale. In this fourth article of my little series about Enterprise-Scale, I will write about one of the options to operationalize Enterprise-Scale: AzOps.
Problem statement
Using Infrastructure-as-Code (IaC) to deploy and manage complex platform infrastructure deployments can quickly become quite tricky. For example, existing IaC code(s) to deploy an Azure platform infrastructure (management groups, policies, RBAC roles, etc.) must be updated when a new Azure resource is added to the platform infrastructure, and available CI/CD pipelines maybe have to be updated too, in order to address new deployment parameters. If the platform has to be changed, for example an additional management group hierarchy is introduced, may also lead to significant coding effort (adding smart logic), with all associated additional work. Furthermore, even more complexity is added when multiple platform engineers are supposed to work on the same IaC for the platform. In the end, it may be that one engineer is responsible for the entire deployment, to avoid breaking all implementation details. And finally, using IaC usually relies on the principle that the source code is the immutable source of truth. As a consequence of this, the expectation is that no changes should be made via other channels, such as the Azure portal or Azure CLI.
A possible solution – AzOps
AzOps is a reference implementation and represents a possible solution to the mentioned challenges with many IaC implementations. It’s important to call out that AzOps is an optional component to operationalize Enterprise-Scale, and there are other options as well. AzOps is orthogonal and can be used in any Azure environment, to transition to IaC once an organization is ready for it. Therefore, AzOps exists in a dedicated GitHub repository.[1]
What is AzOps?
AzOps is an atomic, primitive CI/CD pipeline for the Azure platform scopes (tenant, management groups, and subscriptions). AzOps allows organizations to bring their own Azure Resource Manager (ARM) templates, and deploy them at the designated scope. It helps to keep the Azure platform up-to-date with the ARM-based configuration stored in a Git repository, but it can also be used to update the Git repository with changes made via alternate methods and channels, e.g. via the Azure portal. AzOps is packaged as Docker-compatible container image and invoked as part of an GitHub Action or Azure DevOps Pipelines (or another CI/CD tool). AzOps is used to deploy ARM templates at the scopes where the service principal (used Azure Active Directory identity) has been grated access.
Now a concrete example related to policies:
An engineer works on a new policy (policyDefinitions), and stores it in the Git repository (the new policy is nothing more than an ARM template).
The new policy (ARM template) will used by AzOps to deploy it (Microsoft.Authorization/policyDefinitions resource) at the designated scope.
The engineer can concentrate solely on the policy development (one ARM template), no other changes are required with regards to IaC or CI/CD pipeline.
Azure platform infrastructure in a Git repository
As mentioned above, AzOps enables to store the ARM-based configuration (Azure platform infrastructure) in a Git repository. This includes the Azure resources managementGroups, subscriptions, policyDefinitions, policySetDefinitions, policyAssignments, roleDefinitions, and roleAssignments.[2]
The ARM-based configuration stored in a Git repository may look as follows:
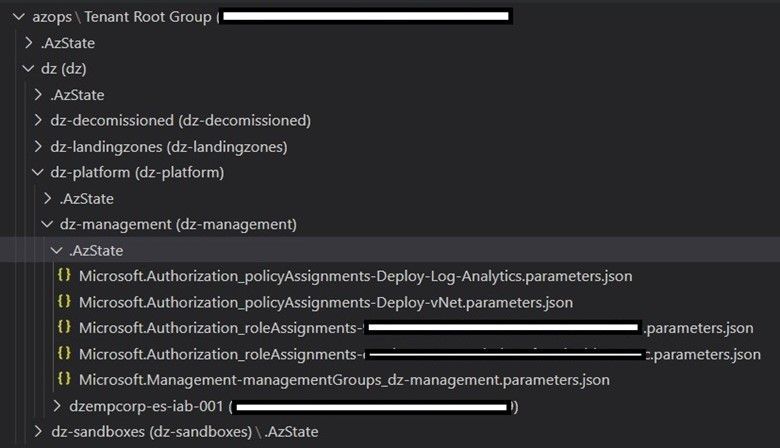
Figure 1: Azure configuration hierarchy stored in a Git repository.
What you can see in figure 1 is the following:
Name
Type
Description
azops
“/”
Tenant
Tenant Root Group
Management group
Tenant root management group
dz-management
Management group
Management group for all management-related subscriptions
dzempcorp-es-iab-001
Subscription
Subscription used for management-related Azure services
policyAssignments created on the dz-management management group, which deploys a Log Analytics workspace in all subscriptions associated to the management group
I personally really like the approach with AzOps, as it is based on native tools such as Azure PowerShell and ARM templates, and it has been continuously developed and adapted to cover new requirements. Furthermore, the implementation option with AzOps is also described in Enterprise-Scale, in the chapter “[Optional] Getting started with Infrastructure-as-code”.[3]
Finally, another big thank you to @KristianNese for reviewing and providing feedback.
This article is contributed. See the original author and article here.
This installment is part of a broader series to keep you up to date with the latest features in Azure Sentinel. The installments will be bite-sized to enable you to easily digest the new content.
The process of investigation is partly a science and partly an art. The analyst is ultimately building a storyline of what happened to determine whether the chain of events is the result of a malicious actor (often attempting to mask their actions/nature), a normal business/technical process, an innocent mistake, or something else.
As the analyst builds this understanding, they must capture a complete record with their conclusions and reasoning/evidence for future use (case reviews, analyst self-education, re-opening cases that are later linked to active attacks, etc.). Documentation is imperative to the lifecycle of an investigation and having the ability to support various ways to document and add context is necessary for SOC analysts.
With that in mind, we are delighted to announce that we have added the support for rendering HTML and Markdown in the Sentinel incident’s comment section! This gives you the ability to provide immediate value for documenting with additional context and the capability to view the context in a more meaningful way. Learn more about markdown using this reference and the cheatsheet.
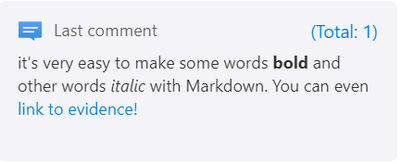
For eaxmple, it’s very easy to make some words **bold** and other words *italic* with Markdown. You can even [link to evidence!](http://google.com?q=evidence). The result would look like this:
Additionally, we increased the allowed size of comments from 1000 chars to 3000 chars. This will ensure that you have enough room to include contextual information to the comment field in Azure Sentinel.
Note: At the moment, we do not have an HTML/Markdown visual editor in the comments section. However, you can input HTML/Markdown directly through the UI using the Markdown syntax, or send it using a Logic App or the API and the comment section will render it. We plan to add an HTML/Markdown editor to the comments section. Additionally, we also plan to support editing and deleting of comments.
How to:
Use case: Formatted enrichments using playbooks
Incident enrichment is a major use case is the process of incident triage, investigation, and response. This feature can also be used in tandem with playbooks (LogicApps) to enrich incidents with external information.
The example below shows a comment added by an IP enrichment playbook that captures information from VirusTotal and adds it as a formatted text to the incident comment section:
Get started today!
We encourage you to utilize this new set of features to enhance the way that you are documenting the investigation process and adding contextual information to incidents.
This article is contributed. See the original author and article here.
Microsoft is in the business of making digital transformation easy, fast, and cost effective for our customers. As we look at the opportunity presented by the rise of AI, it is essential to recognize silicon as a foundational component to the success of all intelligent edge devices, and the services and software that light them up. At the center of our silicon strategy is a commitment to support and partner with a broad and diverse ecosystem of silicon partners, device OEMs, and end customers.
TAM estimates for AI inferencing silicon at the edge are as high as $51.6 billion by 2025 with 70+ specialty AI companies working on a wide variety of chip-related technologies. Silicon diversity in a device ecosystem leads to innovation, heathy competition, and a choice of solutions across the value chain for developers, device makers, and end customers. However, Microsoft AI developer surveys indicate that the #1 reason developers do not try new silicon options is the cost of learning a new toolchain. Developers tell us that it can take more than a year for new silicon to be properly supported with the right optimizations in toolchains. In addition, we hear that many of the available toolchains lack a robust end-to-end experience, requiring developers to stitch together solutions, experimenting along the way. To accelerate growth for this fast-emerging market, vertically-integrated E2E solutions that lower time-to-value for our partners and customers are necessary.
I am delighted to announce that Microsoft and Arm are collaborating to deploy an integrated Azure-based toolchain targeting Arm-based silicon and delivering a unified and streamlined AI experience for developers. Microsoft and Arm have been close partners for many years. This deepened partnership will enable developers to easily target a broad range of Arm-based silicon in AI-enabled devices like intelligent computer-vision-enabled cameras, connected vehicles, AI gateways, and intelligent appliances.
Arm’s leading silicon architecture combined with their broad ecosystem and commitment to optimizing developer experiences will enable this partnership to accelerate AI innovation for IoT devices, delivering better solutions and a better future for end-users. The new wave of AI devices are much closer to where the data is generated, typically near the people working in factories, warehouses, stores, office buildings, and hospitals. These devices need to accommodate that proximity to people—no loud cooling fans, and inconspicuous form factors that are easier to use. Arm-based silicon can enable SoCs (system on chips) that consume little power, generate minimal heat, and can even eliminate the need for loud cooling fans. This is ideal for edge AI devices.
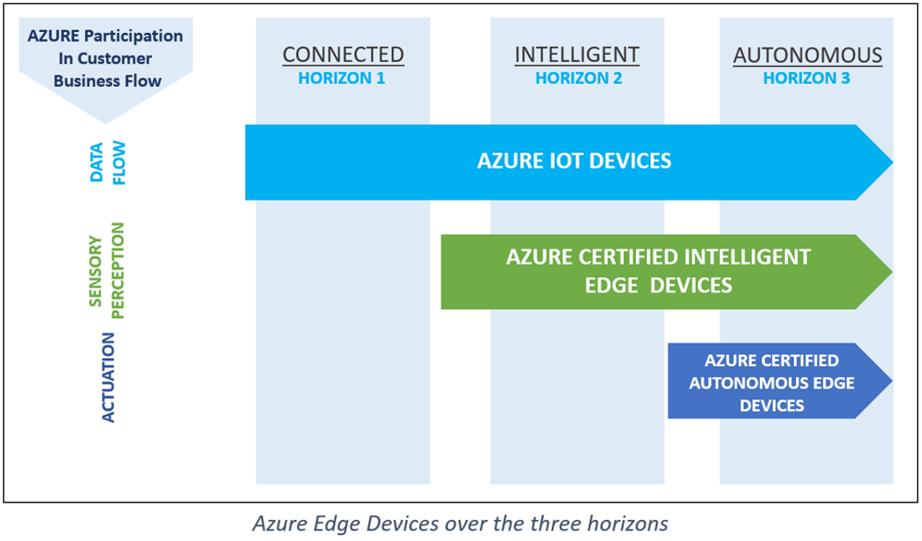
Edge AI workloads and devices need specialized silicon. We see that the adoption of AI will span multiple time-horizons realized in three progressive stages: Connected, Intelligent, and Autonomous. With more devices connected to the cloud, the demand for dashboards to manage and monitor these devices remotely has become a normal course of business. As we progress further into the intelligent horizon, being ready for devices that provide a flood of insights can provide enterprises with significant economic and competitive advantages. These Intelligent devices will disrupt value chains as they become the sensors, monitors and communicators. The autonomous horizon is almost upon us and will be the most disruptive with data-driven workflows executed between machines with little to no human interaction required. Companies slow to adopt this technology may fall so far behind that it becomes economically impossible to catch up.
Microsoft will collaborate with our ecosystem partners to plan across these multiple horizons, focused on customer-driven scenarios that inform both Intelligent Edge device portfolios and the silicon requirements to light them up. Each horizon will include a set of fundamental device capabilities, but as use cases evolve across various industry segments, we will need a broader and more comprehensive view of silicon requirements and coverage to succeed.
In addition to our focus on silicon diversity for intelligent Azure-connected devices, we are also working to address two significant challenges we hear from others in the ecosystem: finding the right devices to meet a customer’s needs, and finding the right audience for their devices and solutions. With over 30 billion active IoT devices in the world with 400 percent growth over the past three years, the industry is moving incredibly fast. Connecting the right audience with the right product will only become more difficult. Our recent announcement of the Azure Certified Device program is intended to help with these challenges. You can find more details at Getting Started with the Azure Certified Device program.
At the heart of this device certification program is a promise to device builders that they can not only get their devices to market quickly, but also more easily differentiate and promote their devices. It’s also a promise to buyers that they can easily find devices that meet their needs, and purchase those devices with confidence that they meet Microsoft standards for certification and are ready to work with Azure.
To support these promises, Microsoft is working closely with the silicon ecosystem to launch an Azure- Ready Silicon program. This program is a forward-looking effort to inform future silicon requirements for the device certification program, ensuring device builders have diverse and differentiated silicon that easily runs on Azure and is readily available. This involves aligning on fundamental silicon capabilities including security, connectivity, and compute—juxtaposed against a spectrum of real customer scenarios, requirements and device categories.
We need to collectively execute against a long-term view to intercept the future requirements for the Intelligent Edge. We know that the best things happen at-scale when people have choice. We are committed to helping foster innovation and diversity within the broader silicon and device ecosystems, and making it easy, fast, and cost-effective for our customers. Our collaboration with Arm to facilitate an end-to-end AI toolchain to simplify development is an important part of this strategy, and we’re very excited to continue tackling these AI and Intelligent Edge challenges together with them.
This article is contributed. See the original author and article here.
Omar Khan – General Manager of Azure Customer Success Marketing
Microsoft Learn and Pluralsight are joining forces to help you unlock the power of Microsoft Azure and to help you think further outside the box than ever before. Join us at Pluralsight LIVE, an annual technology skills conference, which is going virtual this year. All you need is an internet connection and a drive to learn!
Register for Pluralsight LIVE and connect with us at the Microsoft Azure “virtual booth,” where you’ll find lots of resources, live chat, trivia games, and opportunities to engage with folks from Microsoft.
Plus, Microsoft is presenting an in-depth session at this year’s LIVE, Build your Azure skills with Microsoft Learn and Pluralsight. This session, on Tuesday, October 13, 2020, at 1 PM Mountain Time, explores how you can get the skills you need to meet the challenges of today’s cloud-based, digital world. You’ll learn what’s new in Azure and how building the right skills on Azure can help you to embrace digital transformation. We’ll explain how the Microsoft Learn offering works and how we partner with Pluralsight to support your skilling process. And we’ll help you get started identifying the right certifications for you or your team.
Decide what your skilling journey looks like
Before you explore how to use the resources of Microsoft Learn and Pluralsight together to learn and master Azure, first step back and examine your and your organization’s goals. Each person—and each company—has a unique journey. Your organization’s digital transformation journey may define your own learning journey. Depending on your business or personal goals, you might identify different skilling needs, for example:
• You or members of your team might need foundational understanding of an Azure technology. • You might have some roles on your team that need specific technical skills to help people succeed in their jobs. • You might be starting a new project that requires you to use and combine multiple Azure technologies to deliver the best solution.
After you’ve assessed your learning and skilling needs, you can create a learning plan for you or your team that combines learning experiences available to you through digital skilling, training events, and instructor-led training.
Microsoft Learn offers many training options so you can choose to learn in a style that fits you or your team best, as you identify roles, skills, and learning paths to support your complete learning journey—from building a foundation for skills validation to gaining recognition with Microsoft Certifications. Use free, self-paced learning or attend training events. Or you can attend in-depth instructor-led training, either virtually or in person, using Microsoft Official Courseware delivered by Microsoft Learning Partners. Combine these learning experiences to customize the best learning strategy for you.
Now let’s look at how you can use Microsoft Learn and Pluralsight together to make the most of your learning experience.
Combine Microsoft Learn and Pluralsight to intensify your tech skills on Azure
Microsoft Learn and Pluralsight offer complementary options to help you gain Azure expertise. Use them together for an integrated learning experience.
Start by determining where you are: • To know where your Azure skills stand, use Pluralsight Skill IQ. • Measure your proficiency in your role, with Pluralsight Role IQ.
After you identify any gaps in your knowledge, focus your time on discovering what you need to learn instead of searching for content or reviewing what you already know.
Combine features from both platforms to enhance your learning. Whether you learn better reading, watching videos, practicing in sandbox environments, or with instructor-led training, use Microsoft Learn and Pluralsight together, wherever you are.
Want to prove your skills by earning an Azure certification? Microsoft Learn and Pluralsight are there to support your journey. • Prepare using learning paths on Microsoft Learn and Pluralsight. • Use instructor-led training on Microsoft Learn and Pluralsight to build foundational skills and reinforce your skills.
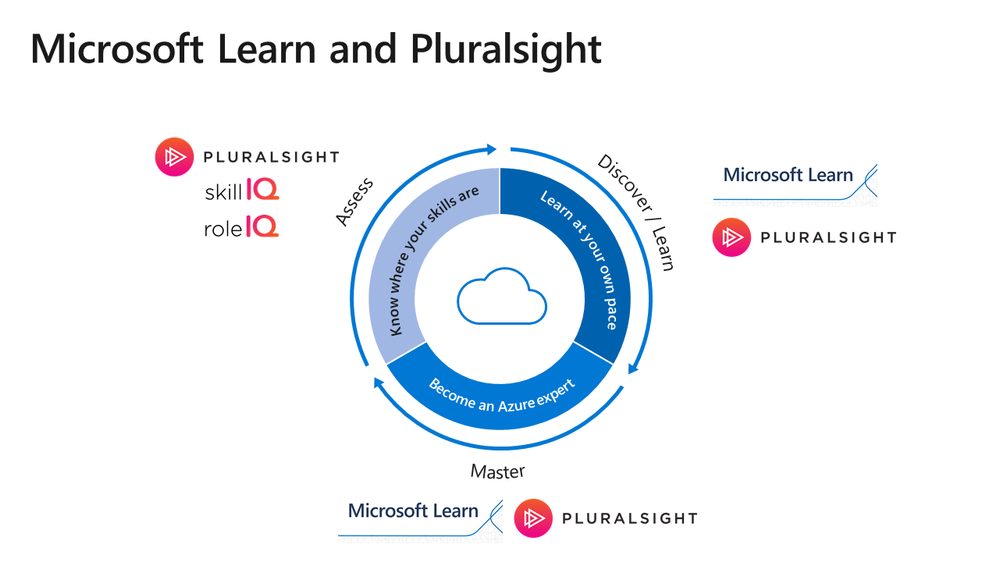
Already certified? Challenge yourself to earn another certification. Learning is an ongoing journey. Create your own learning strategy with instruction in both Microsoft Learn and Pluralsight. The following infographic shows you how you can assess, discover, and master the skills you need by combining these helpful resources.
Time to start learning!
Microsoft Learn and Pluralsight are the leading complementary learning platforms to help you skill up on—and master—Azure and to help you get recognized and take the next step in your career. Check out Microsoft Learn for instructor-led or self-paced interactive training and for hands-on learning, and go to Pluralsight for videos, skills assessments, and more. Create a custom Azure learning path, learn at your own pace, and prepare for Azure certifications—all on your way to becoming an Azure expert. Are you ready? One, two, three—let’s go!
This article is contributed. See the original author and article here.
A question that we get asked by IT departments is whether Configuration Manager can be used to set up your lab. The answer is yes! In this blog post, we will show how you can use Microsoft Endpoint Manager Configuration Manager, which is the new brand name for SCCM,to automatically deploy software to a lab’s template VM.
IMPORTANT: It’s important that when you move from a physical lab environment to Azure Labs, that you also restructure images instead of reusing images from your physical environment. Refer to the following blog post that has more details: Moving from a Physical Lab to Azure Lab Services
Recommended Approach
To use Configuration Manager with Azure Lab Services, here is the approach that we recommend:
1. Start with a Windowsmarketplace image when you create your lab.
Custom images that are created by exporting from a lab’s template VM are specialized images which means that SysPrep has not been run on the image. As a result, all VMs that are created from a custom image will have the sameWindows SID. Configuration Manager requires that each VM have a unique SID for its features to work properly. To ensure that your template VM has a unique SID, we recommend that you start with a Windows image from the marketplace when you create the lab.
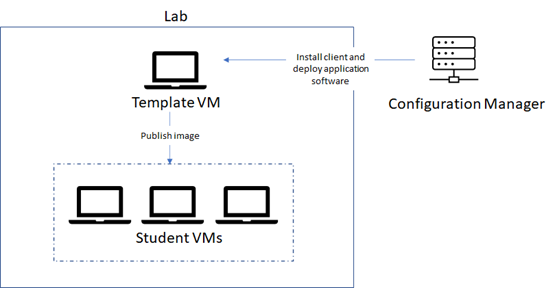
2. Use Configuration Manager to deploy software to the template VM.
You should use Configuration Manager to deploy software to the template VM – notto deploy software directly to the student VMs. There are a couple of reasons for this:
The template VM should serve as the ‘master’ image for all of the student VMs in the lab.
When the student VMs are published, they all have the same SID as the template VM.Configuration Manager’s features won’t work properly because the student VMs do not have unique SIDs.
Prerequisites
These steps assume the following prerequisites have been configured:
You already have a Configuration Manager site server installed.
You have a Lab Account that is peered with a Virtual Network (VNet) that has access to your Configuration Manager site server. By peering your Lab Account, this will enable its lab VMs to communicate with the site server. More information on Lab Account creation and VNet peering can be found in this article:
IMPORTANT: The lab account must be peered to the VNet before the lab is created. You may also need to ensure that required ports are enabled within your VNet andor on-premise network. For example, you need to allow HTTPHTTPS communication between your lab VMs and the Configure Manager site server. Refer to the following link for details: Ports used in Configuration Manager
Lab Setup
Let’s look at the steps to set up your lab to use Configuration Manager to deploy software to the template VM.
3. Deploy software applications using Configuration Manager
Once the template VM is approved in Configuration Manager, you can use Configuration Manager to deploy software applications onto the template VM. Read the following instructions for details:
Before you publish the template VM, you should uninstall Configuration Manager’s client. Otherwise, if you leave the Configuration Manager client installed when you publish, this will potentially cause negative side-effects because the student VMs will be assigned to a site yet will have non-unique SIDs.
A Few Considerations with Active Directory Domain Joining
In addition to using Configuration Manager to set up your template VM, you may also be planning to join your student VMs to your AD domain as shown in a previous blog post. There are a few things to note if you are planning to do both in your lab.
First, when you:
Domain join your student VMs.
And you use Configuration Manager’s AD discovery methods to automatically discover client computers in your domain.
You will likely see your student VMs listed in Configuration Manager’s console. However, you should notuse Configuration Manager to manage the student VMs due to the reasons already mentioned in this post.
Secondly, you may chooseother options for installing the Configuration Manager client on the template VM, such as a client push installation, where you also need to use AD discovery. Here are a few helpful tips for using AD discovery to find your lab’s template VM:
You will need to manually join the template VM to your domain.
After you’ve finished installing the Configuration Manager client and deploying applications to the template VM, then make sure that you remove the template VM from the domain. Otherwise, if the template VM remains joined to the domain, this will cause an issue later when you use the steps for joining student VMs to the domain.
Wrap Up
For IT departments that are already using Configuration Manager for managing devices, we hope that you find this guidance useful for also using Configuration Manager to prepare your lab’s template VM.


Recent Comments