by Contributed | Nov 11, 2020 | Technology
This article is contributed. See the original author and article here.
Imagine you build an API only to realize later down the road, your documentation for it isn’t kept up to date and you are now spending more time trying to figure how it works than it took to build. Sound familiar? This is one of the common pitfalls of a code-first approach to APIs. There are two key approaches to building APIs:
- Code-first: coding the API directly from the requirements and then generating an API definition document
- Design-first: defining an API first and then implementing backend services based on the agreed API design
If you were to follow a design-first approach, you can design your API in API Management and export it to an OpenAPI specification file, which could be used to bring organizational alignment and serve as a guidance for implementing backend services that support the API logic and client applications that consume the API.
To support the design-first approach, we recently released an update to our Azure Functions and API Management Visual Studio Code extensions that lets you generate Azure Function apps by importing an OpenAPI specification. The same functionality is available via the command line.
Functions provide not only ready-made scaffolding for writing an API but all the necessary hosting.
Functions allow your API to dynamically scale up or down depending on the number of requests. Since it is consumption-based, you’re only charged when an HTTP endpoint is called, and you aren’t paying for idle resources as you would if you were using a VM as a host.
Example Scenario
Imagine a scenario where you are creating an API for a food delivery service. After gathering the business requirements, you begin developing the API. Once the API is built, dependent teams start testing, documenting, and providing feedback. But while gathering feedback you realize you need to pivot and rewrite a significant portion of your API which is going to push back the project. That’s where the code-first approach falls short.
What if instead of developing the API, you started with an API description to establish a shared understanding of how the API is supposed to function. During the process of creating the description you start asking questions like: What functionality will the API have? What will the developer experience be like? What data will it expose and in what format? How will we add new functionality in the future? To answer some of these questions you need to bring in other teams to provide input. You can now get earlier validation on the API functionality from various stakeholders while the cost of making changes are low.
In addition to gathering feedback earlier in the API development process, teams that are consumers of the API can begin testing and integration before the business logic is complete. Dependent teams are not blocked by another team’s progress and can work in parallel during API development process.
Which approach should I use?
Determining what approach to use will depend on your business needs and use case. The code-first approach is a more traditional approach to building APIs, but the popularity of API definition formats has led to the growing support of the design-first methodology.
Design-first allows consumers to better understand of how to use your API and ensures consistency across APIs.
Key benefits of a design-first approach are:
- Accelerates API development by establishing key details in the design phase and allowing development teams to work in parallel
- Results in a transparent API documentation to stakeholders
- Let’s you focus on the API consumer experience and the business logic that the API fulfills, detaching it from the technical implementation
- Helps to create a strong foundation for the API, which may reduce the number of breaking changes in future
Building a REST API in three steps
In three easy steps you can design and build your API’s without writing a bunch of lines of code and documentation.
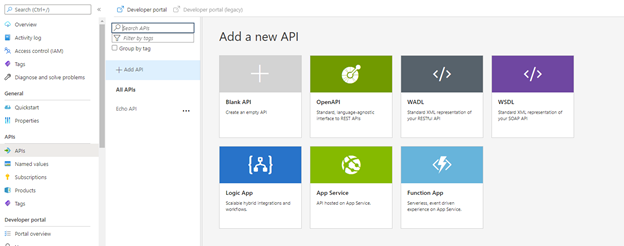
Step 1: Create an API definition using API Management
In API Management, choose API’s from the left menu, and then select OpenAPI.

In the Create from OpenAPI specification window, select Full. Fill in your API values in the necessary fields and select create. Here is a sample Open API file you can use.

Step 2: Generate function apps from Open API Specifications
Now that you have created an OpenAPI specification file you can import the specification via the API Management or Azure Functions VS Code extensions to create the scaffolding for your API.
Getting started with VS Code
Before you get started there’s a few things you will need:
- Visual Studio Code
- Latest version of the Azure Functions extension or API Management Extension
- You will need the correct language runtimes installed for the type of function app you want to create. The languages we currently support are C#, Python, TypeScript, and Java. Support for JavaScript and PowerShell coming in the near future.
- AutoRest (Microsoft’s OpenAPI specification generator)
From API Management Extension
In your VS code settings make sure you enable the API Management extension to create Functions.

In the API management VS code extension right click on the API definition you would like to use and select scaffold Azure Functions.

Select your language of choice and where you would like to create the functions.

Watch as it starts to generate function apps from your specification file!

From Azure Functions Extension
You can also use the Azure Functions extension to import a specification to create the scaffolding for your API.
Create a new function app and choose your language of choice (TypeScript, Python, C#).

Select the HTTP trigger(s) from OpenAPI V2/V3 Specification template.

Select your OpenAPI specification file (You can find some samples to try here).

Step 3: Add your business logic
Once it completes you will see it has automatically generated all the necessary functions for your API, preconfigured based on the OpenAPI specification. All you need to do now is add your business logic to each function/route and deploy to Azure.

Getting started with CLI
You can also use the CLI as well to create the scaffolding for your API’s.
autorest --azure-functions-csharp

         --input-file:/path/to/spec.json

         --output-folder:./generated-azfunctions

         --version:3.0.6314

         --namespace:Namespace
Check out the GitHub repo for more information on how to get started.
Summary
The design-first approach to building APIs comes with many benefits, saving you time and effort in bringing your APIs to market. Now you can reap the benefits even more by generating the Azure Functions scaffolding for your APIs from OpenAPI definition in Visual Studio Code. If you have an existing API hosted on Azure and you’re interested in exploring a serverless architecture or consumption-based billing model, this new capability is a fast track for getting started with Azure Functions.
To learn more about building serverless APIs with Azure Functions and Azure API Management, check out a new workshop we recently published on GitHub.
by Contributed | Nov 11, 2020 | Technology
This article is contributed. See the original author and article here.
We are delighted to announce the initial release of solutions to run Oracle WebLogic Server (WLS) on the Azure Kubernetes Service (AKS) developed with the WebLogic team as part of a broad-ranging partnership between Microsoft and Oracle. The partnership includes joint support for a range of Oracle software running on Azure, including Oracle WebLogic, Oracle Linux, and Oracle DB, as well as interoperability between Oracle Cloud Infrastructure (OCI) and Azure.
WLS is a key component in enabling enterprise Java workloads on Azure. This initial release certifies that WebLogic is fully enabled to run on AKS and includes a set of instructions, samples, and scripts intended to make it easy to get started with production ready deployments. Evaluate the solutions for full production usage and reach out to collaborate on migration cases.
Solution Details and Roadmap
WLS on Azure Linux Virtual Machines solutions were announced in September covering several important use cases, such as base image, single working instance, clustering, load-balancing via Azure App Gateway, database integration, and security via Azure Active Directory. This current release enables basic support for running WebLogic clusters on AKS reliably through the WebLogic Operator, offering a wider set of options for deploying WLS on Azure.
WebLogic Server clusters are fully enabled to run on Kubernetes via the WebLogic Kubernetes Operator. The Operator simplifies the management and operation of WebLogic domains and deployments on Kubernetes by automating manual tasks and adding additional operational reliability features. Alongside the WebLogic team, Microsoft has tested, validated and certified that the Operator runs well on AKS. Beyond certification and support, Oracle and Microsoft provide detailed instructions, scripts, and samples for running WebLogic Server on AKS. These solutions, incorporated into the Operator itself, are designed to make production deployments as easy and reliable as possible.
The WLS on AKS solutions allow a high degree of configuration and customization. The solutions will work with any WLS version that supports the Operator, such as 12.2.1.3 and 12.2.1.4, and use official WebLogic Server Docker images provided by Oracle. Failover is available via Azure Files accessed through Kubernetes persistent volume claims, and Azure Load Balancers are supported when provisioned using a Kubernetes Service type of ‘LoadBalancer’.

The solutions enable a wide range of production-ready deployment architectures with relative ease, and you have complete flexibility to customize your deployments. After deploying your applications, you can take advantage of a range of Azure resources for additional functionality.

The solutions currently assume deploying the domain outside the Docker image and using the standard Docker images from Oracle; we will enable custom images with your domain inside a Docker image in the next few months. Further ease-of-use and Azure service integrations will be possible next year via Marketplace offerings mirroring the WSL on Azure Virtual Machines solutions.
These offers are Bring-Your-Own-License. They assume you have already procured the appropriate licenses with Oracle and are properly licensed to run WLS on Azure. The solutions themselves are available free of charge as part of the Operator.
Get started with WLS on AKS
Explore the solutions, provide feedback, and stay informed of the roadmap. You can also take advantage of hands-on help from the engineering team behind these offers. The opportunity to collaborate on a migration scenario is completely free while the offers are under active initial development.
by Contributed | Nov 11, 2020 | Technology
This article is contributed. See the original author and article here.
Currently, the ISE does not provide any alert in case of any events that led to having unhealthy subnet(s)
the provided logic app will call HTTP management endpoint from azure
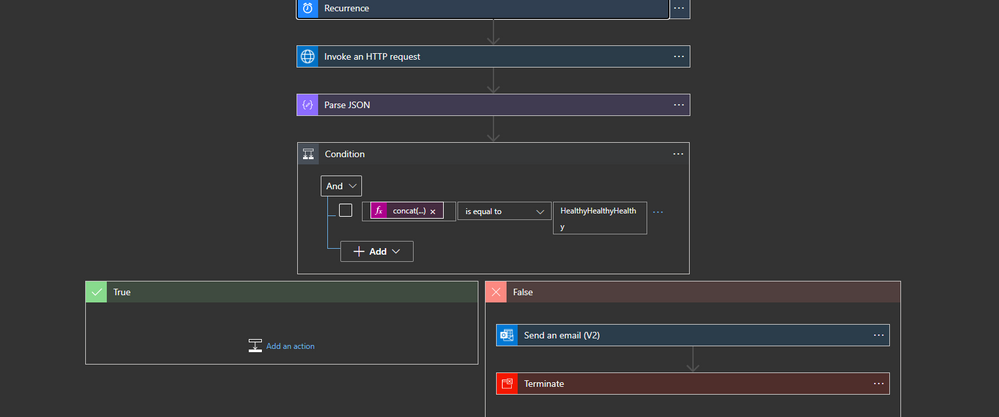
How to build the logic app

the logic app will run periodically and get the content of the endpoint
https://management.azure.com/subscriptions/../resourceGroups/../providers/Microsoft.Logic/integrationServiceEnvironments/../health/network?api-version=2018-07-01-preview
I am using the action HTTP with Azure AD

the action will get a JSON content that shows the net health status
{
"CSS-ISE-Sub4": {
"networkDependencyHealthState": "Healthy",
"outboundNetworkDependencies": [
{
"category": "AzureStorage",
"displayName": "Azure Storage",
"endpoints": [
{
"domainName": "bvzkkzolbtymq00by.blob.core.windows.net",
"ports": [
"80",
"443"
],
"accessibility": "Available"
},
{
"domainName": "bvzkkzolbtymq00by.queue.core.windows.net",
"ports": [
"80",
"443"
],
"accessibility": "Available"
},
{
"domainName": "bvzkkzolbtymq00by.table.core.windows.net",
"ports": [
"80",
"443"
],
"accessibility": "Available"
},
{
"domainName": "bvzkkzolbtymqregby.blob.core.windows.net",
"ports": [
"80",
"443"
],
"accessibility": "Available"
},
{
"domainName": "bvzkkzolbtymqregby.queue.core.windows.net",
"ports": [
"80",
"443"
],
"accessibility": "Available"
},
{
"domainName": "bvzkkzolbtymqregby.table.core.windows.net",
"ports": [
"80",
"443"
],
"accessibility": "Available"
},
{
"domainName": "bvzkkzolbtymqaftsby.blob.core.windows.net",
"ports": [
"80",
"443"
],
"accessibility": "Available"
},
{
"domainName": "bvzkkzolbtymqaftsby.queue.core.windows.net",
"ports": [
"80",
"443"
],
"accessibility": "Available"
},
{
"domainName": "bvzkkzolbtymqaftsby.table.core.windows.net",
"ports": [
"80",
"443"
],
"accessibility": "Available"
}
]
},
{
"category": "AzureActiveDirectory",
"displayName": "Azure Active Directory",
"endpoints": [
{
"domainName": "graph.windows.net",
"ports": [
"80",
"443"
],
"accessibility": "Available"
}
]
},
{
"category": "SSLCertificateVerification",
"displayName": "SSL Certificate Verification",
"endpoints": [
{
"domainName": "ocsp.msocsp.com",
"ports": [
"80",
"443"
],
"accessibility": "Available"
},
{
"domainName": "mscrl.microsoft.com",
"ports": [
"80",
"443"
],
"accessibility": "Available"
},
{
"domainName": "crl.microsoft.com",
"ports": [
"80",
"443"
],
"accessibility": "Available"
},
{
"domainName": "www.microsoft.com",
"ports": [
"80",
"443"
],
"accessibility": "Available"
},
{
"domainName": "crl3.digicert.com",
"ports": [
"80",
"443"
],
"accessibility": "Available"
},
{
"domainName": "ocsp.digicert.com",
"ports": [
"80",
"443"
],
"accessibility": "Available"
},
{
"domainName": "cacerts.digicert.com",
"ports": [
"80",
"443"
],
"accessibility": "Available"
},
{
"domainName": "www.thawte.com",
"ports": [
"80",
"443"
],
"accessibility": "Available"
}
]
},
{
"category": "DiagnosticLogsAndMetrics",
"displayName": "Diagnostic Logs And Metrics",
"endpoints": [
{
"domainName": "az-prod.metrics.nsatc.net",
"ports": [
"443"
],
"accessibility": "Available"
}
]
},
{
"category": "IntegrationServiceEnvironmentConnectors",
"displayName": "Integration Service Environment Connectors",
"endpoints": [
{
"domainName": "flow-bvzkkzolbtymq-by-apim-runtime.westus.environments.microsoftazurelogicapps.net",
"ports": [
"443"
],
"accessibility": "Available"
}
]
}
],
"outboundNetworkHealth": {
"state": "Healthy"
}
},
"CSS-ISE-Sub2": {
"networkDependencyHealthState": "Healthy",
"outboundNetworkDependencies": [
{
"category": "SQL",
"displayName": "SQL",
"endpoints": [
{
"domainName": "apirpsql2ez4bajpcjjlkmaa.database.windows.net",
"ports": [
"1443"
],
"accessibility": "Available"
}
]
},
{
"category": "RecoveryService",
"displayName": "Recovery Service",
"endpoints": [
{
"domainName": "https://global.metrics.nsatc.net/",
"ports": [
"1886"
],
"accessibility": "Available"
}
]
},
{
"category": "RecoveryService",
"displayName": "Recovery Service",
"endpoints": [
{
"domainName": "https://prod3.metrics.nsatc.net:1886/RecoveryService",
"ports": [
"1886"
],
"accessibility": "Available"
}
]
},
{
"category": "AzureStorage",
"displayName": "Azure Storage",
"endpoints": [
{
"domainName": "apimstufsse40dnm8wl2aozs.blob.core.windows.net",
"ports": [
"443"
],
"accessibility": "Available"
},
{
"domainName": "apimstufsse40dnm8wl2aozs.file.core.windows.net",
"ports": [
"445"
],
"accessibility": "Available"
},
{
"domainName": "apimstufsse40dnm8wl2aozs.queue.core.windows.net",
"ports": [
"443"
],
"accessibility": "Available"
},
{
"domainName": "apimstufsse40dnm8wl2aozs.table.core.windows.net",
"ports": [
"443"
],
"accessibility": "Available"
},
{
"domainName": "gcs.prod.monitoring.core.windows.net",
"ports": [
"443"
],
"accessibility": "Available"
}
]
}
],
"outboundNetworkHealth": {
"state": "Healthy"
}
},
"CSS-ISE-Sub3": {
"networkDependencyHealthState": "Healthy",
"outboundNetworkDependencies": [
{
"category": "AzureStorage",
"displayName": "Azure Storage",
"endpoints": [
{
"domainName": "blob.core.windows.net",
"ports": [
"80",
"443"
],
"accessibility": "Available"
},
{
"domainName": "queue.core.windows.net",
"ports": [
"80",
"443"
],
"accessibility": "Available"
},
{
"domainName": "table.core.windows.net",
"ports": [
"80",
"443"
],
"accessibility": "Available"
},
{
"domainName": "file.core.windows.net",
"ports": [
"80",
"443"
],
"accessibility": "Available"
}
]
},
{
"category": "SQL",
"displayName": "Azure SQL Database",
"endpoints": [
{
"domainName": "database.windows.net",
"ports": [
"1433"
],
"accessibility": "Available"
}
]
},
{
"category": "AzureManagement",
"displayName": "Azure Management",
"endpoints": [
{
"domainName": "management.core.windows.net",
"ports": [
"443"
],
"accessibility": "Available"
},
{
"domainName": "admin.core.windows.net",
"ports": [
"443"
],
"accessibility": "Available"
},
{
"domainName": "management.azure.com",
"ports": [
"443"
],
"accessibility": "Available"
}
]
},
{
"category": "AzureActiveDirectory",
"displayName": "Azure Active Directory",
"endpoints": [
{
"domainName": "graph.windows.net",
"ports": [
"443"
],
"accessibility": "Available"
}
]
},
{
"category": "RegionalService",
"displayName": "Regional Service",
"endpoints": [
{
"domainName": "gr-prod-bay.cloudapp.net",
"ports": [
"443"
],
"accessibility": "Available"
},
{
"domainName": "az-prod.metrics.nsatc.net",
"ports": [
"443"
],
"accessibility": "Available"
}
]
},
{
"category": "SSLCertificateVerification",
"displayName": "SSL Certificate Verification",
"endpoints": [
{
"domainName": "ocsp.msocsp.com",
"ports": [
"80",
"443"
],
"accessibility": "Available"
},
{
"domainName": "mscrl.microsoft.com",
"ports": [
"80",
"443"
],
"accessibility": "Available"
},
{
"domainName": "crl.microsoft.com",
"ports": [
"80",
"443"
],
"accessibility": "Available"
},
{
"domainName": "www.microsoft.com",
"ports": [
"80",
"443"
],
"accessibility": "Available"
},
{
"domainName": "crl3.digicert.com",
"ports": [
"80",
"443"
],
"accessibility": "Available"
},
{
"domainName": "ocsp.digicert.com",
"ports": [
"80",
"443"
],
"accessibility": "Available"
},
{
"domainName": "cacerts.digicert.com",
"ports": [
"80",
"443"
],
"accessibility": "Available"
},
{
"domainName": "www.thawte.com",
"ports": [
"80",
"443"
],
"accessibility": "Available"
}
]
}
],
"outboundNetworkHealth": {
"state": "Healthy"
}
}
}
lots of information can be obtained from this JSON but we will be only interested in networkDependencyHealthState
After parsing the JSON we need to check the health of the three subnets
{
  "and": [
    {
      "equals": [
        "@concat(body('Parse_JSON')?['CSS-ISE-Sub2']?['networkDependencyHealthState'],body('Parse_JSON')?['CSS-ISE-Sub3']?['networkDependencyHealthState'],body('Parse_JSON')?['CSS-ISE-Sub4']?['networkDependencyHealthState'])",
        "HealthyHealthyHealthy"
      ]
    }
  ]
}
you can use multiple “Ands” as well
BTW parsing the JSON is not necessary
Last step
the last step will be sending an email and terminate the flow
by Contributed | Nov 11, 2020 | Technology
This article is contributed. See the original author and article here.
Welcome to the October update of Java Azure Tools! This is the first blog post for a new monthly update series for all the Azure tooling support we are providing for Java users, covering Maven/Gradle plugins for Azure, Azure Toolkit for IntelliJ/Eclipse and Azure Extensions for VS Code. Follow us and you will get more exciting updates in the future blogs.
In this update, you will see the brand new experience creating/deploying Azure Web Apps and Functions with IntelliJ. We will show you how to diagnose Web Apps with log streams, SSH, remote file explorer and profiling tools. Finally, we’d also like to show you the JBoss EAP support and Gradle project support. On to the update.
New experience in IntelliJ for Web Apps and Functions
The Azure Toolkit for IntelliJ 3.45.0 release brings major improvements on the Azure Web Apps and Azure Functions create and deploy workflow. Check out the example below for Web Apps:
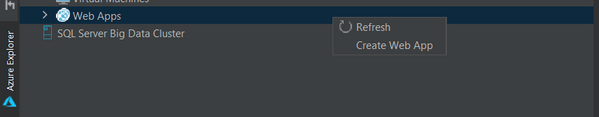
New entries from Azure Explorer
Now you can right click on Web Apps in Azure Explore and select Create Web App to open the app creation wizard, which was hidden in “Deploy to Azure Web Apps” wizard before.

You can also right click on a existing Web App in Azure Explorer and select Deploy to open the deployment wizard. You now have the option to select projects or pre-built artifacts as you wish.

Simple mode, hints and validator in Web App creation
We are aiming at providing a more user friendly getting started experience for new Azure Web Apps Java users. As result when you click Create Web App you will only see 2 settings now: Name and Platform. You can accept default or select More Settings to configure details including resource group , pricing tier and so on. With validators on settings like app name, you no longer need to wait a deployment failed after minutes telling you that the app name is already taken. You can also hover on the question marks to learn more about what those settings mean.

Web App Diagnostic
We are glad to announce the full diagnostic experience for Azure Web Apps starting from Azure Toolkit for IntelliJ v3.45.0. You can now easily troubleshoot your Web App on Azure with powerful features added recently:
Log streaming
Right click on the Web App in Azure Explorer and select Start Streaming Logs and you will see real time logs showing up in IntelliJ. You can stop it by select Stop Streaming Logs.

One-click SSH
Right click on the Web App in Azure Explorer and select SSH into Web App and you will get a terminal connected to the app instance on Azure in minutes. You are now free to run any command and play around. Note that this preview feature is only for Linux Web App and requires Azure CLI installed.

Remote file explorer
Here is the third option to view logs and explore your app! Click on the Web App in Azure Explorer and you will see two folders under the node. Click on the remote folders and explore any files in your Azure Web App instance. For example, you can double click and directly open log files in the editor, or right click on the file to download.

Profiling on the fly
Flight recorder support was also added in the Azure Toolkit for IntelliJ! You can now start profiling your Java Web Apps in Azure explorer by right clicking on the Web App in Azure Explorer and select Profile Flight Recorder and the report in .jfr format will be downloaded automatically. You can then analyze the report with Zulu Mission Control or directly inside IntelliJ if you are using Ultimate (2020.2 or above).

Gradle project support in IntelliJ
Here to mention that Gradle project is now supported in Azure Toolkit for IntelliJ. Now you can add configurations to deploy Gradle projects to Azure Web Apps and Azure Spring Cloud. The toolkit will then pick up the latest build and push to Azure once you hit Run or Shift+F10.

JBoss EAP support for Web Apps
JBoss EAP is now in Public Preview as a new runtime offering for Azure Web Apps and we are adding tooling support for it. Starting from version 1.12.0, you can chose JBoss EAP as runtime stack running the Maven plugin config goal in your project directory:
mvn com.microsoft.azure:azure-webapp-maven-plugin:1.12.0:config
Following is a sample configuration generated, note that both .war and .ear artifacts are supported. Besides Maven plugin, JBoss Web Apps is now supported in Azure Toolkit for IntelliJ as well.
      <plugin>
        <groupId>com.microsoft.azure</groupId>
        <artifactId>azure-webapp-maven-plugin</artifactId>
        <version>1.12.0</version>
        <configuration>
          <schemaVersion>v2</schemaVersion>
          <subscriptionId>xxxxxxxx-xxxx-xxxx-xxxx-xxxxxxxxxxxx</subscriptionId>
          <resourceGroup>helloworld-1604469657612-rg</resourceGroup>
          <appName>helloworld-1604469657612</appName>
          <pricingTier>B2</pricingTier>
          <region>westeurope</region>
          <runtime>
            <os>Linux</os>
            <javaVersion>Java 8</javaVersion>
            <webContainer>Jbosseap 7.2</webContainer>
          </runtime>
          <deployment>
            <resources>
              <resource>
                <directory>${project.basedir}/target</directory>
                <includes>
                  <include>*.war</include>
                </includes>
              </resource>
            </resources>
          </deployment>
        </configuration>
      </plugin>
Try it out
Please don’t hesitate to give it a try! Your feedback and suggestions are very important to us and will help shape our product in future.

by Contributed | Nov 11, 2020 | Technology
This article is contributed. See the original author and article here.
We are continuing to publish new class types, which are are based on real-world classes that schools have hosted using Azure Lab Services. This newest class type shows how to set up labs for Project Lead the Way (PLTW) classes.
PLTW is a nonprofit organization that provides PreK-12 curriculum across the United States in computer science, engineering, and biomedical science. In each PLTW class, students use a variety of software applications as part of their hands-on learning experience. Many of the software applications require either a fast CPU, or in some cases, a GPU (such as AutoDesk’s software).
Read this class type to see:
- Recommended VM sizes for the different types of PLTW classes
- How to set up the licensing server
- Steps for setting up the template VM image
- How students can connect to their VM from their Windows, Mac or Chromebook devices
Here is where you can find the new PLTW class type: https://docs.microsoft.com/azure/lab-services/class-type-pltw.

Thanks!
Azure Lab Services Team
by Contributed | Nov 11, 2020 | Technology
This article is contributed. See the original author and article here.
Final Update: Wednesday, 11 November 2020 14:04 UTC
We’ve confirmed that all systems are back to normal with no customer impact as of 11/11, 13:05 UTC. Our logs show the incident started on 11/11, 10:00 UTC and that during the ~3 hours that it took to resolve the issue, some customers may have experienced missed or delayed log search alerts in north central US, central US, west US
Root Cause: A configuration change in the recent deployment that has been rolled back.
Incident Timeline: 3 Hours & 5 minutes – 11/11, 10:00 UTC through 11/11, 13:05 UTC
We understand that customers rely on Log Search Alerts as a critical service and apologize for any impact this incident caused.
-Sandeep
Initial Update: Wednesday, 11 November 2020 11:31 UTC
We are aware of issues within Log Search Alerts and are actively investigating. Some customers may experience missed or delayed log search alerts in north central US, central US, west US. The start time of the issue is 11/11 10:00 UTC.
- Work Around: none
- Next Update: Before 11/11 16:00 UTC
We are working hard to resolve this issue and apologize for any inconvenience.
-Sandeep
by Contributed | Nov 11, 2020 | Technology
This article is contributed. See the original author and article here.
In certain conditions, we may need to monitor all HTTP/HTTPS traffic from APIM self-hosted gateway, which is deployed into Linux Docker Container.
Capturing Fiddler trace is one of the available options. However, there are limitations:
- APIM self-hosted gateway image is built by Azure APIM product group and we cannot build the Fiddler tool into the container image.
- APIM self-hosted gateway is a Linux container. Fiddler Classic only works in Windows environment.
The instructions below guide you how to bypass the limitations and capture Fiddler trace in Linux containers (for APIM self-hosted gateway).
Pre-requirements:
Before starting, you must setup the environment at first.
To set up a local development environment, you need to have:
- API Management instance. If you don’t have one, please follow this tutorial.
- Deploy an Azure API Management self-hosted gateway to Docker. If you don’t have one, please follow this tutorial.
- Install Fiddler Classic into your local computer. To download Fiddler Classic, please click this link.
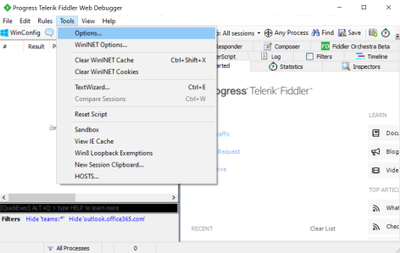
Steps to implement:
- Open Fiddler. Go to Options… => Connections, select Allow remote computes to connect. In the screenshot below, Fiddler listens on port 8888. Then Fiddler will capture traffic from another machine (any OS).


- Go to HTTPS and DISABLE Decrypt HTTPS traffic.

- Open CMD on the start menu. Check your local IP with the command ipconfig. My IP is 100.64.77.231 as shown in the screenshot below.

- Open the file env.conf for the APIM self-hosted gateway. Specify the HTTP/HTTPS proxy here. Fiddler by default listens the port 8888, as discussed in the Step One.

- Deploy the Docker container by following this tutorial. Please use the modified file env.conf in step 4.
- Use command “docker exec your-container-id env” to check if HTTP/HTTPS proxy is enabled as environment variables within the docker container. As shown in the screenshot below, the traffic is flowed into the Fiddler, but the HTTPS requests are still encrypted.

- If we need to decrypt the HTTPS traffic, we need to install Fiddler root certificate into the container CA certificate list. Go back to Fiddler. Open Options => HTTPS => Actions. Select Export Root Certificate to Desktop. The certificate name should be FiddlerRoot.cer by default.

- Copy the root certificate to the docker container by using the following command:
- docker cp C:Usersyour-user-nameDesktopFiddlerRoot.cer your-container-id:/home/fiddlerPublicCert.cer
- As update CA certificates in the Docker container needs the admin permission, we can exec into the Docker container in iterative mode by using the following command:
- docker exec -u root -it your-container-id /bin/sh
- Update the CA certificates to enable the fiddler root cert by the following command:

- Go back to Fiddler. Open Options => HTTPS. Enable Decrypt HTTPS traffic.

- To test if Fiddler can capture the requests in Docker container, we can send the simple requests to the APIM self-hosted gateway via CURL. In the tests below, I sent two HEAD requests to the self-hosted gateway and Fiddler successfully capture both.


by Contributed | Nov 11, 2020 | Technology
This article is contributed. See the original author and article here.
Hi Team, it’s Eric Jansen again, here in part one of a series of discussions revolving around the extremely exciting topic of the DNS Analytical Log. Alright, maybe it’s not that exciting, so crack open your favorite energy drink and let’s chat. Today I’ll be talking about something that I’ve seen a number of requests for from our internal discussion groups that support engineers have posted asking on behalf of their customers. In summary, that question is: “Can the DNS Analytical Log be customized to only log certain data? I only care about X,Y, and Z when I’m digging through the logs; the rest just gets in my way and makes the log fill up faster than necessary.”
Well, boys and girls, I’m here to announce that you can both have your cake and eat it too. The answer is YES YOU CAN! Who’s excited!? Yeah…I hear ya, me too!
First things first though, for those that don’t know what the DNS Analytical Log is, read this. For everyone else, let’s move on to the exciting part – but first take another sip of your favorite energy drink – it’s a bit of a long read.
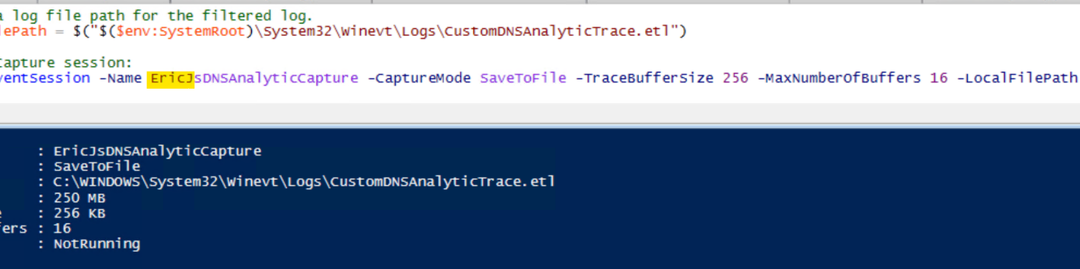
OK, so how do we go about doing this? Well, let’s pick it apart. We’ll treat it as if we’re doing a custom ETL trace defining the DNS Analytic provider and the data that we’re looking for – Primarily because, that’s what’s happening; it’s just a default configuration that gets reset every time you stop and start the built-in DNS Analytical Log. With that said though, lets run through an example of setting up a custom trace using PowerShell, and hopefully that’ll help you better understand the end result of what happens when I later modify the built-in DNS Analytical Log:
Step 1: Define a path to your .ETL and create an Event Session.

So far so good…
…Until it’s not so good. I say that because inevitably, some folks that try the above may get an error showing the following:

The issue that you’ll run into (if you get that error) is that you can only have one session running at a time. In this case, I tried to immediately start another event session after I already had one started. If another session is already running, you’d need to find what it is, and stop/remove it, if it’s not in use (in your lab, of course). You can do that by running Get-NetEventSession, and if you find an Event Session that’s running, you’ll need to Stop-NetEventSession, and finally you’ll need to remove it using Remove-NetEventSession. After that, you should be able to create your session.
Step 2: Figure out what options the DNS Analytics Provider offers, so that you can input data into Step 3.
For that, I wrote a little snippet of code to help you out:
function Get-ProviderKeyWordData ([Parameter(Mandatory=$true)]$Provider, [switch]$ShowLevels )
{
$ProviderKeywords = Get-WinEvent -ListProvider $Provider | select -ExpandProperty keywords
$ConvertedKeywordTable = @()

    Foreach ($Keyword in $ProviderKeywords){
    $KWConvertedToHex = "{0:x16}" -f $Keyword.value
    $KWHashTable = [Ordered]@{KeywordName = $Keyword.name;KeyWordValue = $("0x" + $KWConvertedToHex)}
    $ConvertedKeywordTable += New-Object psobject -Property $KWHashTable
    }
$ConvertedKeywordTable

$LevelData = @()
    IF($ShowLevels){
    $Levels = Get-WinEvent -ListProvider $Provider | select -ExpandProperty Levels
    foreach($Level in $Levels){$LevelData += New-Object psobject -Property @{DisplayName = $Level.DisplayName ;Level = $("0x" +$Level.Value)} }
    }

$LevelData | ft -AutoSize
}
Of course, all of my code comes with the following disclaimer:
This is a sample script. Sample scripts are not supported under any Microsoft standard support program or service. The sample scripts are provided AS IS without warranty of any kind. Microsoft further disclaims all implied warranties including, without limitation, any implied warranties of merchantability or of fitness for a particular purpose. The entire risk arising out of the use or performance of the sample scripts and documentation remains with you. In no event shall Microsoft, its authors, or anyone else involved in the creation, production, or delivery of the scripts be liable for any damages whatsoever (including, without limitation, damages for loss of business profits, business interruption, loss of business information, or other pecuniary loss) arising out of the use of or inability to use the sample scripts or documentation, even if Microsoft has been advised of the possibility of such damages.
With that out of the way, when you run the function, and define the DNS provider for the provider parameter value, it’ll display the KeywordNames and KeyWordValues, as well as the Level options, if you use the –ShowLevels parameter:

Step 3: Add the ETW provider to the Event Session with the specific options that you’d like to collect.
In this case, I was looking for Errors, with a KeyWordName of “RESPONSE_FAILURE”, however, because it’s a bitmask value, you can pick and choose as many options as you want. For the purposes of my demonstration, however, I’m just choosing the one value of interest. Also, note the required type casting for each variable in the screenshot below.


Step 3: Start the Session.

Step 4: So now, I’m going to switch it up a bit and look for AutoLoggers and/or Sessions that are using the “Microsoft-Windows-DNSServer“ Provider GUID, and it just happens to find the trace that I just started in the list. Interesting…

Step 5: Consume more of your energy drink, while collecting data, and then check your progress.

Step 6: OK, we’ve collected some data, let’s stop the trace and see what we’re able to find.

Indeed, it looks like the only data that we’re getting back is what we wanted – “RESPONSE_FAILURE” events with a level of “Error“. In this case, it’s showing domain names that are being blocked by Query Resolution Policies, that clients are attempting to query, but are being refused.
Step 7: We’ve validated that the trace only showed us what we wanted, so let’s remove the session since it’s no longer needed.

Alright, so now let’s see if we can apply this same logic to the built-in DNS Analytical Debug Log, but where do we begin? Well, if the default DNS Analytical Log is just an ETW session, let’s see what sessions are using the “Microsoft-Windows-DNSServer“ Provider GUID before and again after we start the DNS Analytical Log.
Before:

Enable the DNS Analytic Log:

After:

OK, so we’ve determined that once the built-in DNS Analytic Log is started, it creates an AutoLogger and a Session for collecting data, showing the default configuration for data collection. We’ve also determined that there’s a useful cmdlet named Get-ETWTraceProvider.. If only we could modify this, to meet our own requirements…. Perhaps there’s a Set-EtwTraceProvider?….prepare to be happy, because there is! Awesome.
OK, so, when we created the custom trace earlier, looking for AutoLoggers and Sessions that were using that provider you may have noticed that it only created a session when we did a Get-ETWTraceProvider -GUID ‘{EB79061A-A566-4698-9119-3ED2807060E7}’. With that said, all we really need to modify is the “EventLog-Microsoft-Windows-DNSServer-Analytical” session – no need to attempt to modify the AutoLogger.
So, let’s use the same logic that we did when we created the custom trace, when adding the provider to the event session, but with Set-EtwTraceProvider and see what happens:

Crash and burn. We failed with Access Denied.…. But what if we had more power? Let’s try to run as SYSTEM and see what happens. To do this I used a third-party function called Invoke-CommandAs, written by a Mr. Marc Kellerman that can be found on his Github page, here.
So, after running as system, it looks like there’s no more ‘Access Denied’ issues, AND the Level and KeyWord values match what I set them to.

I trust what I see above, but let’s verify to see what’s being logged:

Wouldya look at that!? When the log was initially started, it was collecting any / all DNS analytic events that met the criteria of the provider, but as soon as I modified the session, it changed to only the data of interest that I defined when running Set-ETWTraceProvider. I like it!
But do the changes persist, or does it reset to the default if I disable the log, and then re-enable the log? I may have already answered that above, but let’s see anyway:

The changes in fact DO NOT persist – some may prefer that, some may not. Fortunately, it’s all scriptable.
Well team, that’s all you get this time, but hopefully this proves to be useful to someone out there. Until next time, when we discuss more in regards to things that you can do with the DNS Analytical Log, and maybe talk about some of the Easter eggs in this blog posting.
by Contributed | Nov 11, 2020 | Technology
This article is contributed. See the original author and article here.
This week in our Azure Stack Hub Partner solution video series, I am going to introduce you to Azure Stack Hub Partner RFC. RFC is a strong partner focusing on offering a range of hosted services, managed services, and consultancy to its customers. They partner with a number of other ISVs to offer a complete solution where needed and have a range of customers. Join us in this video to explore how RFC provides value to their customer, both by partnering with other ISVs where needed or offering the Azure Stack Hub platform directly.
In this series, as we will meet customers that are deploying Azure Stack Hub for their own internal departments, partners that run managed services on behalf of their customers, and a wide range of in-between as we look at how our various partners are using Azure Stack Hub to bring the power of the cloud on-premises.
Links mentioned through the video:
I hope this video was helpful and you enjoyed watching it. If you have any questions, feel free to leave a comment below. If you want to learn more about the Microsoft Azure Stack portfolio, check out my blog post.

Recent Comments