by Contributed | Dec 14, 2020 | Technology
This article is contributed. See the original author and article here.
Enterprise data continues to grow in volume, variety and velocity but much of this data is not analyzed. As Analytics, BI, AI and ML continues to gain momentum, enabling easy access to meaningful data for data consumers is needed now more than ever.
Chief Data Officers can now enable business and technical analysts, data scientists, data engineers with access to trustworthy, valuable data.
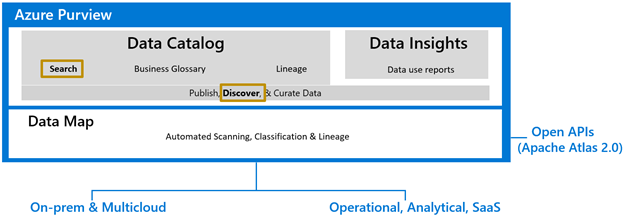
Figure 1: Search & Browse is at the core of Azure Purview that powers the discovery of business & technical metadata to drive data governance.
Intuitive search and browse experience:
The Search & Browse experience in Azure Purview Data Catalog makes finding the right data easy. Users specify what they are looking for in terms they are familiar with – the search index created in Azure Purview does the rest. Based on relationships between technical and business metadata gathered in the Purview Data Map, the search looks up the keyword in the index. Attributes such as name, description, owner, annotations, and so on return matching assets and results. The search results are page-ranked for relevance using Azure Purview scoring profiles building on the Azure Purview Data Map.
As an example, if you have glossary term on a table as “Promotion” and the description of a Power BI report as “Product promotion percent”. Searching for the keyword “promotion” will return the matching table and the report based on the keyword lookup on the term annotations and description.

Figure 2: Azure Purview global search box for auto complete, recent search history, auto suggestion and so on.
Search techniques employed include semantics, wildcard search, auto complete, and handling of special characters. As soon as the user starts typing, the search shows three sections.
- Recent search history
- Search suggestions based on a lookup of the index. This shows matching text from attributes like descriptions, owners, classifications, labels and so on.
- Asset suggestions powered by a wildcard lookup.
The user can take up one of the recommendations or proceed as-is.
Hierarchical browsing by data source
Another way to discover data is via the Browse asset experience. Here users can navigate through a hierarchy of data systems to discover relevant data assets. For eg: The user wants to get to a specific customer dataset that she knows resides in a folder called “Dimensions” in Data Lake but is unaware of the actual name of the dataset. With Azure Purview, now the user can simply go to the Browse asset experience in Purview and navigate the folder structure of the Data Lake to self-serve the dataset details.
The hierarchical Browse asset experience is available for all types of data sources including SQL Server, Power BI, Storage account, Azure Data Factory, Teradata and so on.

Figure 3: Browse your organizations data using the data source hierarchical name space.
Related assets
Azure Purview combines the search and browse experience to enhance data discovery of structured and unstructured data. The discovery can start with a keyword search to get the list of assets ranked by search relevance. On asset selection, the overview of an asset and additional details like Schema, Lineage, Contacts, and Related tabs are displayed. Users can go to “Related” to see the technical hierarchy for the selected asset. Users can then navigate the hierarchy to see the child assets at each level.

Figure 4: Navigate the hierarchy of data source from Related tab
In the above screen shot, the data discovery started with search for “sample submission”. From the search results, the blob “sample_submission.csv” is selected. In the related tab, you can navigate the hierarchy of the Blob store to see related datasets in each folder.
Get started now!
We are looking forward to hearing how Azure Purview helped unlock the potential of your organization’s data using Search & Browse asset.
- Create an Azure Purview account now and start understanding your data supply chain from raw data to business insights with free scanning for all your SQL Server on-premises and Power BI online
- Use the tutorials to scan and catalog your organization data
- Start discovering your organization data using Search & Browse
by Contributed | Dec 14, 2020 | Dynamics 365, Microsoft 365, Technology
This article is contributed. See the original author and article here.
If you’re responsible for the smooth operation of warehouse operations across your organization, you know that managing inventory, machines, people, and resources efficiently while meeting tight delivery deadlines means that you need to have resilience in your supply chain. To help companies like yours execute mission-critical manufacturing and distribution processes without interruptions, we recently announced a preview for cloud and edge scale unit add-ins for Dynamics 365 Supply Chain management.
So how can your company benefit from cloud and edge scale units? One effective tactic is to place scale units near the location where production work is donewhether that’s in the cloud or right inside the four walls of the warehouse facility. That way, you can take advantage of the dedicated capacity that scale units provide.
Monogram Foods Solutions is a leading manufacturer and marketer of value-added meat products, snacks, and appetizers. Their team is participating in the preview. As noted here, they’re having great success with scale units:
“Our frozen goods warehouse has a tighttime constrained picking process, and it is critical for our warehouse team to have a consistent and reliably quick response throughout the entire picking operation. The architectural design of the solution ensures that these critical warehouse workloads are isolated from the rest of our operations, eliminating points of contention during these time-sensitive processes.”
Transition to workloadsforresilientwarehouseexecution
You can find more information about what scale units are and how to set them up for the warehouse executionworkload inthe documentation.In this blog post, we’re going to take a deeper look into how to implement dedicated scale units.
With theworkloadforwarehouseexecution,you cantransition theexecution phase of warehouse processes intodedicatedscale units.The workload definesthescopeof business processes, data, andpoliciesincluding rules, validation, and ownershipfor what runs in thescale unit.Inbound, outbound, and otherwarehouse management processeshave beensplit into decoupled phases for planning, execution, receiving, and shipping.
After you configure the workload, the workers on thewarehousefloorcontinue to go through the work,like choosing the mobile warehousemanagement experience,connecteddirectlyto thededicated processing capacity in thescale unit.
Hybrid multi-node topology makes it all work
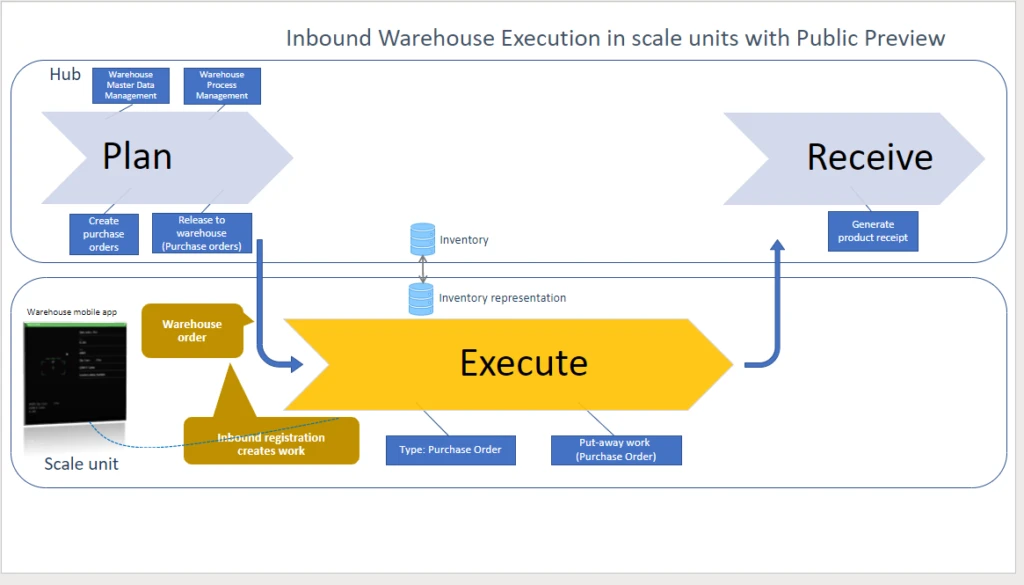
Inthehybridmulti-node topology,individual nodes are responsiblefor pieces in the distribution processes.The hub supports data management, warehouse process management, and release of orders to the warehouseand as well as some finalization steps, depending on the scenario.
For inbound warehouse processes, the responsibility of the workload on the scale unit beginswhen thepurchasing agentreleasespurchase ordersto the warehouse.Itusesrecordsofthe newtype ofwarehouseordersto trigger theworkforthe warehouseclerkson thefloor.
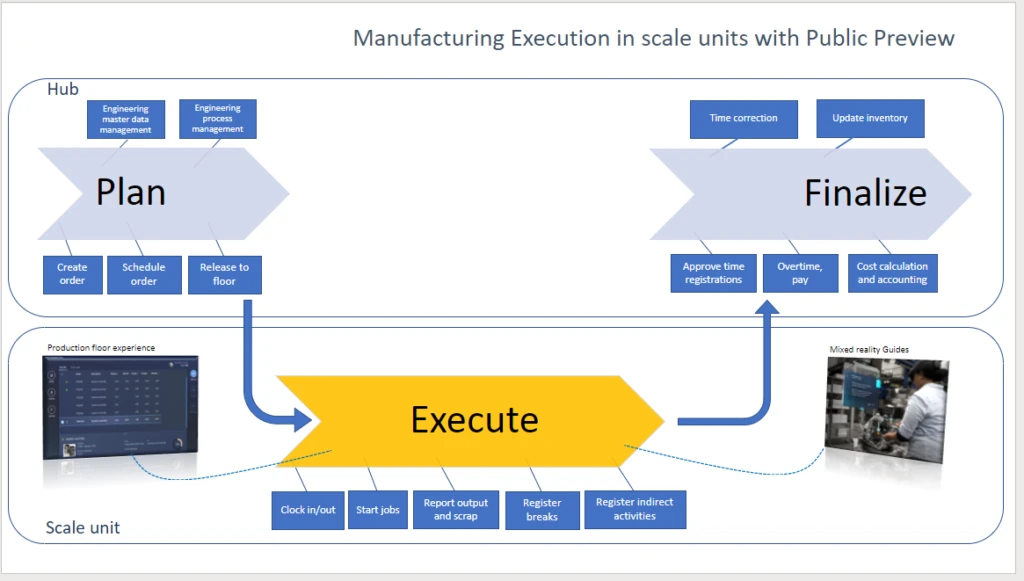
A copy of the relevant inventoryisavailable on the scale unit and isconstantly keptin syncwith the central inventory. For temporarily disconnected edge scale units, this local inventory acts as alocal cache, so the warehouse workercancompletework like put-away,independentlyof thescale unit.
As soon as warehouseworkershave completedatask, the cloud hub runs thenext steps.In the public preview,thisincludesthe generation of thereceiptsfor the receiving process.The transition happensinstantaneouslyifthe (edge) scale unithasconnectivity.
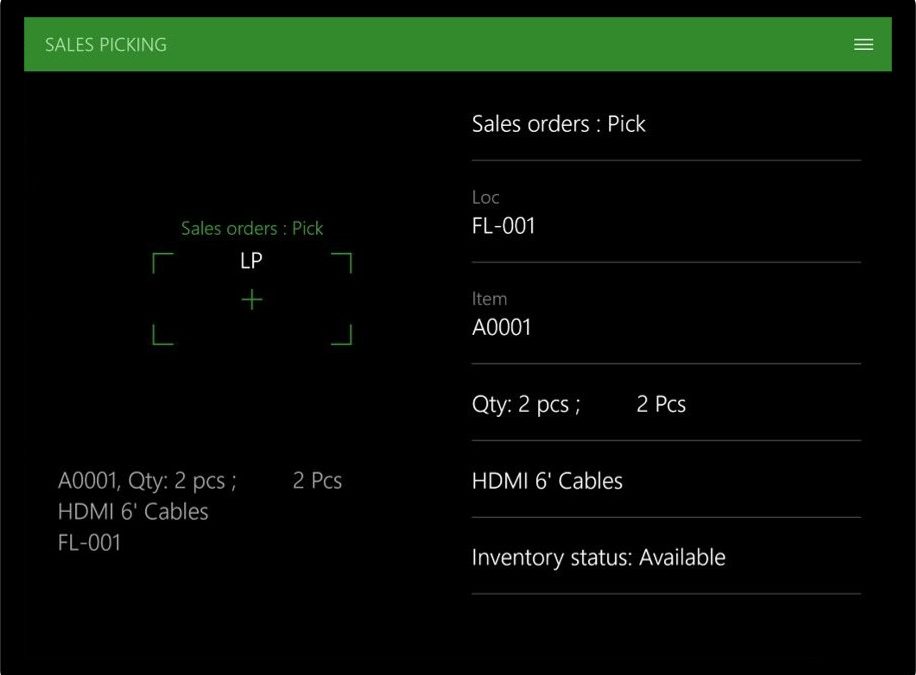
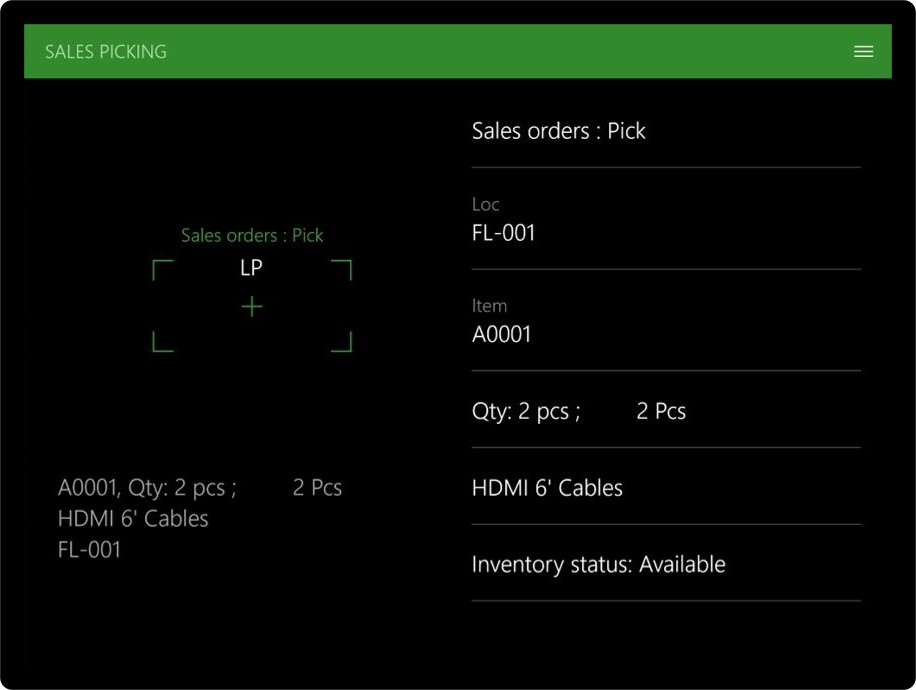
Sales clerksfindsupportinoutboundwarehouse processeswhenreleasingsales orders to the warehouse.Theworkload in thescale unit will apply the relevantwave processing methodandwarehouseworkerswillperformtaskslike picking.From there,theshipping processwilltakeover. Tasks likethe packing slip generation willstill continue onthe cloud hubin the previewversion.
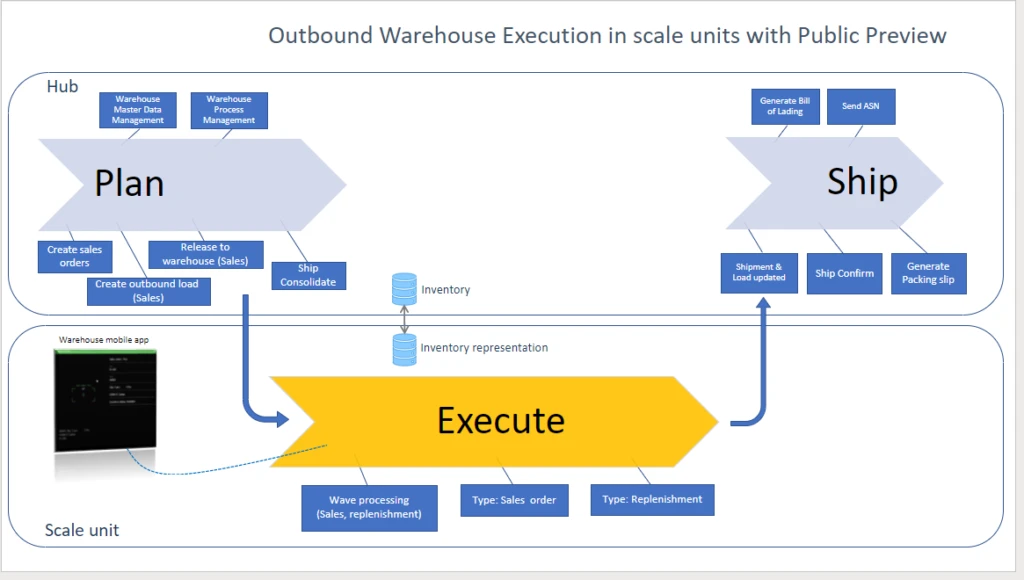
The workload for warehouse execution supports additionaloperations that runfullyon the scale unit.Warehouse workers caninquireaboutitems,itemlocations,and license plates,as well as moveitemswithinthe warehouse.
Take away: Scale units help you to build resilient warehouse execution
Dynamics 365 Supply Chain Management transitions to a multi-node supply chain topology. This allows customers to build resilience by deploying scale units in the cloud or on the edge with built-in redundancy and flexible management.
The warehouse execution workloads in the public preview show how business processes support resilience in this hybrid multi-node topology for supply chain management. Microsoft will continue finetuning the responsibilities of workloads in scale units based on customer feedback to address the most common use cases out of the box.
In the upcoming Spring release updates, you will find several important enhancements. Warehouse workers in outbound scenarios can perform simple picking and loading work for transfer orders on scale units. Label printing will be available on scale units, including support for wave labels. Further enhancements include cluster picking, wave processing for shipments, change of workers, cancelation, location movement, and completion of work for sales and transfer orders.
Nextsteps
Learn moreabout cloud andedgescaleunits and other important topics in the documentationfor Dynamics 365 Supply Chain Management.
The post Robust warehouse execution with Dynamics 365 Supply Chain Management appeared first on Microsoft Dynamics 365 Blog.
Brought to you by Dr. Ware, Microsoft Office 365 Silver Partner, Charleston SC.
by Scott Muniz | Dec 14, 2020 | Security
This article was originally posted by the FTC. See the original article here.
Today, the FTC joined forces with numerous federal, state, and local government partners in Operation Income Illusion, an effort to fight income scams and help people recognize and avoid them.
Brought to you by Dr. Ware, Microsoft Office 365 Silver Partner, Charleston SC.
by Contributed | Dec 14, 2020 | Technology
This article is contributed. See the original author and article here.
The Integrate Hub within Azure Synapse Analytics workspace helps to manage, creating data integration pipelines for data movement and transformation. In this article, we will use the knowledge center inside the Synapse Studio to immediately ingest some sample data, US population by gender and race for each US ZIP code sourced from 2010 Decennial Census. Once we have access to the data, we will use a data flow to filter out what we don’t need and transform the data to create a final CSV file stored in the Azure Data Lake Storage Gen2.
Using Sample Data From Azure Synapse Knowledge Center
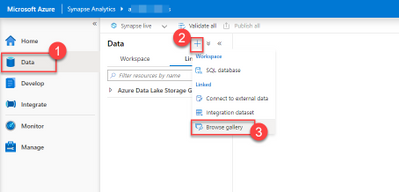
Our first step will be to get access to the data we need. Inside the Synapse workspace, choose the Data option from the left menu to open the Data Hub.
Data Hub is open. The plus button to add new artifacts is selected. Browser Gallery from the list of linked data source options is highlighted.
Once in the gallery, make sure Datasets page is selected. From the list of available sample datasets, choose US Population by ZIP Code and select Continue.

Knowledge Center dataset gallery is open. US Population by ZIP Code dataset is selected. Continue button is highlighted.
On the next screen, you can see the dataset’s details and observe a preview of the data. Select Add dataset to include the dataset into your Synapse workspace as a linked service.

US Population by ZIP Code dataset details are shown. Add dataset button is highlighted.
Data Exploration With the Serverless SQL Pool
Once the external dataset is included to your workspace as a linked service, it will show up under the Data hub as under Azure Blog Storage / Sample Datasets section. Select the Actions button for us-decennial-census-zip represented as “…” to see a list of available actions for the linked data source.

us-decennial-census-zip sample dataset is selected. The actions button is highlighted.
We will now query the remote data source using our serverless SQL pool to test our access to the data source. From the Actions menu Select New SQL Script / Select Top 100 rows. This will bring an auto-generated SQL script.

The actions menu for us-decennial-census-zip is shown. New SQL script is selected, and Select Top 100 rows command is highlighted.
Select Run and see the data presented in Results tab.

The actions menu for us-decennial-census-zip is shown. New SQL script is selected, and Select Top 100 rows command is highlighted.
Creating Integration Datasets for Ingest and Egress
Now that we proved our access to the data source, we can create integration datasets that will be our source and sink datasets. Feel free to close the current SQL Script window and discard all changes.

The Data hub is on screen. Add new resource button is selected. From the list of resources integration dataset is highlighted.
Select the “+” Add new resource button to open the list of available resources we can add to our Synapse workspace. We will create two integration datasets for our example. The first one will help us integrate our newly added remote data source into a data flow. The second one will be an integration point for the sink CSV file we will create in our Azure Data Lake Storage Gen2 location.
Select Integration dataset to see a list of all data sources you can include. From the list, pick Azure Blob Storage and select Continue.

New integration dataset window is open. Azure Blob Storage option is selected. Continue button is highlighted.
Our source files are in the Parquet format. Pick Parquet as the file format type and select Continue.

File format options window is open. Parquet is selected. Continue button is highlighted.
On the next screen set the dataset name to CensusParquetDataset. Select us-decennial-census-zip as the Linked service. Finally, for the file path set censusdatacontainer for Container, and release/us_population_zip/year=2010 for Directory. Select OK to continue.

Dataset properties window is open. The dataset name is set to CensusParquetDataset. Linked Service is set to us-decennial-census-zip. File path is set to censusdatacontainer. File Path folder is set to release/us_population_zip/year=2010. Finally, the OK button is highlighted.
Select the “+” Add new resource button and pick Integration dataset again to create our sink dataset. For this round, choose Azure Data Lake Storage Gen2 for the data store.

New integration dataset window is open. Azure Data Lake Storage Gen2 option is selected. Continue button is highlighted.
Our target file will be a CSV file. Pick DelimitedText as the file format type and select Continue.

File format options window is open. DelimitedText is selected. Continue button is highlighted.
On the next screen, set the dataset name to USCensus. Select Synapse workspace default storage as the Linked service. Finally, for the file path, select the Browse button and pick a location to save the CSV file. Select OK to continue. In our case, we selected default-fs as the file system and will be saving the file to the root folder.

Dataset properties window is open. The dataset name is set to USCensus. Linked Service is set to the default workspace storage. File path is set to default-fs. Finally, the OK button is highlighted.
Now that we have both our source and sink datasets ready. It is time to select Publish all and save all the changes we implemented.

CensusParquetDataset and USCensus datasets are open. Publish All button is highlighted.
Data Transformation With a Pipeline and a Dataflow
Switch to the Integrate Hub from the left menu. Select the “+” Add new resource button and select Pipeline to create a new Synapse Pipeline.

Integrate Hub is open. Add Resource is selected. Pipeline command is highlighted.
Name the new pipeline USCensusPipeline and search for data in the Activities panel. Select Data flow activity and drag and drop one onto the screen.

New pipeline window is open. Pipeline’s name is set to USCensusPipeline. The activities search box is searched for data. Data flow activity is highlighted.
Pick Create new data flow and select Data flow. Select Continue.

New data flow window is open. Create new data flow option is selected. Data flow is selected. The OK button is highlighted.
Once you are in the Dataflow designer give your Dataflow a name. In our case, it is USCensusDataFlow. Select CensusParquetDataset as the Dataset in the Source settings window.

Dataflow name is set to USCensusDataFlow. The source dataset is set to CensusParquetDataset.
Select the “+” button on the right of the source in the designer panel. This will open the list of transformation you can do. We will filter out the data to only include the ZIP Code 98101. Select Filter Row Modifier to add the activitiy into the data flow.

Data transformations menu is open. Filter row modifier is highlighted.
On the Filter settings tab you can define your filtering expression in the Filter on field. Select the field box to navigate to the Visual expression builder.

Filter settings tab is open. Filter on field is highlighted.
The data flow expression builder lets you interactively build expressions to use in various transformations. In our case, we will use equals(zipCode, “98101”) to make sure we only return records with the 98101 ZIP code. Before selecting Save and finish make sure you take a look at the Expression elements list and the Expression values that includes the fields extracted from the source data schema.

Visual expression builder is open. Expression is set to equals(zipCode, “98101”). Expression elements, expression values are highlighted. Save and finish button is selected.
Our data flow’s final step is to create the CSV file in Azure Data Lake Storage Gen2 for further use. We will add another step to our data flow. This time, it will be a sink as our output destination.

Data transformations menu is open. Sink is highlighted.
Once the sink is in place, set the dataset to USCensus. This is the dataset targeting our Azure Data Lake Storage Gen2.

Sink dataset is set to USCensus.
Switch to the Settings tab for the sink. Set the File name option to Output to single file. Output to single file combines all the data into a single partition. This leads to long write times, especially for large datasets. In our case, the final dataset will be very small. Finally, set the Output to single file value to USCensus.csv.

Sink settings panel is open. Output to single file is selected and it’s value is set to USCensus.csv. Set Single partition button is highlighted.
Now, it’s time to hit Publish All and save all the changes.

Publish all button is highlighted.
Close the data flow editor. Go back to our USCensusPipeline. Select Add Trigger and Trigger now to kick start the pipeline for the first time.

USCensusPipeline is open. Add trigger is selected and Trigger now command is highlighted.
Results Are In
To monitor the pipeline execution go to the Monitor Hub. Select Pipeline runs and observe your pipeline executing.

Monitor Hub is open. Pipeline runs is selected. USCensusPipeline pipeline row is highlighted showing status as in progress.
Once the pipeline is successfully executed, you can go back to the Data hub to see the final result. Select the workspace’s default Azure Data Lake Storage Gen2 location that you selected as your sink and find the resulting USCensus.csv file that is only 26.4KB with census data for the ZIP code used as the filter.

Data Hub is open. Workspace’s default ADLS Gen2 storage is open. USCensus.csv file and its 26.5KB size is highlighted.
Keeping Things Clean and Tidy
We created a list of artifacts in our Synapse workspace. Let’s do some cleaning before we go.
First of all, delete the CSV file our pipeline created. Go to the Data hub, select the workspace’s default Azure Data Lake Storage Gen2 location that you selected as your sink and find the resulting USCensus.csv file. Select Delete from the command bar to delete the file.

Data Hub is open. Workspace’s default ADLS Gen2 storage is open. USCensus.csv file is selected. Delete command is highlighted.
Go to the Integrate hub and select the USCensusPipeline we created. Select the Actions command and select Delete to remove the pipeline. Don’t forget to hit Publish All to execute the delete operation on the Synapse workspace.

Integrate Hub is open. USCensusPipeline is selected. Actions menu is open and delete command is highlighted.
Go to the Develop hub and select the USCensusDataFlow we created. Select the Actions command and select Delete to remove the dataflow. Don’t forget to hit Publish All to execute the delete operation on the Synapse workspace.

Develop Hub is open. USCensusDataFlow is selected. Actions menu is open and delete command is highlighted.
Go to the Data hub and select the USCensus we created. Select the Actions command and select Delete to remove the dataset. Repeat the same steps for the CensusParquetDataset as well. Don’t forget to hit Publish All to execute the delete operation on the Synapse workspace.

Develop Hub is open. USCensus is selected. Actions menu is open and delete command is highlighted.
Go to the Manage hub and select Linked services. From the list, select the us-decennial-census-zip. Select Delete to remove the linked service.

Manage Hub is open. The Linked services section is selected. The delete button for us-decennial-census-zip linked service is highlighted.
We are done. Our environment is the same as it was before.
Conclusion
We connected to a third-party data storage service that has parquet files in it. We looked into the files with the serverless SQL Pool. We created a pipeline with a data flow connecting to the outside source, filtering data out and putting the result in a CSV file in our data lake. While going through these steps, we have met with linked services, datasets, pipelines, dataflows, and a beautiful expression builder.
Go ahead, try out this tutorial yourself today by creating an Azure Synapse workspace.
by Contributed | Dec 14, 2020 | Technology
This article is contributed. See the original author and article here.
This year’s release of .NET happened a few weeks ago with .NET 5. (Core is gone from the name now.) I have some sample code that works as sort of a boilerplate to verify basic functionality without containing anything fancy. One of those is a web app where one can sign in through Azure AD B2C. Logically I went ahead and updated from .NET Core 3.1 to .NET 5 to see if everything still works.
It works, but there are recommendations that you should put in some extra effort as the current NuGet packages are on their way to deprecation. Not like “will stop working in two weeks”, but might as well tackle it now.
The Microsoft Identity platform has received an overhaul in parallel to .NET and a little while before the .NET 5 release the Identity team released Microsoft.Identity.Web packages for handling auth in web apps. (Not just for Azure AD B2C, but identity in general.)
Why is this upgrade necessary? Well, the old libraries were based on the Azure AD v1 endpoints, but these new libraries fully support the v2 endpoints. Which is great when going for full compliance with the OAuth and OpenID Connect protocols.
Using my sample at https://github.com/ahelland/Identity-CodeSamples-v2/tree/master/aad-b2c-custom_policies-dotnet-core I wanted to do a test run from old to new.
The current code is using Microsoft.AspNetCore.Authentication.AzureADB2C.UI. (You can take a look at the code for the Upgraded to .NET 5 checkpoint for reference.)
You can start by using NuGet to download the latest version of Microsoft.Identity.Web and Microsoft.Identity.Web.UI. (1.4.0 when I’m typing this.) You can also remove Microsoft.AspNetCore.Authentication.AzureADB2C.UI while you’re at it.
In Startup.cs you should make the following changes:
Replace
services.AddAuthentication(AzureADB2CDefaults.AuthenticationScheme)
  .AddAzureADB2C(options => Configuration.Bind("AzureADB2C", options)).AddCookie();
With
services.AddAuthentication(OpenIdConnectDefaults.AuthenticationScheme)
  .AddMicrosoftIdentityWebApp(Configuration.GetSection("AzureADB2C"));
And change
services.AddRazorPages();
To
services.AddRazorPages().AddMicrosoftIdentityUI();
If you have been doing “classic” Azure AD apps you will notice how B2E and B2C are now almost identical. Seeing how they both follow the same set of standards this makes sense. As well as making it easier for .NET devs to support both internal and external facing authentication.
B2C has some extra logic in the sense that the different policies drive you to different endpoints, so the UI has to have awareness of this. And you need to modify a few things in the views.
In LoginPartial.cshtml:
Change
@using Microsoft.AspNetCore.Authentication.AzureADB2C.UI
@using Microsoft.Extensions.Options
@inject IOptionsMonitor<AzureADB2COptions> AzureADB2COptions

@{
  var options = AzureADB2COptions.Get(AzureADB2CDefaults.AuthenticationScheme);
}
To
@using Microsoft.Extensions.Options
@using Microsoft.Identity.Web
@inject IOptions<MicrosoftIdentityOptions> AzureADB2COptions

@{
  var options = AzureADB2COptions.Value;
}
And change the asp-area in links from using AzureADB2C:
<a class="nav-link text-dark" asp-area="AzureADB2C" asp-controller="Account" asp-action="SignOut">Sign out</a>
To using MicrosoftIdentity:
<a class="nav-link text-dark" asp-area="MicrosoftIdentity" asp-controller="Account" asp-action="SignOut">Sign out</a>
And that’s all there is to it :)
Azure AD B2C SignUp
Now this is a fairly stripped down sample app without the complexity of a real world app, but this was a rather pain free procedure for changing the identity engine in a web app.
by Contributed | Dec 14, 2020 | Technology
This article is contributed. See the original author and article here.
Ever since we introduced Windows Containers in Windows Server 2016, we’ve seen customers do amazing things with it – either with new applications that leverage the latest and greatest of .Net Core and all other cloud technologies, but also with existing applications that were migrated to run on Windows Containers. MSMQ falls into this second scenario.
MSMQ was an extremely popular messaging queue manager launched in 1997 that became extremely popular in the 2000’s with enterprises using .Net and WCF applications. Today, as companies look to modernize existing applications with Windows Containers, many customers have been trying to run these MSMQ dependent applications on containers “as is” – which means no code changes or any adjustments to the application. However, MSMQ has different deployment options and not all are currently supported on Windows Containers.
In the past year, our team of developers have tested and validated some of the scenarios for MSMQ and we have made amazing progress on this. This blog post will focus on the scenarios that work today on Windows Containers and some details on these scenarios. In the future we’ll publish more information on how to properly set up and configure MSMQ for these scenarios using Windows Containers.
Supported Scenarios
MSMQ can be deployed on different modes to support different needs from customers. Between private and public queues, transactional or not, and anonymous or with authentication, MSMQ can fit different scenarios – but not all can be easily moved to Windows Containers. The table below lists the currently supported scenarios:
Scope
|
Transactional
|
Queue location
|
Authentication
|
Send and receive
|
Private
|
Yes
|
Same container (single container)
|
Anonymous
|
Yes
|
Private
|
Yes
|
Persistent volume
|
Anonymous
|
Yes
|
Private
|
Yes
|
Domain Controller
|
Anonymous
|
Yes
|
Private
|
Yes
|
Single host (two containers)
|
Anonymous
|
Yes
|
Public
|
No
|
Two hosts
|
Anonymous
|
Yes
|
Public
|
Yes
|
Two hosts
|
Anonymous
|
Yes
|
The scenarios above have been tested and validated by our internal teams. In fact, here are some other important information on the results of these tests:
- Isolation mode: All tests worked fine with both isolation modes for Windows containers, process and hyper-v isolation.
- Minimal OS and container image: We validated the scenarios above with Windows Server 2019 (or Windows Server, version 1809 for SAC), so that is the minimal version recommended for using with MSMQ.
- Persistent volume: Our testing with persistent volume worked fine. In fact, we were able to run MSMQ on Azure Kubernetes Service (AKS) using Azure files.
Authentication with gMSA
From the table above, you can deduce that the only scenario we don’t support is for queues that require authentication with Active Directory. The integration of gMSA with MSMQ is currently not supported as MSMQ has dependencies on Active Directory that are not in place at this point. Our team will continue to listen to customer feedback, so let us know if this is a scenario you and your company are interested in. You can file a request/issue on our GitHub repo and we’ll track customer feedback there.
Let us know how the validation of MSMQ goes with your applications. We’re looking forward to hear back from you as you continue to modernize your applications with Windows containers.
by Contributed | Dec 14, 2020 | Technology
This article is contributed. See the original author and article here.
We’re thrilled to share new enhancements to the advanced hunting data for Office 365 in Microsoft 365 Defender. Following your feedback we’ve added new columns and optimized existing columns to provide more email attributes you can hunt across. These additions are now available in public preview.
We’ve made the following changes to the EmailEvents and EmailAttachmentInfo tables:
- Detailed sender info through the following new columns:
- SenderDisplayName – Name of the sender displayed in the address book, typically a combination of a given or first name, a middle initial, and a last name or surname
- SenderObjectId – Unique identifier for the sender’s account in Azure AD
- We’ve also optimized and organized threat detection information, replacing four separate columns for malware and phishing verdict information with three new columns that can accommodate spam and other threat types.
New column
|
Mapping to previous columns
|
Description
|
ThreatTypes
|
MalwareFilterVerdict
|
Verdicts from the email filtering stack on whether the email contains malware, phishing, or other threats
|
PhishFilterVerdict
|
DetectionMethods
|
MalwareDetectionMethod
|
Technologies used to threats. This column will cover spam detection technologies in addition to the previous phishing and malware coverage.
As part of this change, we have updated the set of technologies for Phish/Malware threats, as well as introduced detection tech targeted for Spam verdicts.
(NOTE: This is available in EmailEvents only, but will eventually be added to EmailAttachmentInfo.)
|
PhishDetectionMethod
|
ThreatNames
|
N/A – New
|
Json of technology used to malware, phishing, or other threats found in the email.
|
If you want to look for a specific threat, you can use the ThreatTypes column. These new columns will be empty if there are no threats—they will no longer be populated with values like with “Null”, “Not phish”, or “Not malware”.
Here is an example comparing the values in the old columns and the new columns:
Columns
|
Values
|
Old columns
|
|
PhishDetectionMethod
|
[“Anti-spoof: external domain”]
|
PhishFilterVerdict
|
Phish
|
MalwareFilterVerdict
|
Not malware
|
MalwareDetectionMethod
|
null
|
New columns
|
|
ThreatTypes
|
Phish, Spam
|
ThreatNames
|
|
DetectionMethods
|
{“Phish”:[“Anti-spoof: external domain”],”Spam”:[“DomainList”]}
|
- Connectors—this new column in the EmailEvents table provides information about custom instructions that define organizational mail flow and how the email was routed.
- Additional information on organizational-level policies and user-level policies that were applied on emails during the delivery. This information can help you identify any unintentional delivery of malicious messages (or blocking of benign messages) due to configuration gaps or overrides, such as very broad Safe Sender policies. This information is provided through the following new columns:
- OrgLevelAction – Action taken on the email in response to matches to a policy defined at the organizational level
- OrgLevelPolicy – Organizational policy that triggered the action taken on the email
- UserLevelAction – Action taken on the email in response to matches to a mailbox policy defined by the recipient
- UserLevelPolicy – End user mailbox policy that triggered the action taken on the email
As always, we’d love to know what you think. Leave us feedback directly on Microsoft 365 security center or contact us at AHfeedback@microsoft.com.
by Contributed | Dec 14, 2020 | Technology
This article is contributed. See the original author and article here.
Basketball and coding share more than you think. They both require creativity, curiosity, and the ability to look at the big picture while strategizing your next move. Space Jam: A New Legacy is the perfect inspiration to learn computer and data science, and we’ve teamed up to create unique learning paths for data science and machine learning.
The new learning path, Use machine learning to coach Looney Tunes basketball players, inspired by SPACE JAM: A NEW LEGACY, is inspired by real basketball players and the stats that guide the game of basketball.
In the first module of this learning path, you will learn how to use machine learning to impute missing data and discover bimodality in data separating human basketball players from Tune Squad players to create a complete dataset of player statistics, including their Player Efficiency Rating.
The second module is where you get the opportunity to take your data into the game. You will use machine learning to create a realistic simulated dataset of player stats throughout one game. Using this dataset, you will learn how to create and deploy a basic web app to support a coach’s decision making on which players to give a water break to, and which to put in the game.
With the power of Visual Studio Code, Azure, and GitHub, you will level up your coding skills while solving real-world challenges, with a little extra pizzazz from your favorite Tune Squad players. And, if you’re someone who also likes to watch walkthroughs of code, Dr. G is launching a short series of video tutorials guiding you through the learning path.
Welcome to the Jam! Basketball champion and global icon LeBron James goes on an epic adventure alongside timeless Tune Bugs Bunny in the animated/live-action event “Space Jam: A New Legacy,” from director Malcolm D. Lee and an innovative filmmaking team including Ryan Coogler and Maverick Carter. This transformational journey is a manic mashup of two worlds that reveals just how far some parents will go to connect with their kids. When LeBron and his young son Dom are trapped in a digital space by a rogue A.I., LeBron must get them home safely by leading Bugs, Lola Bunny, and the whole gang of notoriously undisciplined Looney Tunes to victory over the A.I.’s digitized champions on the court: a powered-up roster of basketball stars as you’ve never seen them before. It’s Tunes versus Goons in the highest-stakes challenge of his life, that will redefine LeBron’s bond with his son and shine a light on the power of being yourself. The ready-for-action Tunes destroy convention, supercharge their unique talents and surprise even “King” James by playing the game their own way.
We’re excited to partner with this film because learning to code doesn’t have to be a series of the same sample project, together we can explore new tech skills paired with our love for basketball with an added flare of fun Looney Tunes characters. If you’re interested in other learning opportunities for younger students and educators, check out our post on the Microsoft Education Blog. Be sure to check out the new learning path today and don’t forget to catch the film, coming 2021!
by Contributed | Dec 14, 2020 | Technology
This article is contributed. See the original author and article here.
This past year has been one of tremendous integration between Microsoft Teams and SharePoint. SharePoint provides rich content services that power files, lists and pages directly inside of Teams. Team members can easily highlight files, organize lists, and design pages – all as powerful tabs in Teams – due to the ease of benefitting more from the connected SharePoint team site.
We’re pleased to announce the following updates within Teams – all powered by SharePoint:
- Updated flow to add Microsoft Teams to your SharePoint team site
- Updated SharePoint tab app
- Updated SharePoint pages tab app
More screenshots, details, and links to documentation below…
Unifying Teams and SharePoint content collaboration
Updated flow to add Microsoft Teams to your SharePoint team site
[roadmap ID: 46990]
We’re pleased to announce that we are making it even easier to bring SharePoint content into Teams, in the same motion of adding Microsoft Teams to your team site, aka #teamify.
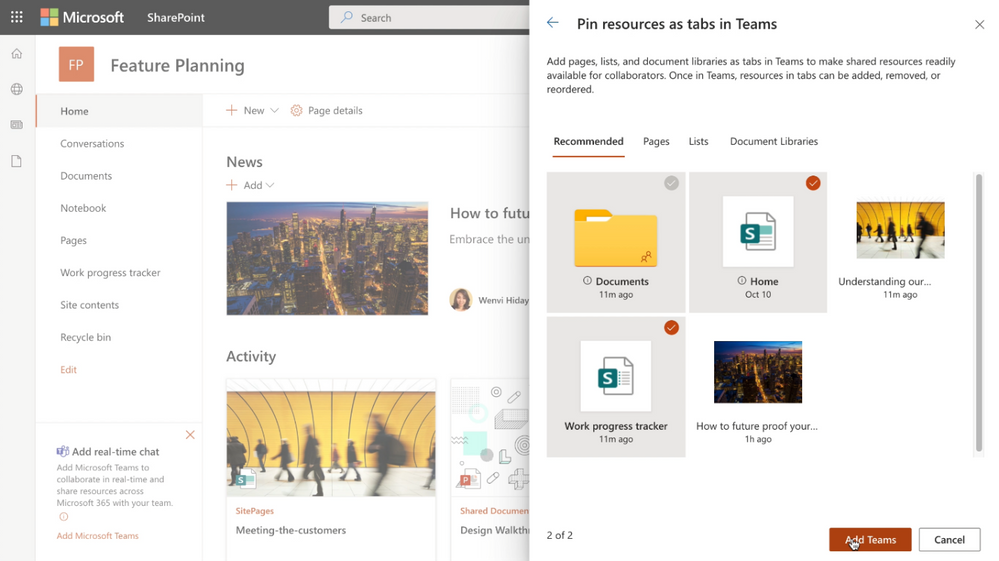
We’ll make it easy to choose lists, libraries and pages that you want to bring into Teams as tabs. When you’ve selected what you need, click the Add Team button to make it happen. By default, your team site home page will be selected, you can change it to suit your needs, and you can fully navigate primary document library from the Files tab – just follow the folder breadcrumbs.
When adding Microsoft Teams to your SharePoint team site, you can select resources (pages, lists and document libraries) to be added as tabs in the general channel of the newly created Teams team.
Once in Teams, it is easy to collaborate with the same group directly around the SharePoint content you just brought in. Pick the same list or page (even the team site home page) you were just working on and engage your colleagues with chat side-by-side the list directly in Teams.

With your content available in Teams, we make it even easier to collaborate and get work done.
Learn more about adding Microsoft Teams to your SharePoint team site.
Updated SharePoint tab app
[roadmap ID: 68860]
We have improved the SharePoint tab experience when adding pages, lists or document libraries to a channel in Teams. It’s easy to select multiple content types from the connected team site, or by providing a link to any other page, list or library to which the user has access.
 The updated SharePoint tab experience when adding pages, lists or document libraries to a channel in Teams.
We have also added a new “Recommended” section in the SharePoint tab to help user easily find the most relevant content from their site to pin in their channels. It’s a one-stop shop for adding various types of existing content that began in SharePoint.
Learn more how to add a SharePoint page, list, or document library as a tab in Teams.
Updated SharePoint pages app
[roadmap ID: 60614]
Using SharePoint pages is a great way to consolidate and share content in the right context using images, Excel, Word and PowerPoint documents, videos, links, Twitter feeds and more – all on the same page. And now you can more easily your pages as tabs in Microsoft Teams.
The updated experience makes it easier to choose pages from the connected SharePoint team site and you can also add a page from any SharePoint site link and then paste the URL of the page, or news post, that you want to add as a tab.
 Choose pages from the connected SharePoint team site or add a page from any SharePoint site (via URL).
SharePoint will validate the SharePoint URL and if you have access to the page. Permissions of the page itself will not change, and if users on the team do not have permission to the tabbed page, they will be shown a page to request access.
Note: When adding content as tabs in Teams, you may notice a few SharePoint-powered apps – here as an FYI and clarity (in quotes is the text that shows in-app). This is an area of investment to ensure you can easily connect content stored in SharePoint in Teams channels:
- “SharePoint”– add existing content from the connected team site or any SharePoint site – including: Recommended content, Pages, Lists and Document libraries.
- “SharePoint Pages”– add a SharePoint page from the connected team site or from any SharePoint site using a URL. (this is the new app mentioned above)
- Microsoft “Lists”– Create a new list for your team or add an existing list from any existing SharePoint site. (more about working with the Lists app in Microsoft Teams)
- “SharePoint lists”– you may see this app if you don’t yet have the new Lists app. It can be used to bring existing lists as a tab in Teams – but not to create a new list.
- SharePoint “Document Library”– add a SharePoint document library from relevant sites or use a SharePoint document library URL to a site or folder.
Learn more about adding SharePoint pages as tabs in Microsoft Teams, plus further info on how to use built-in and custom tabs in Microsoft Teams.
In closing …
When people work together and get things done, there is less confusion between team members and the content they create. This is the design goal behind Microsoft Teams – the hub for teamwork – and the reason why SharePoint is deeply integrated to provide great content experiences and services within the same user interface. And, it’s all backed by world-class security and compliance to meet the needs of every team across your organization.
At Microsoft, our mission is to empower every person and organization on the planet to achieve more. And when you do this together – as a team – it’s teamwork that moves things forward.
Thanks, @Microsoft_Teams_team
 Microsoft Teams plus SharePoint = better together.
by Scott Muniz | Dec 14, 2020 | Security
This article was originally posted by the FTC. See the original article here.
The FTC and its law enforcement partners announced actions against several income scams that conned people out of hundreds of millions of dollars by falsely telling them they could make a lot of money. One of those scams was 8 Figure Dream Lifestyle, which touted a “proven business model” and told people they could make thousands of dollars in a couple of weeks if they paid to join the program. The FTC says those income claims were false. Customers paid between $2,395 and $22,495 to get started, and many took personal loans or racked up credit card debt to buy in. Approximately 94% of those customers lost money, with losses averaging almost $10,500 per person. That’s equal to two months of take-home pay for someone making the median household income.
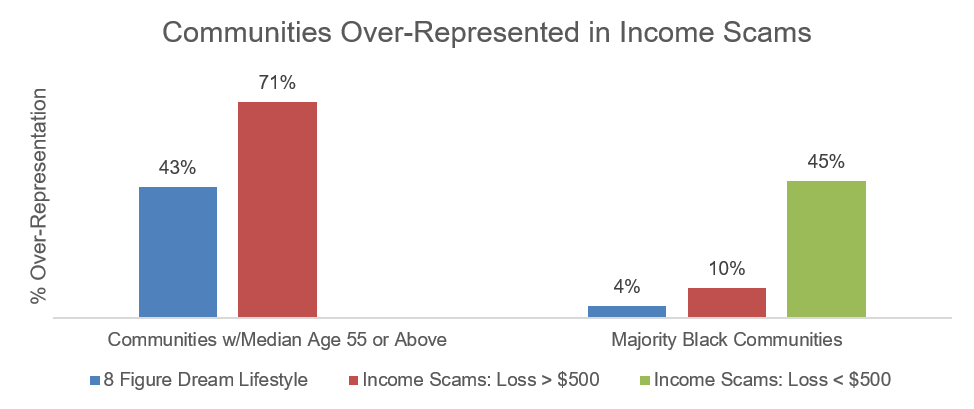
FTC economist Devesh Raval matched the addresses of the 8 Figure Dream Lifestyle customers to U.S. Census Bureau data to learn how the scam impacted different communities. He found that the percentage of customers who lost money and live in zip codes that skew older (median age of 55 or above) was 43% greater than their share of the population. In other words, they were over-represented in the 8 Figure Dream Lifestyle customer database.
Raval did a similar study of several cases the FTC has brought against other income scams. The analysis showed that these income scams affected different communities at different rates. Where the average loss to scams was more than $500, more of the people affected tended to live in zip codes that skewed older. Where the average loss to scams was less than $500, more of the people affected tended to live in zip codes with a majority Black population.
Savvy scammers know that many of us want financial freedom or to be our own boss. But as FTC cases show, many of these so-called opportunities are money-losing propositions. That’s why it pays to learn how to recognize these scams. If you’re tempted by an opportunity like this, read When a Business Offer or Coaching Program is a Scam. It might save you from losing hundreds – or even thousands – of dollars. Share it in your community to help others recognize these scams. And if you see a scam like this, tell the FTC at ReportFraud.ftc.gov.
Brought to you by Dr. Ware, Microsoft Office 365 Silver Partner, Charleston SC.

Recent Comments