by Contributed | Dec 15, 2020 | Technology
This article is contributed. See the original author and article here.
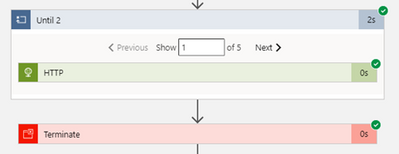
The default behavior of the Until Loop is to Succeed if all actions inside it are successful, and depending on your run after behavior, when the Loop limit is reached. This behavior can be changed from the code view of the Logic App.
The default behavior:
Actions are Successful, the Loop hits the limit and returns Success as all actions were successful. The limit was hit but the result is Success for the Loop.
Add loops to repeat actions – Azure Logic Apps | Microsoft Docs
Let’s say you wish to change this behavior and you require the Until Loop to fail when it reaches the Loop Limit.
Fail Loop when limit is reached behavior:
To let the Until Loop fail when the limit is reached; just add the below in the code behind in the JSON of the Until Loop, this option is not available in the GUI yet (at the time of writing this blog):
“operationOptions”: “FailWhenLimitsReached”,

“Until_2”: {
“actions”: {
“Execute_stored_procedure“: {
………………………..
}
},
“expression”: “@equals(variables(‘myUntilStop’), true)”,
“limit”: {
“count”: 5,
“timeout”: “PT1H”
},
“operationOptions“: “FailWhenLimitsReached“,
“runAfter“: {
“Initialize_variable_8”: [
“Succeeded“
]
},
“type”: “Until”
}
and this is how to do it! As easy as that.

by Contributed | Dec 14, 2020 | Business, Microsoft, Technology, Tips and Tricks
This article is contributed. See the original author and article here.
Hi there, I am Matt Balzan, and I am a Microsoft Modern Workplace Customer Engineer who specializes in SCCM, APP-V and SSRS/PowerBI reporting.
Today I am going to show you how to write up SQL queries, then use them in SSRS to push out beautiful dashboards, good enough to send to your boss and hopefully win that promotion you’ve been gambling on!
INGREDIENTS
- Microsoft SQL Server Management Studio (download from here)
- A SQL query
- Report Builder
- Your brain
Now that you have checked all the above, let us first go down memory lane and do a recap on SQL.
WHAT EXACTLY IS SQL?
SQL (Structured Query Language) is a standard language created in the early 70s for storing, manipulating and retrieving data in databases.
Does this mean that if I have a database with data stored in it, I can use the SQL [or T-SQL] language to grab the data based on conditions and filters I apply to it? Yep, you sure can!
A database is made up of tables and views and many more items but to keep things simple we are only interested in the tables and views.
Your table/view will contain columns with headers and in the rows is where all the data is stored.

The rows are made up of these columns which contain cells of data. Each cell can be designed to have text, datetime, integers. Some cells can have no values (or NULL values) and some are mandatory to have data in them. These settings are usual setup by the database developer. But thankfully, for reporting we need not worry about this. What we need is data for our reports, and to look for data, we use t-SQL!
But wait! – I have seen these queries on the web, and they all look double-Dutch to me!
No need to worry, I will show you how to read these bad boys with ease!
ANATOMY OF A SQL QUERY
We have all been there before, someone sent you a SQL query snippet or you were browsing for a specific SQL query and you wasted the whole day trying to decipher the darn thing!
Here is one just for simplicity:
select Name0,Operating_System_Name_and0 from v_R_System where Operating_System_Name_and0 like ‘%server%’
My quick trick here is to go to an online SQL formatter, there are many of these sites but I find this one to be perfect for the job: https://sql-format.com/
Simply paste the code in and press the FORMAT button and BOOM!

Wow, what a difference!!! Now that all the syntax has been highlighted and arranged, copy the script, open SSMS, click New Query, paste the script in it and press F5 to execute the query.
This is what happens:

- The SELECT command tells the query to grab data, however in this case it will only display 2 columns (use asterisk * to get all the columns in the view)
- FROM the v_R_System view
- WHERE the column name contains the keyword called server using the LIKE operator (the % tells the filter to bring back zero, one, or multiple characters)
- The rows of data are then returned in the Results pane. In this example only all the server names are returned.
TIPS!
Try to keep all the commands in CAPITALS – this is good practice and helps make the code stand out for easier reading!
ALWAYS use single quotes for anything you are directing SQL to. One common mistake is to use code copied from the browser or emails which have different font types. Paste your code in Notepad and then copy them out after.
Here is another example: Grab all the rows of data and all the columns from the v_Collections view.
SELECT * FROM v_Collections
The asterisk * means give me every man and his dog. (Please be mindful when using this on huge databases as the query could impact SQL performance!)
Sometimes you need data from different views. This query contains a JOIN of two views:
SELECT vc.CollectionName
,vc.MemberCount
FROM v_Collections AS vc
INNER JOIN v_Collections_G AS cg ON cg.CollectionID = vc.CollectionID
WHERE vc.CollectionName LIKE ‘%desktop%‘
ORDER BY vc.CollectionName DESC
OK, so here is the above query breakdown:
- Grab only the data in the column called vc.CollectionName and vc.MemberCount from the v_Collections view
- But first JOIN the view v_Collections_G using the common column CollectionID (this is the relating column that both views have!)
- HOWEVER, only filter the data that has the word ‘desktop‘ in the CollectionName column.
- Finally, order the list of collection names in descending order.
SIDE NOTE: The command AS is used to create an alias of a table, view or column name – this can be anything but generally admin folk use acronyms of the names (example: v_collections will be vc) – Also noteworthy, is that when you JOIN tables or VIEWS you will need to create the aliases, they probably might have the same column names, so the alias also solves the problem of getting all of the joined columns mixed up.
T-SQL reference guide: https://docs.microsoft.com/en-us/sql/t-sql/language-reference?view=sql-server-ver15
OK, SO WHAT MAKES A GOOD REPORT?
It needs the following:
- A script that runs efficiently and does not impact the SQL server performance.
- The script needs to be written so that if you decide to leave the place where you work, others can understand and follow it!
- Finally, it needs to make sense to the audience who is going to view it – Try not to over engineer it – keep it simple, short and sweet.
SCENARIO: My customer wants to have a Task Sequence report which contains their company logo, the task sequence steps and output result for each step that is run, showing the last step run.
In my lab I will use the following scripts. The first one is the main one, it will join the v_r_System view to the vSMS_TaskSequenceExecutionStatus view so that I can grab the task sequence data and the name of the device.
SELECT vrs.Name0
,[PackageID]
,[AdvertisementID]
,vrs.ResourceID
,[ExecutionTime]
,[Step]
,[GroupName]
,[ActionName]
,[LastStatusMsgID]
,[LastStatusMsgName]
,[ExitCode]
,[ActionOutput]
FROM [vSMS_TaskSequenceExecutionStatus] AS vtse
JOIN v_R_System AS vrs ON vrs.ResourceID = vtse.ResourceID
WHERE AdvertisementID = @ADVERTID
ORDER BY ExecutionTime DESC
The second script is for the @ADVERTID parameter – When the report is launched, the user will be prompted to choose a task sequence which has been deployed to a collection. This @ADVERTID parameter gets passed to the first script, which in turn runs the query to grab all the task sequence data rows.
Also highlighted below, the second script concatenates the column name pkg.Name (this is the name of the Task Seq) with the word ‘ to ‘ and also with the column name col.Name (this is the name of the Collection), then it binds it altogether as a new column called AdvertisementName.
So, for example purposes, the output will be: INSTALL SERVER APPS to ALL DESKTOPS AND SERVERS – this is great, as we now know which task sequence is being deployed to what collection!
SELECT DISTINCT
adv.AdvertisementID,
col.Name AS Collection,
pkg.Name AS Name,
pkg.Name + ‘ to ‘ + col.Name AS AdvertismentName
FROM v_Advertisement adv
JOIN (SELECT
PackageID,
Name
FROM v_Package) AS pkg
ON pkg.PackageID = adv.PackageID
JOIN v_TaskExecutionStatus ts
ON adv.AdvertisementID = (SELECT TOP 1 AdvertisementID
FROM v_TaskExecutionStatus
WHERE AdvertisementID = adv.AdvertisementID)
JOIN v_Collection col
ON adv.CollectionID = col.CollectionID
ORDER BY Name
LET US BEGIN BY CREATING THE REPORT
- Open Microsoft Endpoint Configuration Manager Console and click on the Monitoring workspace.
- Right-click on REPORTS then click Create Report.
- Type in the name field – I used TASK SEQUENCE REPORT
- Type in the path field – I created a folder called _MATT (this way it sits right at the top of the folder list)
- Click Next and then Close – now the Report Builder will automatically launch.
- Click Run on the Report Builder popup and wait for the UI to launch. This is what it looks like:

STEP 1 – ADD THE DATA SOURCE

To get the data for our report, we need to make a connection to the server data source.
Right-click on Data Sources / Click Add Data Source… / Click Browse… / Click on Configmr_<yoursitecode> / Scroll down to the GUID starting with {5C63 and double-click it / Click Test Connection / Click OK and OK.
STEP 2 – ADD THE SQL QUERIES TO THEIR DATASETS

Copy your scripts / Right-click on Datasets / click on Add Dataset… / Type in the name of your dataset (no spaces allowed) / Select the radio button ‘Use a dataset embedded in my report’ / Choose your data source that was added in the previous step / Paste your copied script in the Query window and click OK / Click the radio button ‘Use the current Window user’ and click OK.
STEP 3 – ADJUST THE PARAMETER PROPERTIES

Expand the Parameters folder / Right-click the parameter ADVERTID / Select the General tab, under the Prompt: field type DEPLOYMENT – leave all the other settings as they are.

Click on Available Values / Click the radio button ‘Get values from a query’ / for Dataset: choose ADVERTS, for Value field choose AdvertisementID and for Label field choose AdvertisementName / Click OK.
Now when the report first runs, the parameter properties will prompt the user with the DEPLOYMENT label and grab the results of the ADVERTS query – this will appear on the top of the report and look like this (remember the concatenated column?):

OK cool – but we are not done yet. Now for the fun part – adding content!
STEP 4 – ADDING A TITLE / LOGO / TABLE

Click the label to edit your title / change the font to SEGOE UI then move its position to the centre / Adjust some canvas space then remove the [&ExecutionTime] field.

From the ribbon Insert tab / click Image, find a space on your canvas then drag-click an area / Click Import…, choose ALL files (*.*) image types then find and add your logo / Click OK.

Next click on Table, choose Table Wizard… / Select the TASKSEQ dataset and click Next / Hold down shift key and select all the fields except PackageID, AdvertisementID & ResourceID.
Drag the highlighted fields to the Values box and click Next / Click Next to skip the layout options / Now choose the Generic style and click Finish.
Drag the table under the logo.
STEP 5 – SPIT POLISHING YOUR REPORT

* A Placeholder is a field where you can apply an expression for labels or text, you wish to show in your report.
In my example, I would like to show the Deployment name which is next to the Task Sequence title:

In the title text box, right-click at the end of the text TASK SEQUENCE: / Click Create Placeholder… / under Value: click on the fx button / click on Datasets / Click on ADVERTS and choose First(AdvertisementName).
Finally, I wanted the value in UPPERCASE and bold. To do this I changed the text value to: =UCASE(First(Fields!AdvertisementName.Value, “ADVERTS”)) , click on OK.
I then selected the <<Expr>> and changed the font to BOLD.
Do not forget to save your report into your folder of choice!
Once you have finished all the above settings and tweaks, you should be good to run the report. Click the Run button from the top left corner in the Home ribbon.
If you followed all the above step by step, you should have now a report fit for your business – this is the output after a Deployment has been selected from the combo list:

- To test the Action Output column, I created a task sequence where I intentionally left some errors in the Run Command Line steps, just to show errors and draw out some detail.
- To avoid massive row height sizes, I set the cell for this column to font size 8.
- To give it that Azure report style look and feel, I only set the second row in the table with the top border being set. You can change this to your own specification.
Please feel free to download my report RDL file as a reference guide (Attachment on the bottom of this page)
LESSONS LEARNED FROM THE FIELD
- Best advice I give to my customers is to start by creating a storyboard. Draw it out on a sheet of blank or grid paper which gives you an idea where to begin.
- What data do you need to monitor or report on?
- How long do these scripts take to run? Test them in SQL SERVER MANAGEMENT STUDIO and note the time in the Results pane.
- Use the free online SQL formatting tools to create proper readable SQL queries for the rest of the world to understand!
- Who will have access to these reports? Ensure proper RBAC is in place.
- What is the target audience? You need to keep in mind some people will not understand the technology of the data.
COMING NEXT TIME…
My next blog will go into a deep dive in report design. I will show you how to manipulate content based on values using expressions, conditional formatting, design tips, best practices and much more….Thanks for reading, keep smiling and stay safe!
DISCLAIMER
The sample files are not supported under any Microsoft standard support program or service. The sample files are provided AS IS without warranty of any kind. Microsoft further disclaims all implied warranties including, without limitation, any implied warranties of merchantability or of fitness for a particular purpose. The entire risk arising out of the use or performance of the sample files and documentation remains with you. In no event shall Microsoft, its authors, or anyone else involved in the creation, production, or delivery of the files be liable for any damages whatsoever (including, without limitation, damages for loss of business profits, business interruption, loss of business information, or other pecuniary loss) arising out of the use of or inability to use the sample scripts or documentation, even if Microsoft has been advised of the possibility of such damages.
Matt Balzan | Modern Workplace Customer Engineer | SCCM, Application Virtualisation, SSRS / PowerBI Reporting
by Contributed | Dec 14, 2020 | Technology
This article is contributed. See the original author and article here.
As an Azure Stack Hub operator, you can quickly find solutions to many issues in the Support Portal in global Azure. In this blog post, we’ll join Shireen Isab (PM on the Azure Stack Hub team) as we walk through how to quickly find an answer to an Azure Stack Hub problem.
In the Support Portal, you can find solutions created for specific problems customers have encountered in the past. This is a simple way of potentially identifying a solution for your individual problem, without actually creating a support ticket.
In addition to the Support Portal,you can also find troubleshooting topics and step-by-step instructions in the Azure Stack Hub product documentation for both the cloud operator tasks and for developers using the Azure Stack Hub user portal. You can also find information about new features and current issues can be found in the release notes section of the documentation. If you can’t find the answer to your problem through the support portal or the documentation, you can ask questions in the Microsoft Q&A for Azure Stack Hub or take part in the Azure Stack World Wide Community on Yammer. You can also find us using the tag #azurestackhub on Twitter, or ‘azure-stack’ in Stack Overflow to either post or find answers.
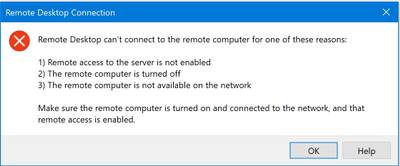
However, in this scenario, we will use the Support Portal. Let’s assume I have an issue connecting to a virtual machine that was created in Azure Stack Hub. I am having trouble connecting to the VM. I’m getting this message when I try to use Remote Desktop on my management computer to connect to my VM. I’ve already installed things on the VM, but now I can’t connect.
Before I got to support, I’ve tried to restart the VM, redeploy, and a take a look at the settings. I’m still unable to connect.
- From the Azure Stack Hub administrative portal, select the ? For Help + support.

- Select Create support request.
- Add the information about your issue in the New Support request form.

- Select Technical for issue type.
- Select your subscription.
- Select My services.
- Select Azure Stack Hub for the Service.
- Select the Resource group associated with your issue.
- Type a summary of your issue. In this case, “I cannot connect,” and so I summarize my issue. I type, “I cannot connect to my VM.” I then see a list of recommended solutions.

- Select the Problem type from the list of options – Here, I am having trouble connecting to my windows VM, and so I select Virtual Machine running Windows.
- Select the problem subtype. I cannot connect to my VM.
- Select Next: Solutions.

- I review the options in the recommended solutions. I check that my ports open. I open my Azure Stack Hub portal and then open the VM machine. I select Networking.

- I see that the port rule for RDP, port 3389, is set to Deny. I update to allow.
- I try with my RDP client again and I can connect.

I resolved this problem.
by Contributed | Dec 14, 2020 | Technology
This article is contributed. See the original author and article here.
Azure resource logs for Azure Storage is now in public preview in the Azure public cloud. These logs provide detailed information about successful and failed requests to a storage service. This information can be used to monitor individual requests and to diagnose issues with a storage service. Compared with classic storage logs, Azure Monitor logs for Storage is extended to support:
- Resource logs for Azure Files
- Resource logs for premium block blob storage and premium file shares
- Resource logs for Azure Data Lake Storage Gen2
- More enhancements including authentication context, TLS version, and other attributes
- Native query and analysis experience with Log Analytics
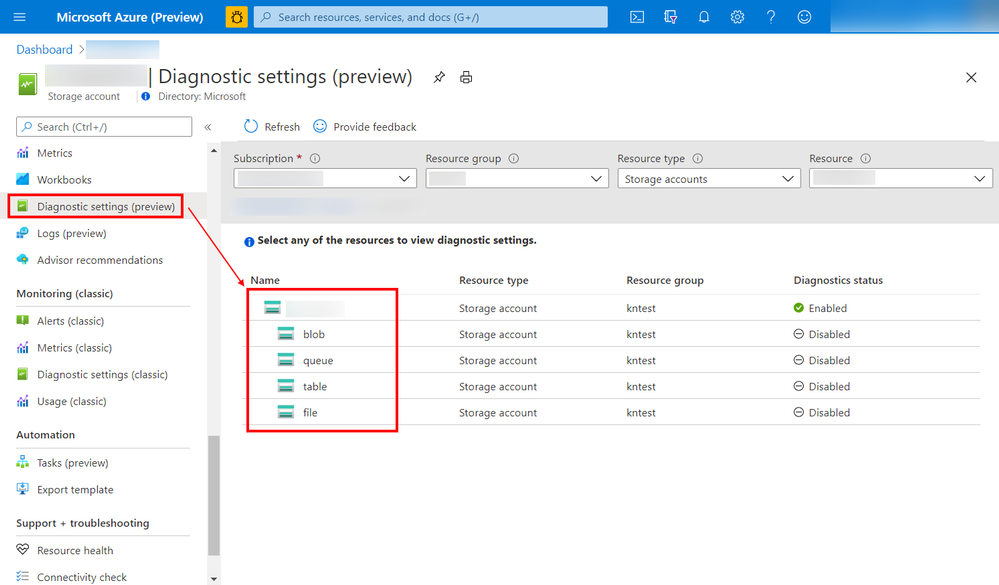
You can now configure diagnostic settings to consolidate storage logs to central storage accounts, send to Event Hub for streaming ingestion to SIEM tool or custom integration, or export to Log Analytics to query and analyze natively. Log export is charged per streaming volume. See Azure Monitor Pricing for details.
Screenshot of the configuration screen to set up the Storage logs
Learn more about this exciting new feature, and let us know what you think right here on the Tech Community!
by Contributed | Dec 14, 2020 | Technology
This article is contributed. See the original author and article here.
Cyber Security topic is one the most important topics in our mind when we develop application and systems on-perm or in cloud in general.
It is important to frequently perform and install security validations on applications. There are two important aspects for these security validations. First, developer should be able to detect any credentials or secrets in the code so developer can move them to a safe place. Also, DevOps and infrastructure team should be able to perform frequent security health checks on azure subscriptions.
In this series, I will go over very useful tools which help to improve the security of application and cloud resources. In Part 1, I will discuss CredScan. Part 2 will focus on secure DevOps Kit for Azure or AzSK and Part 3 will focus on Azure Sentinel and security health.
Managing Credentials in the Code with CredScan
The first aspect as we mentioned is the ability to detect any creds or secrets. Developer should be able to catch it before committing the code to Repo or during the pipeline process itself.
We all know it is easy to leave credentials in the code, especially in large projects. Team can always try to check for credentials manually, but it is not recommended way to look for sensitive information.
Credential Scanner (aka CredScan) is a tool developed and maintained by Microsoft to identify credential leaks such as those in source code and configuration files. Some of the commonly found types of credentials are default passwords, SQL connection strings and Certificates with private keys.
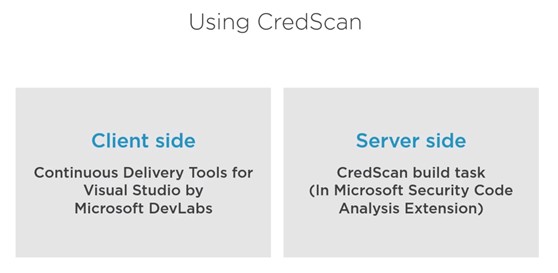
There are two version of CredScan server and client side as it shows in the following diagram
The client side
It is extension and currently support VS 2017 and you can download it from here
After installing the extension then we are ready to code and build and if our code has certain credential, the tool will catch it as following.

The downside for the client side there is no extension for VS 2019 or VS code yet. As Alternative for developers who are interested in installing first line of defense for creds scanning please refer to my blog git secrets
CredScan Server Side implementation
In order to use the server side version, developer needs to include “CredScan Build” task in project pipeline. For more information about obtaining Microsoft Security Code Analysis Extension, please review this document.
In Azure DevOps, we can add the tasks in Classic build Editor, CredScan can be added direct using search box

After adding the task, developer or DevOps engineer can fill the detail of the task
Available options include:
- Display Name: Name of the Azure DevOps Task. The default value is Run Credential Scanner
- Tool Major Version: Available values include CredScan V2, CredScan V1. We recommend customers to use the CredScan V2 version.
- Output Format: Available values include TSV, CSV, SARIF, and PREfast.
- Tool Version: We recommend you select Latest.
- Scan Folder: The repository folder to be scanned.
- Searchers File Type: The options for locating the searchers file that is used for scanning.
- Suppressions File: A JSON file can suppress issues in the output log. For more information about suppression scenarios, see the FAQ section of this article.
- Verbose Output: Self-explanatory.
- Batch Size: The number of concurrent threads used to run Credential Scanner. The default value is 20. Possible values range from 1 through 2,147,483,647.
- Match Timeout: The amount of time in seconds to spend attempting a searcher match before abandoning the check.
- File Scan Read Buffer Size: The size in bytes of the buffer used while content is read. The default value is 524,288.
- Maximum File Scan Read Bytes: The maximum number of bytes to read from a file during content analysis. The default value is 104,857,600.
- Control Options > Run this task: Specifies when the task will run. Select Custom conditions to specify more complex conditions.
- Version: The build task version within Azure DevOps. This option isn’t frequently used.

In YAML Pipeline Editor, Here is example for CredScan YAML task.
parameters:
  pool: 'Hosted VS2017'
  jobName: 'credscan'
  displayName: Secret Scan

jobs:
- job: ${{ parameters.jobName }}
  pool:
    name: ${{ parameters.pool }}

  displayName: ${{ parameters.displayName }}

  steps:
  - task: securedevelopmentteam.vss-secure-development-tools.build-task-credscan.CredScan@2
    displayName: 'Scan for Secrets'
    inputs:
      suppressionsFile: tools/credScan/suppress.json
      toolMajorVersion: V2
      debugMode: false
After adding the task, the pipeline will pass successfully only after passing CredScan task.
Summary
In this Part 1, we discussed the important of implementing first line of defense against credential leak by using CredScan client-side extension or CredScan task. In the next blog I will explore using AzSK to secure DevOps.
by Contributed | Dec 14, 2020 | Technology
This article is contributed. See the original author and article here.
Azure Security Center performs continuous assessment of your cloud workloads and provides the recommendations concerning the security of the environment. Azure Security Center covers scenarios by offering Cloud Security Posture Management (CSPM) and Cloud Workload Protection Platform (CWPP) capabilities (read this article for more details).
To cover the threat detections for the CWPP scenario you need to upgrade Security Center to Azure Defender. Azure Defender uses a variety of detection capabilities to alert you of potential threats to your environment. Azure Defender’s threat protection includes fusion kill-chain analysis, which automatically correlates alerts in your environment based on cyber kill-chain analysis, to help you better understand the full story of an attack campaign. The alerts can tell you what triggered the alert, what in your environment was targeted, the source of the attack, and remediation steps. You also have the flexibility to set up custom alerts to address specific needs in your environment.
Azure Sentinel is a cloud-native Security Information and Event Management (SIEM) and Security Orchestration, Automation and Response (SOAR) solution. Azure Sentinel’s role is to ingest data from different data sources and perform data correlation across these data sources. On top of that, Azure Sentinel leverages intelligent security analytics and threat intelligence to help with alert detection, threat visibility, proactive hunting, and threat response.
When Azure Defender detects/triggers alerts, you can stream these alerts to your own SIEM solution. By doing this you can quickly view what needs your attention from one management interface and take an appropriate action.
In this blog, we will walk you through how alerts from Azure Defender integrates with Sentinel providing Sentinel with security recommendations, alerts, and analytics. When integrated together how they operate in a better together scenario.
Integration
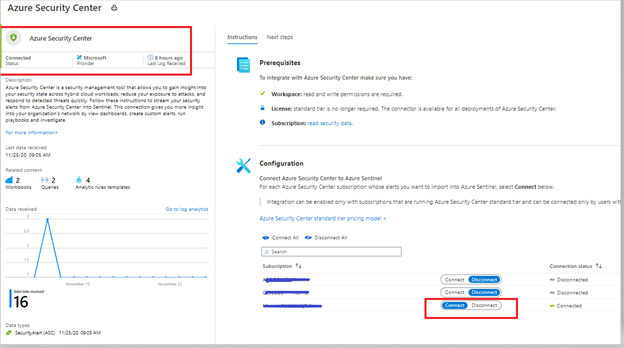
Azure Sentinel leverages data connectors which give you that holistic rich view across multiple data sources. To stream Azure Defender alerts in to Azure Sentinel, the first step is to configure this integration by adding Azure Security Center connector. You can connect to Azure Security Center data connector by following the steps from this article.
After following the steps from the article mentioned in the previous paragraph, you can confirm the connectivity (as shown in the figure below).
Image 1: Confirming the connectivity of Azure Security Center connector in Azure Sentinel
Investigating an Azure Defender alert in Azure Sentinel
In this example, we are analyzing an alert which is using Fusion analytics that automatically correlates alerts in the environment based on cyber kill-chain analysis to help better understand the full attack surface as to where it started and what kind of impact it had on the resources. To learn more about Cloud smart alert correlation (also known as fusion), please read our documentation here.
 Image 2: Security Center Alerts page
 Image 3: Fusion Analytics correlation
As you notice in image 3, Fusion technology has correlated different severity alerts and contextual signals together.
The left pane of the security incident page shows high-level information about the security incident like, alert description, severity, activity time and affected resources. The right pane of security incident page contains information about the Alerts and their description.
 Image 4: Take action Tab of Azure Security Center
Switch to the Take Action tab (as shown in Image 4) to know more information on how to Mitigate the threat, review the related recommendations identified on this affected resource under prevent future attacks.
Trigger automated response option will provide you the option to trigger a Logic App as a response to this security alert. Setting up an automation reduces overhead and helps you take care of incidents automatically and quickly. Review our Github repository to find different automation artifacts that you can leverage to resolve the alerts or recommendations in Security Center.
Suppress similar alerts option gives you an option to suppress future alerts with similar characteristics if alert isn’t relevant for your organization. Please review this article to understand how you can benefit from this feature.
To further investigate this alert, let’s navigate to Azure Sentinel. One of the benefits of triaging incidents in Azure Sentinel is that you can start from a holistic high-level view and zoom in on relationships, often found in related entities or notable events. Azure Sentinel helps you in identifying and correlating those in a couple of ways. In addition, Azure Sentinel offers powerful hunting capabilities to find that needle in the haystack.
In this blogpost, we will provide a couple of examples of those options.
Triaging the Azure Defender incident in Azure Sentinel
When we pivot over the Azure Sentinel, we can see the same incidents appearing in our triage view:
 Image 5: Incidents pane of Azure Sentinel
Looking at the details of our incident, we can see the affected entities and can start our investigations from there, or we can pivot over to the sending source, in our case Azure Security Center:

When we look more closer, we quickly see that more sources are reporting suspicious activities related to our affected entities, which we need to investigate:
 Image 6: Example of Open incidents from Azure Sentinel
We can run investigations in several ways, one is a visual investigation:
Zooming in on our suspicious entity, our server, we can see a lot more to investigate, including a timeline of events:
 Image 8: Timelines of events
This is a clear signal that this is a true positive which we should be escalating for further investigation. We can add our findings to the incident comment section and take a couple of counter measures to isolate our servers by leveraging a block IP action which we have discovered as being a malicious IP address. You can find the Logic App playbook here. This playbook has been authored to block a brute force attack IP address, but can also be used to block any IP address.
In our investigation we also saw that an Azure Active Directory user was affected:
 Image 9: Azure Active Directory user that was affected
The second preventive counter measure we will take is to confirm that this is a risky user, by leveraging a confirm risky user playbook and reset the user’s password.
Before we escalate the incident to our investigations team, we create a ticket in ServiceNow, add our findings to the incident comments and continue our triage.
A usual question we receive at this point is, “When I use the Azure Security Center data connector in Azure Sentinel and generate Incidents, what happens when I close my Azure Sentinel Incident, does it close the related Azure Security Center alert?”
The short of this is it does not. The Azure Sentinel Incident closes, but the ASC Alert remains active. Some customers prefer to keep the alerts active in ASC, while they are closing the incident in Azure Sentinel and some of our customers prefer to close the incident or alerts at both ends. You also have the option to suppress the ASC Alert manually in the ASC Portal. If the outcome of your incident triage is complete and you decide to close the incident in Azure Sentinel, you can use and invoke this Logic App Playbook which will close the incident in Azure Sentinel and dismisses the alert in Azure Security Center. This article describes how to run a Logic App Playbook. Azure Sentinel also allows you to invoke a Logic App Playbook automatically upon creation of an incident, which is described here.
Hope you enjoyed learning our better together story of Azure Security Center and Azure Sentinel.
Acknowledgements
This blog was written in collaboration with my super talented colleague Tiander Turpijn, Senior Program Manager and reviewed by the God of Azure Security Center, Yuri Diogenes, Principal Program Manager
by Contributed | Dec 14, 2020 | Technology
This article is contributed. See the original author and article here.
Earlier in fall 2020, we were pleased to announce that Surface Pro X users and others with Windows ARM 64 devices could download Microsoft Teams for ARM64. And although the Teams client is not yet available via Microsoft 365 Enterprise channels, there’s a command line tool that provides a temporary workaround for commercial customers who want to deploy the ARM64 client across their organization.
And you can still deploy the Teams ARM64 client as a Win32 application package using the Intune Management Extension, which also supports ARM64 application deployments.
Until the ARM64 Microsoft Teams client is available via the Microsoft 365 Enterprise channel, we wanted to provide some steps to help you deliver the client using Microsoft Intune, part of Microsoft Endpoint Manager.
- Begin by reviewing the following documentation: Install Microsoft Teams using Microsoft Endpoint Configuration Manager, which includes guidance for x86 and x64 platforms.
- Download the Win32 Content prep tool for Intune. Yes, even though it is called Win32, this versatile command line tool can also be used for ARM64 packages.
- Download the Microsoft Teams ARM64 installer.
- Follow these instructions for wrapping and packaging the installer.
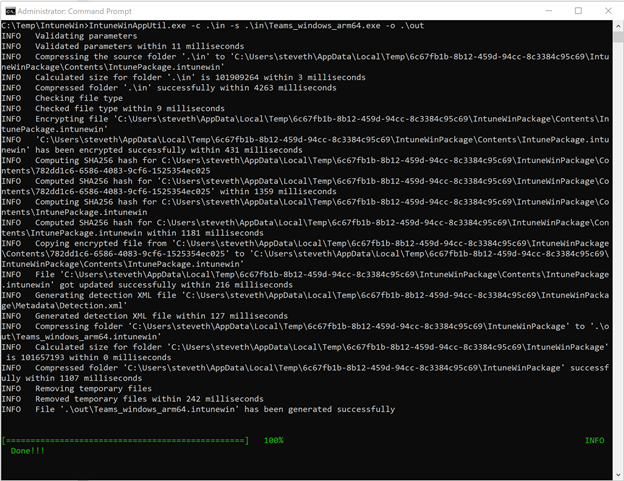
- When you run the Win32 Content prep tool, you can follow the prompts to enter required parameters or choose from other available parameters if needed. Here’s an example:
- Once the .IntuneWin package has been created, you can upload the application package into your Intune tenant and deploy it as a Win32 application package. Refer to the following documentation for the processes and steps: Add, assign, and monitor a Win32 app in Microsoft Intune.
Special thanks to Steve Thomas in our Commercial Management & Experiences Group for helping us out with these steps.
by Contributed | Dec 14, 2020 | Technology
This article is contributed. See the original author and article here.
Databases are essential workers in nearly all applications. They form the bedrock of a data architecture—handling transactions, record-keeping, data manipulation, and other crucial tasks on which modern apps rely. But for as long as databases have existed, people have looked for ways to speed them up. With databases so central to data architecture, even small reductions in throughput or latency performance can cause ripple effects that make the rest of the application sluggish and create a disappointing user experience. And there are financial repercussions too—one study found that the probability of a web site visitor bouncing rose by 90% if the page load time increased from one second to five seconds. This problem will likely become even more pronounced as web and mobile traffic increase. The solution isn’t always simple—scaling up databases can be expensive, and may not solve throughput or latency issues.
Caching Can Improve Application Performance
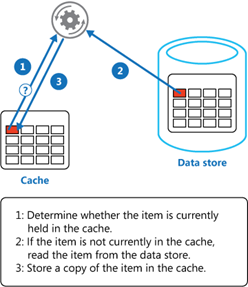
One way you can improve the performance of your data architecture is by implementing caching. In common setups like a cache-aside architecture, the most used data is stored in a fast and easy-to-access cache. When a user requests data, the cache is checked first before querying a database.
Combined with a relational database, a cache can store the most common database queries and return these queries much faster than the database when the application requests them. Not only can this result in significant reductions in latency, but it also reduces the load on the database, lowering the need to overprovision. Additionally, caches are typically better than databases at handling a high throughput of requests—enabling the application to handle more simultaneous users.
Caches are typically most beneficial for read-heavy workloads where the same data is being accessed again and again. Caching pricing, inventory, session state, or financial data are some examples of common use-cases. It’s important to note that caching won’t speed up operations internal to a database (like joins). Instead, caching lessens the need for those operations to occur by returning the results of a query before it reaches the database.
Redis Cache
Redis is one of the most popular caching solutions in the market. It is a key-value datastore that runs in-memory, rather than on disk like most databases. Running in-memory makes it lightning-fast, and a terrific complement to more deliberate and consistent primary databases like Azure SQL Database or PostgreSQL. Redis is available as a fully-managed service on Azure through Azure Cache for Redis, offering automatic patching and updates, high-availability deployment options, and the latest Redis features. Azure Cache for Redis can neatly plug into your Azure data infrastructure as a cache, allowing you to boost data performance. But by how much? We decided to put it to the test.
Performance Benchmark Test
To measure the performance boost from using Redis in conjunction with a database, we turned to GigaOm to run benchmarks on the performance of Azure SQL Database with and without caching. Azure SQL Database is a good point of reference—it’s a highly advanced and full-featured database that is heavily utilized by the most demanding customers. While it already has great price-performance, adding Redis can help accelerate that performance from great to outstanding. To measure this, GigaOm created a sample application based on a real-world example: users viewing inventory on an e-commerce site and placing items into their shopping cart. This test was designed to be realistic while also featuring the benefits of caching. It was run twice: once with just Azure SQL Database handling the inventory and shopping cart data, and once with Azure SQL Database plus Azure Cache for Redis.

Azure App Service was used to host the sample application, and JMeter was used to provide simulated traffic. For each test, additional simultaneous users were periodically added until the database or cache returned errors. GigaOm looked at two performance metrics: throughput and latency.
Throughput Performance Increased by over 800%
Throughput is a measurement of how much traffic the application can handle simultaneously. High throughput capability is essential to businesses that handle a lot of users or data—especially if demand tends to spike periodically. Azure Cache for Redis can handle millions of simultaneous requests with virtually no slowdown, making it highly suited for enhancing throughput performance. The test results showed this clearly:
 Source: GigaOm
Scaling up Azure SQL Database from 8 vCores to 32 vCores produced a 50% increase in throughput performance. While this is useful, adding additional vCores has limited impact on IOPS performance which was the bottleneck factor here. Adding a cache was even more effective: maximum throughput was over 800% higher with Azure Cache for Redis, even when using a smaller database instance (2 vCores vs 8 vCores). That means more users, higher scalability, and better peak traffic performance—all without changing the core database infrastructure. Plus, scaling throughput with Azure Cache for Redis is typically much cheaper than scaling up the database.
Latency Performance Improved by Over 1000%
Latency measures the time duration between when a request for data is sent by the application and received from the database. The lower the latency, the snappier the user experience and the faster data is returned. Azure Cache for Redis is particularly effective at operating with low latency because it runs in-memory. The benchmarking demonstrated this strongly:
 Source: GigaOm
Latency is typically measured at the 95th percentile level or above because delays tend to stack up. This is the “drive-thru” effect. If an order in front of you takes ten minutes, you do not care if your order takes only a few seconds—you had to wait for their order to be completed first! In our test, adding Azure Cache for Redis decreased the 95th percentile latency from over 3s down to 271ms—over a 1000% improvement. At the 99th and 99.9th percentile levels, the difference was even greater. Lower latency means faster applications and happier users, and Azure Cache for Redis is a great way for you to achieve the latency you need.
Try Azure Cache for Redis Today
Azure SQL Database is already a great database with excellent price-performance. Coupled with Azure Cache for Redis, this price-performance edge is amplified even further with a powerful solution for accelerating the throughput and latency performance of your database. Even better, Azure Cache for Redis fits into your existing data architecture and can often be bolted on without requiring huge application changes. Read the full benchmarking report, explore our free online training, and access our documentation to learn more.
Performance claims based on data from a study commissioned by Microsoft and conducted by GigaOm in October 2020. The study compared the performance of a test application using an Azure database with and without implementing Azure Cache for Redis as a caching solution. Azure SQL Database and Azure Database for PostgreSQL were used as the database element in the study. A 2 vCore Gen 5 General Purpose instance of Azure SQL Database and a 2 vCore General Purpose instance of Azure Database for PostgreSQL were used with a 6 GB P1 Premium instance of Azure for Redis. These results were compared with 8, 16, 24, and 32 vCore Gen 5 General Purpose instances of Azure SQL Database and 8, 16, 24, and 32 vCore General Purpose instances of Azure Database for PostgreSQL without Azure Cache for Redis. The benchmark data is taken from the GigaOm Web Application Database Load Test which simulates a common web application and backend database barraged by increasing HTTP requests. Actual results may vary based on configuration and region.
by Contributed | Dec 14, 2020 | Technology
This article is contributed. See the original author and article here.
Databases are essential workers in nearly all applications. They form the bedrock of a data architecture—handling transactions, record-keeping, data manipulation, and other crucial tasks on which modern apps rely. But for as long as databases have existed, people have looked for ways to speed them up. With databases so central to data architecture, even small reductions in throughput or latency performance can cause ripple effects that make the rest of the application sluggish and create a disappointing user experience. And there are financial repercussions too—one study found that the probability of a web site visitor bouncing rose by 90% if the page load time increased from one second to five seconds. This problem will likely become even more pronounced as web and mobile traffic increase. The solution isn’t always simple—scaling up databases can be expensive, and may not solve throughput or latency issues.
Caching Can Improve Application Performance
One way you can improve the performance of your data architecture is by implementing caching. In common setups like a cache-aside architecture, the most used data is stored in a fast and easy-to-access cache. When a user requests data, the cache is checked first before querying a database.
Combined with a relational database, a cache can store the most common database queries and return these queries much faster than the database when the application requests them. Not only can this result in significant reductions in latency, but it also reduces the load on the database, lowering the need to overprovision. Additionally, caches are typically better than databases at handling a high throughput of requests—enabling the application to handle more simultaneous users.
Caches are typically most beneficial for read-heavy workloads where the same data is being accessed again and again. Caching pricing, inventory, session state, or financial data are some examples of common use-cases. It’s important to note that caching won’t speed up operations internal to a database (like joins). Instead, caching lessens the need for those operations to occur by returning the results of a query before it reaches the database.
Redis Cache
Redis is one of the most popular caching solutions in the market. It is a key-value datastore that runs in-memory, rather than on disk like most databases. Running in-memory makes it lightning-fast, and a terrific complement to more deliberate and consistent primary databases like Azure SQL Database or PostgreSQL. Redis is available as a fully-managed service on Azure through Azure Cache for Redis, offering automatic patching and updates, high-availability deployment options, and the latest Redis features. Azure Cache for Redis can neatly plug into your Azure data infrastructure as a cache, allowing you to boost data performance. But by how much? We decided to put it to the test.
Performance Benchmark Test
To measure the performance boost from using Redis in conjunction with a database, we turned to GigaOm to run benchmarks on the performance of Azure SQL Database with and without caching. Azure SQL Database is a good point of reference—it’s a highly advanced and full-featured database that is heavily utilized by the most demanding customers. While it already has great price-performance, adding Redis can help accelerate that performance from great to outstanding. To measure this, GigaOm created a sample application based on a real-world example: users viewing inventory on an e-commerce site and placing items into their shopping cart. This test was designed to be realistic while also featuring the benefits of caching. It was run twice: once with just Azure SQL Database handling the inventory and shopping cart data, and once with Azure SQL Database plus Azure Cache for Redis.
Azure App Service was used to host the sample application, and JMeter was used to provide simulated traffic. For each test, additional simultaneous users were periodically added until the database or cache returned errors. GigaOm looked at two performance metrics: throughput and latency.
Throughput Performance Increased by over 800%
Throughput is a measurement of how much traffic the application can handle simultaneously. High throughput capability is essential to businesses that handle a lot of users or data—especially if demand tends to spike periodically. Azure Cache for Redis can handle millions of simultaneous requests with virtually no slowdown, making it highly suited for enhancing throughput performance. The test results showed this clearly:
Source: GigaOm
Scaling up Azure SQL Database from 8 vCores to 32 vCores produced a 50% increase in throughput performance. While this is useful, adding additional vCores has limited impact on IOPS performance which was the bottleneck factor here. Adding a cache was even more effective: maximum throughput was over 800% higher with Azure Cache for Redis, even when using a smaller database instance (2 vCores vs 8 vCores). That means more users, higher scalability, and better peak traffic performance—all without changing the core database infrastructure. Plus, scaling throughput with Azure Cache for Redis is typically much cheaper than scaling up the database.
Latency Performance Improved by Over 1000%
Latency measures the time duration between when a request for data is sent by the application and received from the database. The lower the latency, the snappier the user experience and the faster data is returned. Azure Cache for Redis is particularly effective at operating with low latency because it runs in-memory. The benchmarking demonstrated this strongly:
Source: GigaOm
Latency is typically measured at the 95th percentile level or above because delays tend to stack up. This is the “drive-thru” effect. If an order in front of you takes ten minutes, you do not care if your order takes only a few seconds—you had to wait for their order to be completed first! In our test, adding Azure Cache for Redis decreased the 95th percentile latency from over 3s down to 271ms—over a 1000% improvement. At the 99th and 99.9th percentile levels, the difference was even greater. Lower latency means faster applications and happier users, and Azure Cache for Redis is a great way for you to achieve the latency you need.
Try Azure Cache for Redis Today
Azure SQL Database is already a great database with excellent price-performance. Coupled with Azure Cache for Redis, this price-performance edge is amplified even further with a powerful solution for accelerating the throughput and latency performance of your database. Even better, Azure Cache for Redis fits into your existing data architecture and can often be bolted on without requiring huge application changes. Read the full benchmarking report, explore our free online training, and access our documentation to learn more.
Performance claims based on data from a study commissioned by Microsoft and conducted by GigaOm in October 2020. The study compared the performance of a test application using an Azure database with and without implementing Azure Cache for Redis as a caching solution. Azure SQL Database and Azure Database for PostgreSQL were used as the database element in the study. A 2 vCore Gen 5 General Purpose instance of Azure SQL Database and a 2 vCore General Purpose instance of Azure Database for PostgreSQL were used with a 6 GB P1 Premium instance of Azure for Redis. These results were compared with 8, 16, 24, and 32 vCore Gen 5 General Purpose instances of Azure SQL Database and 8, 16, 24, and 32 vCore General Purpose instances of Azure Database for PostgreSQL without Azure Cache for Redis. The benchmark data is taken from the GigaOm Web Application Database Load Test which simulates a common web application and backend database barraged by increasing HTTP requests. Actual results may vary based on configuration and region.
by Contributed | Dec 14, 2020 | Technology
This article is contributed. See the original author and article here.
Claire Bonaci On this episode, I welcome Kelly Robke and Toni Thomas, the newest members through our Microsoft health and life sciences industry team. Toni is our US chief patient experience officer. And Kelly is our US chief nursing officer, both women bring an extensive clinical background, as well as innovative ideas on how to transform care delivery and transform healthcare. Hi, Toni, welcome to the podcast. And welcome to Microsoft.
Toni Thomas
Hello, Claire. Thank you for having me on the podcast. And I’m very excited to be at Microsoft and be the first chief patient experience officer.
Claire Bonaci
Yeah, no, that leads me in my first question, you are the first chief patient experience officer that we have ever had at Microsoft, do you mind telling our listeners just a little bit more about yourself?
Toni Thomas
Sure. So just a little background on myself, I actually grew up in a very small rural community in Northwest Ohio. And I always loved solving problems helping people. I loved science. And so especially like biology, anatomy and physiology, and that led me to choose nursing as a career path, as you know how I wanted to get my education. So Blanton finished my first I started at a community college, so I could actually get a two year degree in nursing. And then went on and finished my bachelor’s degree. And then got a master’s degree as I was working. But right after nursing school, I went out and worked in pediatric ICU. And I’m actually still in touch with the same nurse manager that hired me. So we still talk. I spent 17 years in pediatric ICU. And I really have a passion for children and families and ICU care, it’s critical care is something that really, I think it takes a unique type of person to work in a critical care environment. But I’m an adrenaline junkie. And it’s definitely adrenaline for 12 hours a day. But that environment actually is very rich with technology, a lot of machines, a lot of data. So that’s really kind of what got me on the path that led me into healthcare it. And then on another personal note, I’ve been married for 29 years. And my husband Michael is not in health care. And he’s not in technology, which is good. And we have two grown adult daughters.
Claire Bonaci
And why did you make the move to a tech company from the bedside? Was there anything that you saw that you felt, okay, I can be making a bigger difference or this needs to be changed that you wanted to make that way?
Toni Thomas
Yeah, it was always just that constant curiosity. And I will say, you know, for those 17 years in pediatric ICU, I specialized in pediatric cardiothoracic surgery, so children with congenital heart disease, and that the last part of my clinical career, I was working about 100 hours a week, I was the lead nurse practitioner on the cardiothoracic surgery service for pediatrics. So I really, I managed the team, I work side by side with the surgeon in the OR, as well as in the ICU. So number one, I was working a lot of hours. And it is an area in the specialty where there’s a high emotional burnout. But part of the job was also really being part of committees that were looking at or selecting different technologies or software. So I was always that nurse, even at the beginning of my career, I was always that nurse was really interested in the technical or technology aspects of nursing, especially kind of thinking to myself, we’re using all these tools. And there’s data like we’re putting information in, where is the information going, and how is it going to help us and help our patients. So there was a there was a critical moment in my career where I was like, okay, I’m either going to go back to school to get a PhD, or even thought about becoming a nurse anesthetist. And then I was like, You know what, like, do I really want to go back to school? My kids are like approaching junior high. Do I really want to go back to school and make that commitment or do I just want to try to go out and get into the healthcare IT side of things. So I decided to take the health care it route. And I’m now 12, almost 13 years into it. And I love every minute of it, I I still practice nursing, I have all of this rich experience in patient experience and patient engagement. And I now get to help 1000s of people at a time. And that really is what gets me excited every morning when I wake up.
Claire Bonaci
Yeah, I love that you mentioned the scale of that, that really, we can scale up. And that is the most exciting part. Really, I believe that as well. And do you mind touching a little bit more on your patient experience or clinician experience background? And you mentioned it briefly?
Toni Thomas
Sure. So, um, you know, at the bedside, you’re, you’re when you’re a bedside nurse, you’re always about patients and families so that you’re just treating the patient. And since so much of patient experience has to do with the clinicians experience. So there’s that that piece of it that actual hands on experience, that dealing with patients and families that dealing with your colleagues and how do we make? How do we do our work, not just to provide the clinical or the care that’s needed for the patients, the patient care side of it, but how do we make their day better? in all aspects? And then, you know, as you get out into healthcare it and you see that you’re touching 1000s of people at a time, and there’s a lot of power in that there’s good power in that. So your mind is always turning on how do you design solutions for the healthcare systems to solve these critical problems around patient care and their their business problems? And how do you help them provide value to patients and value to families. And then prior to coming to Microsoft, I was at a company that’s actually a Microsoft partner, a company that provides in patient bedside digital technologies. So it’s all about the patient experience. It’s all about engaging the patients and the families and empowering them with data. So a lot of it is about manageable consumable data and how how that is democratized for the patients, how we provide education, and then also the consumer aspects of healthcare delivery. So this is one area that I’m really passionate about. Healthcare is always going to be healthcare, and it’s going to be that niche market. And there is that aspect of seriousness about you know, you are helping someone at the most vulnerable time in their lives. So we all understand that however, patients are consumers, and they come to the experience expecting some of those consumer aspects. And I feel strongly about helping healthcare systems be able to provide that for patients. And I think with Microsoft, you know, and what we’re doing here, there’s never been a better time to do that, especially during this period, that we’re in this unprecedented time of a global pandemic, where healthcare has really been rapidly forced to implement significant changes. And a lot of those changes are very consumer centric.
Claire Bonaci
That’s very true. I love that your background is very extensive. You have all of those experiences to pull from whether that’s bedside or your work at a partner company. What are you most excited about? I know you’re only a few weeks in at Microsoft so far, but what are you looking forward to or most excited about?
Toni Thomas
Well, first of all, let me tell you, it is so exciting to be a part of Microsoft. I’ve actually been a fan girl for a very, very long time. Um, I am a huge fan of Bill Gates. And historically, the company if you think about it, it’s American company and it it changed the world. And so to be able to be a part of that legacy with now with what Satya Nadella is doing here and the culture. And you know how Microsoft has always been a part of healthcare, but now we’re really focused and driven on how we’re going to provide a more longitudinal longitudinal experience in the form of the Microsoft Cloud for healthcare. So that’s, that’s exciting. Being the first chief patient experience officer is very exciting. It also bears great responsibility, I’m, I’m ready for it. I’m excited to be able to educate and inform the colleagues that are going out and evangelizing Microsoft, as well as our healthcare customers and our plans. On another note, I’m really excited about the potential that the pandemic is bringing, I know that sounds really strange. But I always look at opportunity as the upside to something so disruptive, and we’re in a very disruptive period. So the ability to have patients be able to have access to digital health tools on a scale that we’ve not seen before, specifically around virtual visits. I really know artificial intelligence is turned into a buzzword. But the opportunity that AI can bring for good especially not just around for patients and families, but also for clinicians, because we need to do a better job of helping our clinicians have a better day when they go to work. We all know what the nursing profession is going through right now. And I think that, you know, machine learning and AI can help take some of those, the task burden off of their plate and allow them to really focus on the knowledge capital that they have, which is all of their education, and their experience, and how they can use that to treat their patients and spend more time with their patients, versus checking boxes, documenting and, you know, running around doing tasks. So those things really, really excite me.
Claire Bonaci
That’s great. I’m so excited to have you on the team. I’m excited to work more closely with you and to see what happens in the future.
Toni Thomas
Thank you so much for having me and have a great day.
Claire Bonaci
Hi, Kelly, welcome to the podcast.
Kelly Robke
Hi. Glad to be here. Thanks for having me, Claire.
Claire Bonaci
So Kelly, you are brand new to Microsoft, and you are our new chief nursing officer, do you mind telling us a little bit about yourself and your background? Sure.
Kelly Robke
So I have been a registered nurse for 30 years. My nursing career is a little bit unique. I have had clinical practice experience. But I’ve really focused on areas of improving patient population health through innovation and technology. I started off my career working in labor and delivery. With high risk infants in I worked at Piedmont hospital and Memorial Hermann in Houston, Texas. But what’s really cool about that clinical experience is you’re taking care of two patients, the mom and the baby. But you’re having a lot of opportunity to work with not only the EMR, but also the electronic devices that help monitor the vital signs of both mom and baby as well as get some opportunities to work with really cool stuff in the OR, versus cesarian sections. And I also around that time started working in clinical research and through clinical research was really exposed to data and the relevance of data and how important evidence is in helping to drive improvements in care. And I think part of innovation when you talk about health care and improving the quality of care delivery has to involve a conversation around not only how you introduce it, but what the environment looks like as well. And also if you are implementing in a way that really makes it meaningful and beneficial, not only to the patients, but also to the folks that use the the technology in that space. Beyond care delivery. I’ve worked in the CIOs office at MD Anderson Cancer Center, helping the clinicians at one of the largest cancer institutions in the country adopt and utilize technology to the benefit of their patients also worked at a number of technology companies. And most recently, at BD, I helped to bring pyxis enterprise to market. So I’m looking forward to continuing these endeavors with the team at Microsoft.
Claire Bonaci
Yeah, you have a very extensive background, what made you jump from being bedside and really being with the patients to more of that data side more focused on the analytics and really focusing on innovation?
Kelly Robke
Yeah, I think there is so much meaningful benefit to caring for patients and their families, for individuals or patient populations. But there’s something super exciting about being able to influence and impact positive change in healthcare, when you’re talking about groups of people in a certain specialty area, or even around the world. And I think anything you do has to be informed by evidence. There’s also the experience of clinical practice. But it’s super exciting to be involved in this endeavor this these days simply in that there are many different sources of data. And we focus on the inpatient care model, because that’s where the most critical care is delivered, and organize to structure, health. But as we continue in healthcare transformation and efforts to achieve the quadruple aim, we’re really looking outside the four walls of the hospital. And it’s super exciting because care strategies and workflows are different if you’re looking at outpatient settings, procedural settings, but now, particularly in the time we’re in with the pandemic, we really need to focus on other areas where healthcare is consumed, such as retail clinics, such as public health entities, and it’s super excited to be a part of that, and also how data is gathered, interpreted and applied towards change in healthcare.
Claire Bonaci
That’s great. And I love that you do bring up kind of that shift towards making this scalable and really making this more of a larger impact. So you obviously made that big move from a med device company to a tech technology company. What do you hope to accomplish with this move? I guess, what are your your dreams? And what are your goals, either short term or long term
Kelly Robke
Sure, I’m excited to work with the folks, providing health care, both from a provider standpoint from the clinical investigators. And that’s an entire community, as well as the systems that are providing health. Like I just mentioned, I’m excited to be a part of the team that’s really driving the use of analytics, whether it’s descriptive, predictive to help address some common challenges and some formidable challenges were experiencing out in health, not just from the pandemic, but how we can improve the care delivered to chronic condition patients who may have individual needs that can can significantly impact the quadruple aim, again, in terms of cost and quality, but also in improving the health along the continuum of patient populations. How can we make sure that folks are doing preventative activities are able to stay in their home while they’re recovering, in a way that’s both meaningful and beneficial to global health and working with partners to achieve that goal. And also, the team here at Microsoft is is really something I’m looking forward to and proud to be a part of.
Claire Bonaci
Great. Well, I am so happy that you’re on the team. I’m really looking forward to working with you more. And one quick last question for you that you want to share that our listeners probably don’t know about you something fun something and just to get to know you a little bit better.
Kelly Robke
Sure I love to golf, you can find me on a golf course, most weekends. I also like to cycle in races that raise money for charity. So there are several races that I compete in. And you might see me on the road if I’m not on the golf course sometime.
Claire Bonaci
That is great. Thank you so much for being on the podcast and I’m looking forward to having you back next time.
Kelly Robke
Thank you.
Claire Bonaci
Thank you all for watching. Please feel free to leave us questions or comments below and check back soon for more content from the HLS industry team.
Follow Kelly and Toni on LinkedIn

Recent Comments