
by Contributed | Jun 2, 2021 | Dynamics 365, Microsoft 365, Technology
This article is contributed. See the original author and article here.
Companies need accurate sales forecasts to keep on track to meet quarterly and annual revenue goals.
In Dynamics 365 Sales 2021 release wave 1, sellers can now clone an existing forecast when they need to make edits, and gain immediate clarity on revenue scenarios. The existing forecast remains intact while you configure different scenarios quickly and seamlessly.
This enhancement helps you plan for upcoming periods, when a few simple tweaks to the scheduling timeframe in an existing forecast will give you the insights you need.
Cloning not only eliminates repetitive data entry, but it also helps prevent forecasting errors.
With forecast cloning, these capabilities are now available:
- Change the rollup and hierarch entities and their relationship.
- Change the top of the hierarchy.
- Change the timeframe of a forecast.
- Change the hierarchy entity and user lookup field that defines who can access each record of the forecast.
- Change a forecast category option set, add columns, or modify columns.
- Add or modify filters that limit the data which drives the forecast.
For more information, read how to bring predictability to your revenue pipeline.
Next steps
The post Save time by cloning sales forecasts in Dynamics 365 Sales appeared first on Microsoft Dynamics 365 Blog.
Brought to you by Dr. Ware, Microsoft Office 365 Silver Partner, Charleston SC.

by Scott Muniz | Jun 2, 2021 | Security
This article was originally posted by the FTC. See the original article here.
As part of the American Rescue Plan Act, eligible families will get monthly payments from the government from July 15 through December 2021. The Internal Revenue Service (IRS) will send these monthly payments directly to people through direct deposit, paper checks, or debit cards. Unlike economic impact payments, these payments are an advance on families’ child tax credit. People who are eligible will get up to half of their child tax credit in these monthly payments and the other half when they file their 2021 taxes.
If you qualify for payments — which depends, in part, on how much you make — you’ll get them on about the 15th of each month, automatically, without having to do anything. The IRS is working to get online systems set up on its webpage and make sure all questions get answered. Go to IRS.gov for the latest info on who qualifies, how much you’ll get, and how to address any problems you might run into.
When money from the government is in the news, we know scammers are about to run their standard playbook. They may call, email, text, or DM you. They’ll say they can help you get your payments earlier (they can’t), get you more money (also no), or tell you other lies (for sure). Here’s the real deal:
- Only the IRS will be sending these payments. Anyone trying to “help” you get your child tax credit is really after your money.
- The government will NEVER call, text, email, or DM you out of the blue, asking for money or information. Keep your money — and your Social Security, bank account, debit and credit card numbers — to yourself.
- Nobody legit will ever demand that you pay by gift card, wire transfer through companies like Money Gram or Western Union, or cryptocurrency. That’s a scam, every time.
If someone tries to scam you out of these payments or anything else, report it to the FTC at ReportFraud.ftc.gov.
Brought to you by Dr. Ware, Microsoft Office 365 Silver Partner, Charleston SC.
by Scott Muniz | Jun 2, 2021 | Security, Technology
This article is contributed. See the original author and article here.
As part of an effort to encourage a common language in threat actor analysis, CISA has released Best Practices for MITRE ATT&CK® Mapping. The guide shows analysts—through instructions and examples—how to map adversary behavior to the MITRE ATT&CK framework. CISA created this guide in partnership with the Homeland Security Systems Engineering and Development Institute™ (HSSEDI), a DHS-owned R&D center operated by MITRE, which worked with the MITRE ATT&CK team.
CISA and other organizations in the cybersecurity community use MITRE ATT&CK to identify and analyze threat actor behavior. This analysis enables them to produce a set of mappings to develop adversary profiles; conduct activity trend analyses; and detect, respond to, and mitigate threats. An increase in the number of organizations integrating the ATT&CK framework in their analysis will have a positive impact on the efficiency and efficacy of information sharing within the community.
CISA, HSSEDI, and MITRE ATT&CK encourage users and administrators to review both the guide—as well as CISA Executive Assistant Director Eric Goldstein’s blog post on the guide—to strengthen the security posture of their organization and improve information sharing.

by Scott Muniz | Jun 2, 2021 | Security
This article was originally posted by the FTC. See the original article here.
The things we do throughout the course of our day give businesses access to information about our habits, tastes, and activities. Some might use it to deliver targeted ads to you, or to give you content based on your location, like stores nearby or the weather forecast. Others might sell or share that information.
Whether you use a computer, tablet, or mobile phone to go online, there are things you can do to protect your privacy. Check out ftc.gov/yourprivacy, your guide to protecting your privacy online. Here’s what it covers:
Online Tracking
Learn how online tracking works and what you can do about it. Plus:
- How to change your privacy settings on your browser, your internet-connected TV, and your phone
- How to opt out of target ads
- What to know about ad blockers
- How to opt out of data broker sites that sell your personal information
- What to know about privacy and mobile apps
How To Secure Your Devices
Find out how to secure your internet-connected devices, starting with your router — it’s the key to privacy at home and in your small business. Plus:
- How to know when your voice assistant is listening and ways to protect your privacy
- Important security features for smartwatches
- Using internet-connected (IP) cameras safely
- Why it’s important to remove your personal data before you sell your car
- What to do if you’re selling a home and leaving behind a smart thermostat, refrigerator, or other device
What To Know About Online Abuse and Harassment
Did you know some apps let people track you through your phone without your permission? Learn about stalking apps, how to tell if there is one on your phone, and what to do if there is.
If someone took or shared an intimate image of you without your consent, that’s considered non-consensual pornography. And that’s not OK. If that’s happened to you or someone you know, learn what steps you can take.

Brought to you by Dr. Ware, Microsoft Office 365 Silver Partner, Charleston SC.
by Scott Muniz | Jun 2, 2021 | Security, Technology
This article is contributed. See the original author and article here.
Mozilla has released security updates to address vulnerabilities in Firefox and Firefox ESR. An attacker could exploit some of these vulnerabilities to take control of an affected system.
CISA encourages users and administrators to review the Mozilla Security Advisory for Firefox 89 and Firefox ESR 78.11 and apply the necessary updates.
by Scott Muniz | Jun 2, 2021 | Security, Technology
This article is contributed. See the original author and article here.
Cisco has released security updates to address a vulnerability in multiple Cisco products. An attacker could exploit this vulnerability to take control of an affected system.
CISA encourages users and administrators to review the following Cisco advisory and apply the necessary updates:
by Contributed | Jun 1, 2021 | Technology
This article is contributed. See the original author and article here.
The product submissions must be tested using the Hardware Lab Kit (HLK) for Windows Server 2022 hardware and software testing. The kit is available at the Partner Center for Windows Hardware, https://docs.microsoft.com/en-us/windows-hardware/test/hlk/.
For information on how to make a submission, see https://docs.microsoft.com/en-us/windows-hardware/drivers/dashboard
Vendors may download the Windows Server 2022 Eval version of the operating system for testing purposes here, https://www.microsoft.com/en-us/evalcenter/evaluate-windows-server-2022-preview
Vendors may also download the Virtual Hardware Lab Kit (VHLK) here, https://docs.microsoft.com/en-us/windows-hardware/test/hlk/ . The VHLK is a complete pre-configured HLK test server on a Virtual Hard Disk (VHD). The VHLK VHD can be deployed and booted as a Virtual Machine (VM) with no installation or configuration of the HLK required.
The playlist for testing Windows Server 2022 hardware and software may also be downloaded at that location. For Windows Server 2022, the release playlist has been consolidated for both X64 and ARM64 architecture. The Playlist may be updated in the future, so it is best to check for new versions regularly.
Preview versions of the OS and HLK cannot be used for certification testing of products for Windows Server 2022.
Previous versions of the HLK to be used for testing previous Windows Server versions will continue to be available in accord with the Microsoft Product Lifecycle guidance.
by Contributed | Jun 1, 2021 | Technology
This article is contributed. See the original author and article here.
Scenario:
With RA-GRS redundancy, you can read the data using secondary endpoint. The document points at connecting to Blob Storage using secondary endpoint and read data ahead.
Actions:
We will be making use of connection string to connect to the secondary endpoint and follow the below steps:
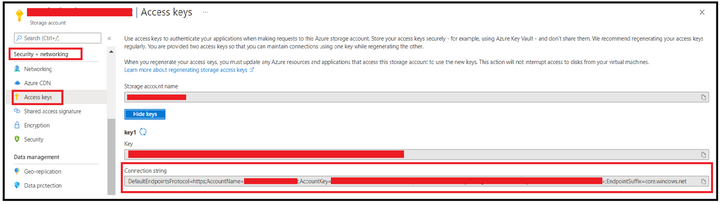
Step 1: Obtain the connection string.
We can obtain this from Azure Portal, from Access Keys section under Security & Networking Pane of Storage Account Blade.
Step 2: Editing connection string to use Secondary Endpoint.
Append the BlobEndpoint section pointing to secondary endpoint at the end of the connection string like the one given below:
DefaultEndpointsProtocol=https;AccountName=<StorageAccountName>;AccountKey=35tCZY3DXXXXXXXXXXXXXXXXXXXXXXXXXX==;EndpointSuffix=core.windows.net;BlobEndpoint=https://<StorageAccountName>–secondary.blob.core.windows.net
In case you want to leverage SAS, then you can edit the SAS URL to add secondary keyword after the account name and blob as endpoint. Below is one of the sample SAS URL:
https://<StorageAccountName>–secondary.blob.core.windows.net/?sv=2020-02-10&ss=bfqt&srt=sco&sp=rwdlacuptfx&se=2021-05-29T11:38:06Z&st=2021-05-29T03:38:06Z&spr=https&sig=XXXXXXXXXXXXXXXXXXXXXX
Step 3: Connecting to Storage Account using the connection string.
We will try connecting and accessing blobs using Azure Storage Explorer and via a powershell script. Let’s check for the process with first option.
When accessing via Azure Storage Explorer, you can follow the below steps of first selecting the resource type as Storage account.

Select the connection method as connection string and then provide the connection string created at step 2 along with the display name using which you want the connection to be displayed. Once done, click on the connect button.


At this point, the connection will get added under the Storage Accounts section of Local & Attached.
Step 4: Validations
To validate you are hitting the secondary endpoint only, you can configure fiddler as a proxy in the storage explorer and then try performing the operation of listing and reading (Get operation) while running the fiddler in the backend.

At the backend, you will see that you are hitting the secondary endpoint while trying to access the blobs.

In order to connect using Powershell, you can leverage below script to listing of the blobs inside a container.
$bMaxReturn = 100
$storageContext = New-AzStorageContext -ConnectionString “<String Generated at Step 2>”
do
{
# get a list of all of the blobs in the container
$listOfBlobs = Get-AzStorageBlob -Container “<Container Name>” -Context $storageContext -MaxCount $bMaxReturn -ContinuationToken $bToken
if($listOfBlobs.Length -le 0) { Break;}
foreach($blob in $listOfBlobs) {
write-host “Blob name:”
write-host $blob.Name
}
$bToken = $blob[$blob.Count -1].ContinuationToken;
}while ($bToken -ne $Null)
Disclaimer
By using the following materials or sample code you agree to be bound by the license terms below and the Microsoft Partner Program Agreement the terms of which are incorporated herein by this reference. These license terms are an agreement between Microsoft Corporation (or, if applicable based on where you are located, one of its affiliates) and you. Any materials (other than sample code) we provide to you are for your internal use only. Any sample code is provided for the purpose of illustration only and is not intended to be used in a production environment. We grant you a nonexclusive, royalty-free right to use and modify the sample code and to reproduce and distribute the object code form of the sample code, if you agree:
- to not use Microsoft’s name, logo, or trademarks to market your software product in which the sample code is embedded.
- (ii) to include a valid copyright notice on your software product in which the sample code is embedded.
- (iii) to provide on behalf of and for the benefit of your subcontractors a disclaimer of warranties, exclusion of liability for indirect and consequential damages and a reasonable limitation of liability; and
- (iv) to indemnify, hold harmless, and defend Microsoft, its affiliates and suppliers from and against any third-party claims or lawsuits, including attorney’s fees, that arise or result from the use or distribution of the sample code.”
For any information regarding data redundancy, you can check this link.
Hope this helps!
by Contributed | Jun 1, 2021 | Technology
This article is contributed. See the original author and article here.
The product submissions must be tested using the Hardware Lab Kit (HLK) for Windows Server 2022 hardware and software testing. The kit is available at the Partner Center for Windows Hardware, https://docs.microsoft.com/en-us/windows-hardware/test/hlk/.
For information on how to make a submission, see https://docs.microsoft.com/en-us/windows-hardware/drivers/dashboard
Vendors may download the Windows Server 2022 Eval version of the operating system for testing purposes here, https://www.microsoft.com/en-us/evalcenter/evaluate-windows-server-2022-preview
Vendors may also download the Virtual Hardware Lab Kit (VHLK) here, https://docs.microsoft.com/en-us/windows-hardware/test/hlk/. The VHLK is a complete pre-configured HLK test server on a Virtual Hard Disk (VHD). The VHLK VHD can be deployed and booted as a Virtual Machine (VM) with no installation or configuration of the HLK required.
The playlist for testing Windows Server 2022 hardware and software may also be downloaded at that location. For Windows Server 2022, the release playlist has been consolidated for both X64 and ARM64 architecture. The Playlist may be updated in the future, so it is best to check for new versions regularly.
Preview versions of the OS and HLK cannot be used for certification testing or products for Windows Server 2022.
Previous versions of the HLK to be used for testing previous Windows Server versions will continue to be available in accord with the Microsoft Product Lifecycle guidance.
by Contributed | Jun 1, 2021 | Technology
This article is contributed. See the original author and article here.
With the Azure Static Web Apps GA there was a sneaky little project that my colleague Wassim Chegham dropped, the Static Web Apps CLI.
The SWA CLI is a tool he’s been building for a while with the aim to make it easier to do local development, especially if you want to do an authenticated experience. I’ve been helping out on making sure it works on Windows and for Blazor/.NET apps.
It works by running as a proxy server in front of the web and API components, giving you a single endpoint that you access the site via, much like when it’s deployed to Azure. It also will inject a mock auth token if want to create an authenticated experience, and enforce the routing rules that are defined in the staticwebapp.config.json file. By default, it’ll want to serve static content from a folder, but my preference is to proxy the dev server from create-react-app, so I can get hot reloading and stuff working. Let’s take a look at how we can do that.
Using the cli with VS Code
With VS Code being my editor of choice, I wanted to work out the best way to work with it and the SWA CLI, so I can run a task and have it started. But as I prefer to use it as a proxy, this really requires me to run three tasks, one of the web app, one for the API and one for the CLI.
So, let’s start creating a tasks.json file:
{
    "version": "2.0.0",
    "tasks": [
        {
            "type": "npm",
            "script": "start",
            "label": "npm: start",
            "detail": "react-scripts start",
            "isBackground": true
        },
        {
            "type": "npm",
            "script": "start",
            "path": "api/",
            "label": "npm: start - api",
            "detail": "npm-run-all --parallel start:host watch",
            "isBackground": true
        },
        {
            "type": "shell",
            "command": "swa start http://localhost:3000 --api http://localhost:7071",
            "dependsOn": ["npm: start", "npm: start - api"],
            "label": "swa start",
            "problemMatcher": [],
            "dependsOrder": "parallel"
        }
    ]
}
The first two tasks will run npm start against the respective parts of the app, and you can see from the detail field what they are running. Both of these will run in the background of the shell (don’t need it to pop up to the foreground) but there’s a catch, they are running persistent commands, commands that don’t end and this has a problem.
When we want to run swa start, it’ll kick off the two other tasks but using dependent tasks in VS Code means it will wait until the task(s) in the dependsOn are completed. Now, this is fine if you run a task that has an end (like tsc), but if you’ve got a watch going (tsc -w), well, it’s not ending and the parent task can’t start.
Unblocking blocking processes
We need to run two blocking processes but trick VS Code into thinking they are completed so we can run the CLI. It turns out we can do that by customising the problemMatcher part of our task with a background section. The important part here is defining some endPattern regex’s. Let’s start with the web app, which in this case is going to be using create-react-app, and the last message it prints once the server is up and running is:
To create a production build, use npm run build.
Great, we’ll look for that in the output, and if it’s found, treat it as the command is done.
The API is a little trickier though, as it’s running two commands, func start and tsc -w, and it’s doing that in parallel, making our output stream a bit messy. We’re mostly interested on when the Azure Functions have started up, and if we look at the output the easiest message to regex is probably:
For detailed output, run func with –verbose flag.
It’s not the last thing that’s output, but it’s close to and appears after the Functions are running, so that’ll do.
Now that we know what to look for, let’s configure the problem matcher.
Updating our problem matchers
To do what we need to do we’re going to need to add a problemMatcher section to the task and it’ll need to implement a full problemMatcher. Here’s the updated task for the web app:
{
    "type": "npm",
    "script": "start",
    "problemMatcher": {
        "owner": "custom",
        "pattern": {
            "regexp": "^([^s].*)((d+|d+,d+|d+,d+,d+,d+)):s+(error|warning|info)s+(TSd+)s*:s*(.*)$",
            "file": 1,
            "location": 2,
            "severity": 3,
            "code": 4,
            "message": 5
        },
        "fileLocation": "relative",
        "background": {
            "activeOnStart": true,
            "beginsPattern": "^.*",
            "endsPattern": "^.*To create a production build, use npm run build."
        }
    },
    "label": "npm: start",
    "detail": "react-scripts start",
    "isBackground": true
}
Since create-react-app doesn’t have a standard problemMatcher in VS Code (as far as I can tell anyway) we’re going to set the owner as custom and then use the TypeScript pattern (which I shamelessly stole from the docs :rolling_on_the_floor_laughing:). You might need to tweak the regex to get the VS Code problems list to work properly, but this will do for now. With our basic problemMatcher defined, we can add a background section to it and specify the endsPattern to match the string we’re looking for. You’ll also have to provide a beginsPattern, to which I’m lazy and just matching on anything.
Let’s do a similar thing for the API task:
{
    "type": "npm",
    "script": "start",
    "path": "api/",
    "problemMatcher": {
        "owner": "typescript",
        "pattern": {
            "regexp": "^([^s].*)((d+|d+,d+|d+,d+,d+,d+)):s+(error|warning|info)s+(TSd+)s*:s*(.*)$",
            "file": 1,
            "location": 2,
            "severity": 3,
            "code": 4,
            "message": 5
        },
        "background": {
            "activeOnStart": true,
            "beginsPattern": "^.*",
            "endsPattern": ".*For detailed output, run func with --verbose flag..*"
        }
    },
    "label": "npm: start - api",
    "detail": "npm-run-all --parallel start:host watch",
    "isBackground": true
}
Now, we can run the swa start task and everything will launch for us!

Conclusion
Azure Static Web Apps just keeps getting better and better. With the CLI, it’s super easy to run a local environment and not have to worry about things like CORS, making it closer to how the deployed app operates. And combining it with these VS Code tasks means that with a few key presses you can get it up and running.
I’ve added these tasks to the GitHub repo of my Auth0 demo app from the post on using Auth0 with Static Web Apps.


Recent Comments