by Scott Muniz | Jul 6, 2020 | Uncategorized
This article is contributed. See the original author and article here.
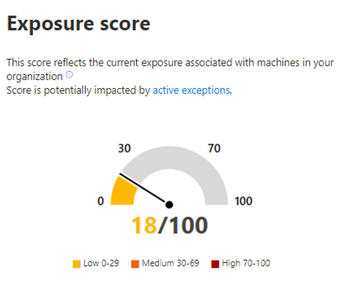
Effectively discovering, prioritizing, and remediating endpoint weaknesses is pivotal in running a healthy security program and reducing organizational risk. Threat and vulnerability management, which is part of Microsoft Defender ATP, redefines how security and IT teams reduce organizational exposure, harden endpoint surface areas, and increase organizational resilience. One of the key metrics admins track is the exposure score in their organization – it helps them understand how exposed their organization is to threats as a result of vulnerabilities on devices they manage. The lower the score, the less risk exists.
Today, we’re excited to announce public preview of the event timeline, a new, industry-first way for admins to interpret how risk got introduced into their organization, and what mitigation needs to take place to reduce it. Let’s see how it works in real life!
Meet Emily, a security admin who uses threat and vulnerability management to help manage and reduce her organization’s exposure to security risks. It’s pretty easy for Emily to get a quick view of the current exposure of devices right from the dashboard. Emily left the office on Friday afternoon with a low exposure score, feeling pretty confident about her organizational exposure to outside threats.
As Emily sits down at her desk on Monday morning, she’s shocked to see a large spike in exposure. What happened over the weekend?

Emily hovers over the exposure score graph to view the score and top events from the past few days.

She quickly discovers that new software vulnerabilities were found over the weekend, which impacted some of her organization’s devices. But what exactly happened and which of these vulnerabilities should she tackle first? This is where the event timeline steps in to help.
She selects Show all events from this day and is taken to the event timeline page. Emily can now easily see a list of events, the date, related component, the number of originally impacted machines, and the type of event, all in chronological order.

To dig a little deeper, she opens the filters panel and filters out lower impacting events.

By filtering out the lower impact events, Emily finds that several applications have new vulnerabilities and even an exploit that was verified.
She selects one event to take a closer look and can see that this event is impacting a large percentage of her devices. This must be the main source of the increase to her exposure score! She needs to act quickly to address this new vulnerability.

Determined to tackle this immediately, Emily selects Go to related security recommendation which takes her to the security recommendations page and the recommendation that will address the new software vulnerability. After reading the description and vulnerability details in the security recommendation, she decides to submit a remediation request.

Making a remediation request in threat and vulnerability management is easy. Emily selects Remediation options and fills out the form to open a remediation request for the IT team via Intune. She’s able to include notes to the IT team to explain the context for the request and why it’s critical for them to perform the remediation quickly.

The IT team receives the request, and immediately sets to work patching the vulnerable application. Throughout the day, Emily is able to easily monitor their progress in the remediation page and have peace of mind that the IT team is taking care of it:

Once the remediation activities are complete, the exposure score returns to a low state and Emily breathes a sigh of relief.
With that incident complete, Emily can start her week with the confidence that she can address whatever new security issues arise.
Customer feedback
We’re thrilled to be bringing to you this latest innovation in vulnerability management and assessment. Early feedback shared by customers was positive, acknowledging that this feature will help them more quickly understand changes in their exposure score, and that they welcome being able to attribute changes in the score.
Ben Watt, an End User Computing Manager at The James Hutton Institute said:
“Great enhancement – just tried it out right now – makes things a lot easier in keeping track of new vulnerabilities and exploits that threat and vulnerability management has detected. I like it!”
Anamika Sharma, IT Security Specialist at Saxo Bank said:
“We really liked the timeline feature in the threat and vulnerability management module. We are managing our Vulnerability Management process from this feature entirely”
How to get started
To start trying out the event timeline, we encourage you to turn on preview features in the Microsoft Defender Security Center today check out the documentation or go directly to the new event timeline page.
To learn more about threat and vulnerability management and our industry disruptive approach to the discovery, prioritization, and remediation of endpoint vulnerabilities and misconfigurations, check out our webinar with SANS or visit our web page.
Looking to try out threat and vulnerability management? It’s already included in Microsoft Defender ATP! If you’re not yet taking advantage of Microsoft’s industry leading security optics and detection capabilities for endpoints, sign up for a free trial of Microsoft Defender ATP today.
by Scott Muniz | Jul 6, 2020 | Uncategorized
This article is contributed. See the original author and article here.
Hello everyone, here is part 7 of a series focusing on Application Deployment in Configuration Manager. This series is recorded by @Steve Rachui, a Microsoft principal premier field engineer. These tutorials are from our library and uses Configuration Manager 2012 in the demos, however the concepts are still relevant for Configuration Manager current branch.
This session includes demonstrating some of the database changes that happen as a result of creating a sample application. The discussion focuses on the way applications are represented and stored in several of the key configuration items tables. The demo also follows the configuration items as dependencies, requirements and supercedence relationships are added to the application. The session wraps up by deploying the application and following it to the primary child site with the ultimate goal of preparing policy for consumption by the client.
Next in the series Steve discusses the distribution point, focusing on the way the content store is leveraged during the application creation, the internal structure of the content store, the efficiencies of the content store and content movement to distribution points at other site.
Posts in the series
Go straight to the playlist
by Scott Muniz | Jul 6, 2020 | Azure, Microsoft, Technology, Uncategorized
This article is contributed. See the original author and article here.
In the article “Azure Sentinel correlation rules: Active Lists out; make_list() in,” I presented a rule that detects a number of sign-in failures to Azure AD, alongside a sign-in success to AWS from the same IP address. An inherent challenge with the rule was that the time window is defined by rule execution: if the rule is executed every hour, and an attack is split across two rule executions, no alert will be triggered.
In this blog post, we will see how to modify this rule to analyze a sliding time window, and therefore work across rule execution boundaries. While enhancing the rule time window support, we will also add support for delayed events.
This post of part of a series of blog posts on writing rules in Azure Sentinel:
Defining the sliding window
Let start with defining the time variables for the detection:
let rule_frequency = 1h; // how often is the rule executed
let max_session = 24h; // the maximum length of a detected session
let aad_delay = 1h; // the maximum delay we anticipate for events for each source
let aws_delay = 1h;
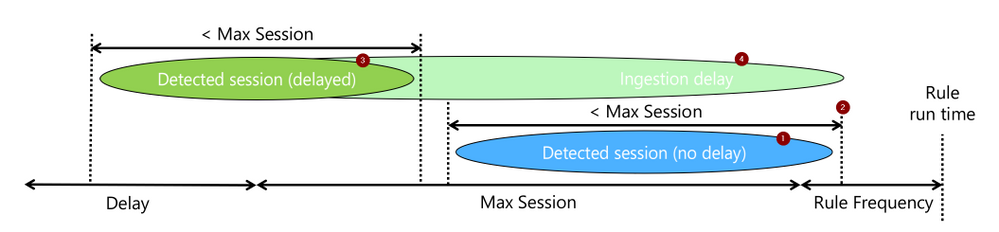
The rule attempts to detect a sequence of events (1), let’s call them a session, that took less than “max_session” and of which the last occurred within the current rule run (2). When events are expected to be delayed, we will still look for such a session (3), but require that the last event was ingested (4) within the current rule run.

The rest is just the mechanics of how to do the above.
Filtering the relevant AAD events
The rule logic itself starts, as did the simpler version, with filtering Azure AD Sign-in failures. However, if the original version did not explicitly filter on time, this one adds a time condition (green). The time condition go back as much as needed to capture sessions that ended at the beginning of the current run window, even if delayed.
let signin_threshold = 5;
let suspicious_signins =
SigninLogs
| where TimeGenerated > ago (max_session + rule_frequency + aad_delay)
| where ResultType !in ("0", "50125", "50140")
| where IPAddress != "127.0.0.1"
Identifying AAD failure sessions
Next comes the KQL magic that makes sliding windows detection easy:
- The operator row_window_session (green) searches for sessions: sequences of events no longer than max_session. It adds to each event a field, aad_first_time, which includes the time of the first event in the session and would be the same for all events in the session.
- To prepare the data for row_window_session, we sorted (red) as the operator expected sorted input. In this case, we sort by IP address, in addition to time, to ensure sessions are specific to a source IP address.
- Lastly, we analyze using the operator summarize (blue), the data we need from each session: its length and indicative timestamps.
| sort by IPAddress, TimeGenerated asc
| extend aad_first_time = row_window_session (TimeGenerated, max_session, max_session, IPAddress != prev(IPAddress))
| summarize session_count = count(), aad_last_time = max(TimeGenerated), aad_last_ingest=max(ingestion_time()) by aad_first_time , IPAddress
Filtering only relevant sessions
Once we have sessions, we need to check if indeed indicate a detection:
- Was the session count above the detection threshold? (red)
- Did the session end within the latest rule execution, adjusted to an ingestion delay? (blue)
The last line, project-rename, is just makeup. It renames IPAddress to make it easy to identify it as the AAD failure session IP address. This comes in handy after the join when multiple tables add their fields to the result set.
| where session_count >= signin_threshold
| where aad_last_time > ago (rule_frequency + aad_delay)
| project-rename aad_ip_address = IPAddress;
Note that unlike the simpler version, the result of this query part is a table and not a list, and we will use the join operator to correlate it to the AWS events. Why? We need to keep the timestamps and test them after the “join.” It would also help us provide more data to the analyst.
Want to stop here? the general aggregation case
While the rule we explore correlates sign-in failures on Azure with a successful sign-in on AWS, the more common form is simple aggregation. i.e., detection more than X events in a time window. The section we already covered address such a general use case, with the following small modifications:
- Remote the line “let suspicious_signins =“, and the semicolon at the end to make this the primary query in the rule.
- Add the line “| where aad_last_ingest > ago(rule_frequency)” to ensure the session included a new, just ingested, event and therefore was not yet reported on.
Matching the sessions to a successful AWS login event
After finding successful AWS logins (red), we match them on IP addresses to the sessions we identified earlier on using join (blue). For matches, implying we have a session of Azure failures and a successful AWS login for the same address, we test the following:
- Was any of the events ingested in the latest rule execution window (green)? This ensures the detected attack included new information and was not reported yet. This is the primary means used to support delayed events while avoiding duplicate alerting.
- Was the successful AWS event with the time window of the session? (blue). This a simple to implement choice, but not the only one. Other options can also be implemented, such as the AWS success happening after the Azure failure session. Those will require changing this time condition line and may also require extending other timeframes in the query.
The “project-rename” and “extend” operators (orange), are again cosmetic only and makes the AWS fields easy to use and identify in the joined table.
AWSCloudTrail
| where TimeGenerated > ago(max_session + rule_frequency + delay)
| where EventName == "ConsoleLogin"
| extend LoginResult = tostring(parse_json(ResponseElements).ConsoleLogin)
| where LoginResult == "Success"
| project-rename aws_time = TimeGenerated, aws_ip_address = SourceIpAddress
| extend aws_ingest_time = ingestion_time()
| join suspicious_signins on $left. aws_ip_address == $right.aad_ip_address
| where max_of(aws_ingest_time, aad_last_ingest) > ago(rule_frequency)
| where aws_time between (aad_first_time ..aad_last_time)
That’s it. The rest would be just result and entity preparation.
Rule Settings
An analytics rule is not just a query. There are several parameters that you need to set to make it work. The two critical ones are:
- -“Run query every” is the rule execution frequency and should be set to, as expected to “rule_frequency”.
- “Lookup data from the last,” or the rule’s lookback time, has to be at least as long as the most extended time condition in the rule. This would be max_session + rule_frequency + the longer of the delays, aad_delay, and aws_delay.
Also, you should configure alert aggregation based on the source IP address. A sliding window-based rule will alert when new events are extending an existing session. While it is possible to suppress such alerting, it adds information, so generating an alert that will be grouped to the same incidents is the best practice. Aggregation should be by IP address and aad_first_time, to which you should allocate one of the unused entities.
Summary
Aggregation rules and more advanced relations-based rules require careful consideration of time window management to avoid missing alerts or duplicate alerting. This article provides a recipe that should help you implement such rules correctly using a sliding window analysis.
I hope you found it useful!
by Scott Muniz | Jul 6, 2020 | Uncategorized
This article is contributed. See the original author and article here.
Modern business process is essential for transforming organizational productivity in Microsoft 365. Since the release of SharePoint workflows, Microsoft has evolved workflow orchestration to not only encompass SharePoint, but all the productivity services you use with Microsoft 365 and beyond.
Microsoft Power Automate connects to all Microsoft 365 services and over 220 services to let an enterprise build custom workflows. With the continued investment in Power Automate as the universal solution to workflow, Microsoft is retiring SharePoint 2010 workflows.
SharePoint 2010 workflows will be retired in 2020
For customers using SharePoint 2010 workflows, we recommend migrating to Power Automate during 2020 to maintain continuity in any business process.
- Starting August 1st, 2020, SharePoint 2010 workflows will be turned off for newly created tenants.
- Starting November 1st, 2020, Microsoft will begin to remove the ability to run or create SharePoint 2010 workflows from existing tenants.
SharePoint Modernization Scanner
To understand if your organization is using workflow 2010 or begin planning migration to Power Automate, we recommend that customers run the SharePoint Modernization Scanner tool to scan their tenants for legacy workflows usage. Using the Workflow Report generated by the scanner tool, customers can understand the following:
- Distribution of legacy workflows across SharePoint 2010 and SharePoint 2013 workflows
- Distribution of out of the box and custom legacy workflow usage
- Which sites and lists use legacy workflows
- Power Automate upgradability score indicating how well the detected actions are upgradable to flows with Power Automate
Using the Workflow Report along with site information, tenant administrators can work with their users to plan the migration of legacy workflows with minimal interruption.
SharePoint 2013 workflows remain supported
SharePoint 2013 workflows will remain supported, although deprecated. However, we recommend customers move to Power Automate or other supported solutions, such as those from Preferred members of our Microsoft 365 Business Apps Partner Program.
Starting in November 2020, SharePoint 2013 workflows will be turned off by default for new tenants. Microsoft will provide a PowerShell script to let customers to activate the SharePoint 2013-based workflow engine for tenant as needed.
Use Power Automate with Microsoft 365 licenses
All Microsoft 365 licenses include usage of the Power Platform for customizing and extending Microsoft 365 applications. This includes both Power Automate and Power Apps.
Power Automate also has additional premium features that you can buy on top of your Microsoft 365 licenses. To learn more about what specific features are included with Microsoft 365 licenses go here.
SharePoint Server support for SharePoint 2010 and SharePoint 2013 workflows
SharePoint 2010 and SharePoint 2013-based workflows will continue to be supported for on-premises SharePoint 2016 and SharePoint 2019 Server platforms until 2026.
SharePoint Designer 2013
SharePoint 2010 workflow creation with SharePoint Online using SharePoint Designer 2013 will be turned off for any newly created tenants starting August 2020 and existing tenants starting November 2020. SharePoint Designer 2013 will work with SharePoint Server 2019 for the remainder of the client support lifecycle (2026). SharePoint Designer 2013 will not be supported beyond that timeframe.
Summary
We recognize that these changes may require additional work for some of our customers, and we’re ready to provide support during this transition. We are encouraged by our customer successes, and our ongoing investment in business process modernization in Microsoft 365 on the Power Platform. We’ll continue to share updates through our support articles at https://aka.ms/sp-workflows-support . Thank you.
by Scott Muniz | Jul 6, 2020 | Uncategorized
This article is contributed. See the original author and article here.
What is SharePoint Perfwiz and why do we need a replacement?
SharePoint Perfwiz was a tool used by Product Support to create performance log counters on SharePoint servers to troubleshoot performance issues. This tool has been deprecated but there is still a need to collect performance data for those pesky performance issues.
The Perfwiz tool simply used LOGMAN.exe to create a custom counter set with several selected counters specifically for SharePoint servers.
This blog will detail how to use LOGMAN.exe to mimic the baseline counter set that was created by the Perfwiz tool.
The command Line
Here is the command used to create the Baseline counter set:
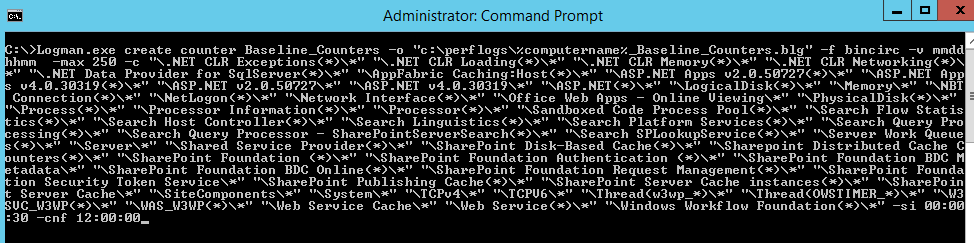
Logman.exe create counter Baseline_Counters -o “c:perflogsBaseline_Counters.blg” -f bincirc -v mmddhhmm -max 250 -c “.NET CLR Exceptions(*)*” “.NET CLR Loading(*)*” “.NET CLR Memory(*)*” “.NET CLR Networking(*)*” “.NET Data Provider for SqlServer(*)*” “AppFabric Caching:Host(*)*” “ASP.NET Apps v2.0.50727(*)*” “ASP.NET Apps v4.0.30319(*)*” “ASP.NET v2.0.50727*” “ASP.NET v4.0.30319*” “ASP.NET(*)*” “LogicalDisk(*)*” “Memory*” “NBT Connection(*)*” “NetLogon(*)*” “Network Interface(*)*” “Office Web Apps – Online Viewing*” “PhysicalDisk(*)*” “Process(*)*” “Processor Information(*)*” “Processor(*)*” “Sandboxed Code Process Pool(*)*” “Search Flow Statistics(*)*” “Search Host Controller(*)*” “Search Linguistics(*)*” “Search Platform Services(*)*” “Search Query Processing(*)*” “Search Query Processor – SharePointServerSearch(*)*” “Search SPLookupService(*)*” “Server Work Queues(*)*” “Server*” “Shared Service Provider(*)*” “SharePoint Disk-Based Cache(*)*” “Sharepoint Distributed Cache Counters(*)*” “SharePoint Foundation (*)*” “SharePoint Foundation Authentication (*)*” “SharePoint Foundation BDC Metadata*” “SharePoint Foundation BDC Online(*)*” “SharePoint Foundation Request Management(*)*” “SharePoint Foundation Security Token Service*” “SharePoint Publishing Cache(*)*” “SharePoint Server Cache instances(*)*” “SharePoint Server Cache*” “SiteComponents*” “System*” “TCPv4*” “TCPV6*” “Thread(w3wp_*)*” “Thread(OWSTIMER_*)*” “W3SVC_W3WP(*)*” “WAS_W3WP(*)*” “Web Service Cache*” “Web Service(*)*” “Windows Workflow Foundation(*)*” -si 00:00:30 -cnf 12:00:00
Switches used:
-o: The output file
-f: Sets the file to a circular binary
-v: Adds a date / time stamp in the file name
-max: The max file size
-c: The counter list
-si: The sample interval
-cnf: 12:00:00 tells the counter to create a new file and continue when the max size has been reached or after 12 hours.
What is looks like
To run the LOGMAN.exe command, you will need an elevated command prompt to run this command.

Here is what it looks like after the counters are created:

Here is an example of the output file:

After the counters are created, they can be started with the following command:
logman start Baseline_Counters
After the problem is reproduced, stop the counters with the following command:
logman stop Baseline_Counters
However, they can be started and stopped manually as well.
Important notes and takeaways
- If you have multiple servers, you can use the -s switch and feed in a server list, example:
$servers = Get-Content c:tempservers.txt

foreach ($server in $servers) {

Logman.exe create counter -s $server 'Baseline_Counters' -o 'c:perflogsBaseline_Counters.blg'
-f bincirc -v mmddhhmm -max 250 -c '".NET CLR Exceptions(*)*" ".NET CLR Loading(*)*" ".NET CLR Memory(*)*" ".NET CLR Networking(*)*" ".NET Data Provider for SqlServer(*)*" "AppFabric Caching:Host(*)*" "ASP.NET Apps v2.0.50727(*)*" "ASP.NET Apps v4.0.30319(*)*" "ASP.NET v2.0.50727*" "ASP.NET v4.0.30319*" "ASP.NET(*)*" "LogicalDisk(*)*" "Memory*" "NBT Connection(*)*" "NetLogon(*)*" "Network Interface(*)*" "Office Web Apps - Online Viewing*" "PhysicalDisk(*)*" "Process(*)*" "Processor Information(*)*" "Processor(*)*" "Sandboxed Code Process Pool(*)*" "Search Flow Statistics(*)*" "Search Host Controller(*)*" "Search Linguistics(*)*" "Search Platform Services(*)*" "Search Query Processing(*)*" "Search Query Processor - SharePointServerSearch(*)*" "Search SPLookupService(*)*" "Server Work Queues(*)*" "Server*" "Shared Service Provider(*)*" "SharePoint Disk-Based Cache(*)*" "Sharepoint Distributed Cache Counters(*)*" "SharePoint Foundation (*)*" "SharePoint Foundation Authentication (*)*" "SharePoint Foundation BDC Metadata*" "SharePoint Foundation BDC Online(*)*" "SharePoint Foundation Request Management(*)*" "SharePoint Foundation Security Token Service*" "SharePoint Publishing Cache(*)*" "SharePoint Server Cache instances(*)*" "SharePoint Server Cache*" "SiteComponents*" "System*" "TCPv4*" "TCPV6*" "Thread(w3wp_*)*" "Thread(OWSTIMER_*)*" "W3SVC_W3WP(*)*" "WAS_W3WP(*)*" "Web Service Cache*" "Web Service(*)*" "Windows Workflow Foundation(*)*"' -si 00:00:30 -cnf 12:00:00
 }
- The default action of this counter set is to run forever, you will need to stop them manually once this data is no longer needed.

Recent Comments