by Scott Muniz | Jul 8, 2020 | Uncategorized
This article is contributed. See the original author and article here.
I’m pretty sure no one missed the rapid increase in remote working during the first half of 2020. Something that also became very clear in the Microsoft Teams UserVoice were entries that were pretty unknown before rapidly rose in number of votes.
One of those entries that I’d like to talk about today is breakout rooms – you know the possibility to have a group of people in a meeting, then automagically move them to separate “rooms” and when you’re finished automagically get all the participants back to the original meeting. Microsoft recently announced that breakout rooms are actually on it’s way, sometime during this fall it will be available – here you can read more.
But I needed the feature now and not later, wherefore I searched for the clever ideas from the Microsoft Teams community. With inspiration from Vesku’s blog post I decided to try this at my new client, follow along the rest of this post where I show you how I did it!
Background
A virtual workshop with 27 participants, in an organization new to Microsoft Teams (besides using meetings and chat for a couple of weeks). Jumping back and forth between the “main room” and breakout rooms between exercises.
This could be exciting – right  .
.
Before the workshop
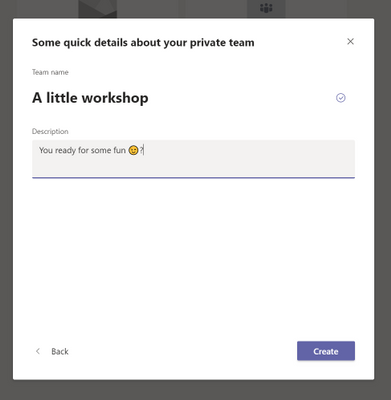
Let’s start with the prerequisites, and it’s pretty simple – you need a private team in Microsoft Teams.

The next step is very important and that is to NOT invite the participants to the team before you’ve done all the preparations. We don’t want annoyed people getting 1 million calendar invites even before the workshop started. I sent one calendar invite in which I copied the meeting link to the general main room.
And time for prepping, first some “technical” preparations:
1. I added a channel per discussion group. For my particular case we ended with 5 breakout rooms and the general channel as the main room. I made all the channels standard channels, no need to have private channels *transparency*

2. I didn’t find changing the general team settings necessary, but you can do it to remove the possibility of doing anything besides what is needed for the workshop. I removed all options besides deleting and editing posts

3. When we have all the channels it’s time to fill them with content, I added a friendly welcome message. Since everyone in the workshop can jump into any channel, I decided to post all names of the group members to make it easier for the users

4. Then it’s time to create all the different meeting rooms. One channel meeting is the same as a meeting room, so we’ll start with a common room – that needs to be scheduled in the general channel. Just add the channel and no participants

And then it’s just time to schedule a meeting group room per group, when you’re done it should look something like this in your calendar:

And this is how it should look in the channels (this is the general room and a group room):


5. When all of this was done it’s ok to add all the participants, I waited until the day before to add the participants to avoid too much happening in the team
And then we did a couple of preparations for the users, to ensure that the workshop experience would be as smooth as possible for the participants:
1. Since the users were new to teams in Microsoft Teams, I prepared a guide on how to join the meetings and how to switch between the general room and the group rooms
2. We assigned the different groups before and informed the participant about this is your group, so all the people would know what group room to join
3. For each group, a note taker was assigned, this person got the material before and knew that she/he would take all the notes during the exercises
After the preparations were done it was just time to wait  .
.
During the workshop
Fast forward a couple of weeks and it was finally time for the anticipated workshop!
Me and my co-presenter met 30 minutes early to start all the meetings, this to get the nice joining experience for all the participants. But note that you can only be in four meetings at the same time.

Another thing I found important during the meeting (and that I would recommend for most larger meetings) was having a moderator. Someone that will keep track of the chat when the presenter is presenting, makes it much easier.
Once all the people joined it was time to start.

Since this was a group of people not usually working together, we started with a presentation of everyone, tricky you might say? We solved it by going A-Ö by last name and my co-presenter giving the word to the person next in line. It worked super smoothly.
And the workshop was in full speed!
One last thing that I believe was a success factor for this workshop was that before all the groups went to discuss in their own rooms, we asked to assign a timekeeper to keep track of the time. And you know what? People were on time and we didn’t spend too much time waiting at all  . Fantastic.
Three hours passed in a minute and the workshop was over, with lots of great insights delivered.
Conclusion
I was really impressed with how smooth it went. Only technical issues we had was with people joining from the mobile since the jumping between meetings isn’t working there. When I do it again, I will probably add a help section on how to do it from mobile.
And don’t forget to follow the UserVoice for live updates about breakout rooms  !
!
by Scott Muniz | Jul 8, 2020 | Uncategorized
This article is contributed. See the original author and article here.
This blog has been authored by Neta Haiby (Principal PM, Azure AI) and Prachi Jain (PMM, Azure AI)
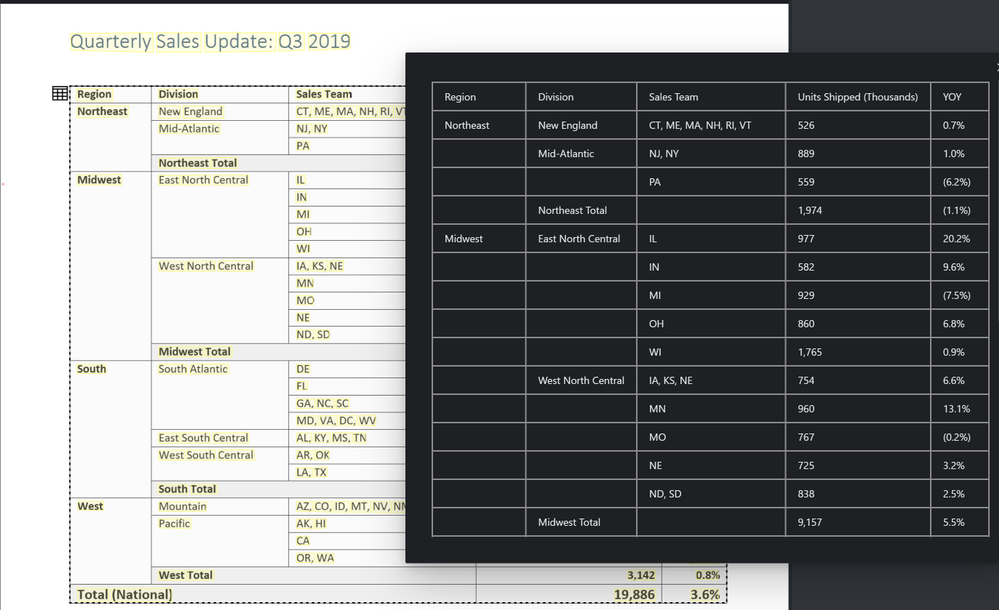
Documents are prevalent and often contain vital information that are essential to drive business outcomes; however, extracting data quickly and accurately for processing is often a challenge for so many organizations. Manual extraction can take up long processing cycles, cause errors and inefficiencies. Hence, extracting text and structure from documents with Form Recognizer helps tackle these challenges swiftly and boost productivity.
We are excited to announce the general availability (GA) release of Form Recognizer. You can now extract text, tables, and key value pairs quickly and accurately from documents. It will support multi-page documents (Images, PDFs and Tiff files) and extract a structured representation output of the document and its contents.
Form Recognizer comprises the following:
1. Layout
Detects and extracts text and tables structure extraction:

How to use and get started
You can use Form Recognizer Layout to recognize tables, text lines and words in documents, without needing to train a model. To get started you can use the following:
2. Pre-built
These are pre-trained models for common scenarios that extract value of interest from documents. The pre-built receipts model that extracts data from receipts is in general availability today.

How to use and get started
You can use Form Recognizer to extract common fields from receipts, using a pre-trained receipt model. To get started you can use the following:
3. Custom
This custom service lets you train with your own data to learn the structure of your documents in an intelligent way with unsupervised and supervised learning

How to use and get started
You can train custom models tailored to your own documents. A trained model can output structured data that includes the text, tables, and key value pairs relationships in the original form document. After you train the model, you can test it and eventually use it to reliably extract data from more forms according to your needs. To get started you can use the following:
Code examples
These code snippets show you how to do the following tasks with the Form Recognizer client library for .NET:
Authenticate the client

Extract text and tables from documents using Layout

Recognize receipts

Train a custom model

Analyze forms with a custom model

Manage your custom models

How partners have built solutions with Form Recognizer
 ” Automation Anywhere has expanded the capabilities of IQ Bot to include Form Recognizer with an easy-to-use, “IQ Bot Forms” solution which combines the power of Microsoft Cognitive Services with IQ Bot and RPA to accelerate the end-to-end processing of complex documents. Use cases supported include Driver’s Licenses, Insurance Claims and Tax Forms. This highly secure solution, comprises Automation Anywhere RPA with native Intelligent Document Processing (IDP) and Azure Cognitive Services Computer Vision API and Form Recognizer.” Shobhana Viswanathan, Director of Business Development, Automation Anywhere
 “Blue Prism has always been committed to creating a connected-RPA platform that makes it easy for our customers to consume the best in AI and machine learning technologies. As part of this commitment to innovation, we recently released a Form Recognizer API skill that gives our customers the power to quickly add deep-learning algorithms, advanced machine learning, and key value pair extraction to any Blue Prism process.” Colin Redbond – Senior Vice President – Emerging Technologies at Blue Prism

“Icertis’ suite of AI technologies use machine learning to help understand the contract, its obligations and its environment better. Form Recognizer is an important tool in that arsenal that helps identify structured data in forms quickly and accurately. With a very simple training interface, it empowers the Icertis Contract Management platform users to effectively incorporate AI in their day-to-day processes while ensuring that their data is safe and protected – important steps in our vision of making contracting simple, yet powerful.” Monish Darda, CTO and Co-founder, Icertis
 “With the power of forms recognizer, Neudesic was able to create a simple interface for business users to extract data from multiple unique document sets, each containing complex data structures and dozens of data points, including tables. Users simply provide sample documents and label their data – no need to understand how Form Recognizer, or the other powerful Cognitive Services involved, should be applied, dramatically simplifying how AI can be applied to their processes.” Ken Kuzdas, Artificial Intelligence and Process Automation Lead, Neudesic

“UiPath remains committed to an open Platform and building integrations with partner AI services so you can automate document processing using your service of choice. The UiPath Activity Pack for Microsoft Azure Form Recognizer make it easy to automate tasks that involve document data – for example, reading invoices, timesheets, tables, and reports. By combining AI-powered document extraction services from Microsoft with the industry-leading UiPath Enterprise RPA Platform, you can extract data from any document using the service of your choice – and easily leverage this data in your automated processes.” Brandon Brown, Director Integrations and Solutions Delivery,UiPath
Independent benchmark testing results
Cazton ,a top leader in in IT and Software Consulting, Training and Recruiting services across United States, Canada and Europe performed an independent study comparing available cloud offerings for recognizing form data in the cloud and concluded that Azure Form Recognizer does a fantastic job in creating a viable solution with just five sample documents. It performs end-to-end Optical Character Recognition (OCR) on handwritten as well as digital documents with an amazing accuracy score and in just three seconds.
Chander Dhall, CEO of Cazton quotes that “I am impressed with Microsoft’s focus on creating artificial intelligence powered solutions that have practical uses in the enterprise.”
New in this release
In this release we are introducing the following new features:
1. Enhanced security features
- Bring your own key
Form Recognizer automatically encrypts your data when persisted it to the cloud. Form Recognizer encryption protects your data and to help you to meet your organizational security and compliance commitments. By default, your subscription uses Microsoft-managed encryption keys. However, you can now also manage your subscription with your own encryption keys. Customer-managed keys (CMK), also known as bring your own key (BYOK), offer greater flexibility to create, rotate, disable, and revoke access controls. You can also audit the encryption keys used to protect your data. Learn more here
- Private endpoints
Enables you on a virtual network (VNet) to securely access data over a Private Link
2. Better Accuracy
- Table enhancements and Extraction enhancements
This feature includes extraction enhancements, accuracy improvements and table extractions enhancements, specifically, the capability to learn tables headers and structures in custom train without labels.
- Currency support
Helps detection and extraction of global currency symbols
3. Extended Availability
Get started
by Scott Muniz | Jul 8, 2020 | Uncategorized
This article is contributed. See the original author and article here.
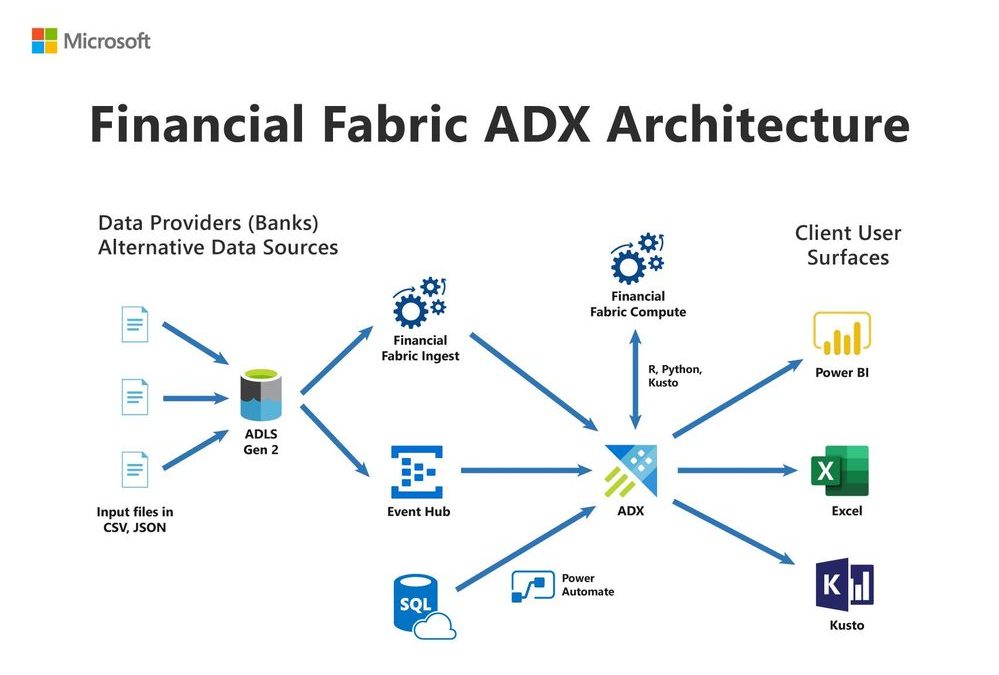
Innovative New York-based fintech FINANCIAL FABRIC provides specialized data analytics solutions to the buy-side. With Azure Data Explorer, the company has been enabled to rapidly ingest even the most massive datasets, easily run complex queries and provide near-real time analytics services to a range of financial services end users, achieving exceptional data compression and reducing query times from hours to seconds. “We handle structured data, semi structured data, unstructured data … it’s a fantastic offering for our platform.

Azure Data Explorer allows data scientists to access data very easily and run complex queries with incredible speed,” says Paul Stirpe, Ph.D., CTO, Financial Fabric.

Learn more
by Scott Muniz | Jul 8, 2020 | Azure, Microsoft, Technology, Uncategorized
This article is contributed. See the original author and article here.
In this post, we’ll explain how to configure Azure Monitor with Azure Log Analytics in Microsoft Azure, so you can proactively monitor your Azure Resource Manager (ARM)-based Windows Virtual Desktop environment.
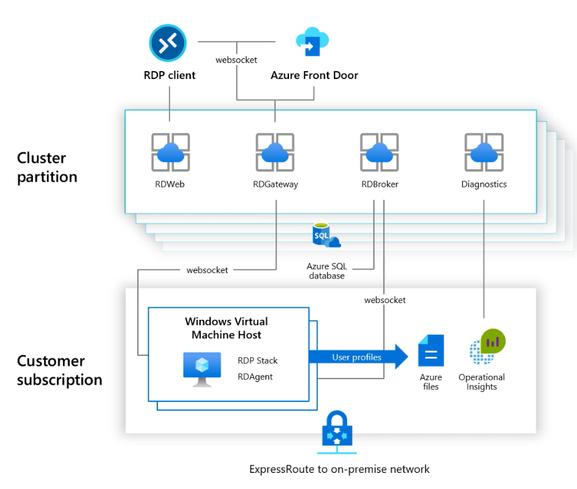
As shown in the diagram below, Azure Monitor can collect diagnostic data and operational insights from a variety of sources. You can monitor data for your workspace and virtual machine (VM) performance as well as tiered session information from your host pools, operating system and the services it relies on, and the platform itself.
 Diagram of how data flows in and out of your Windows Virtual Desktop environment
By following the steps in this post, you can create a dashboard that provides access to insights about key elements of your Windows Virtual Desktop deployment, such as:
- Session details
- Session diagnostics
- User specific reporting
- Session performance
- Host performance
- Disk performance
 Screenshot of the Windows Virtual Desktop dashboard Overview screen
Top three insights in the Windows Virtual Desktop workspace
The custom dashboard gives you visibility of key elements for your Windows Virtual Desktop workspace. Here, we’re highlighting the top three insights: session details, host pool performance, and disk performance.
Session details
The dashboard view below shows the status of the most important session details—including top hosts, active users, and more—for your Windows Virtual Desktop workspace.
 Screenshot of the Session Details dashboard for Windows Virtual Desktop
Host pool performance
In this dashboard, you can collect and view information about the performance and registration statuses of your hosts.
 Screenshot of the Host Performance dashboard for Windows Virtual Desktop
Disk performance
Through the Disk Performance dashboard you can view captured information about the storage level consumption of your profile container—virtual (logical) disks. This information can help you measure input/output operations per second (IOPS) and latency to your Azure Files or Azure NetApp Files environment regarding FSLogix Profile Container use in your Windows Virtual Desktop workspace.
 Screenshot of the Disk Performance dashboard for Windows Virtual Desktop
Prerequisites
To monitor your ARM-based Windows Virtual Desktop environment, be sure you have the following prerequisites in place:
- Windows Virtual Desktop environment based on ARM (spring 2020 update)
- Log Analytics workspace
- Azure Active Directory Premium P1 or P2 license
- The following role based access control (RBAC) and identity and access manager (IAM) object roles:
Creating a Log Analytics workspace
- Search for Log Analytics and select Log Analytics workspaces.
 Searching for and selecting the Log Analytics workspaces service
- Select Add.
 Adding a Log Analytics workspace
- Name your Log Analytics workspace. Here, we’ve named our workspace wvdmonitorarm.
- Make sure that you are using the Pay-As-You-Go pricing tier.
Note: You can calculate your Azure Monitoring costs upfront using the Azure Monitoring pricing calculator. The price will vary based on the time period required to capture data. For more information on optimizing costs, see Manage usage and costs with Azure Monitor Logs.
- Create the Log Analytics workspace.
 Reviewing and creating the Log Analytics workspace
Enable diagnostics on your Windows Virtual Desktop workspace
- Go to the Windows Virtual Desktop service on Azure and open the components of the service that you want to monitor.
- Select the host pool you want to monitor and open Diagnostic settings.
 Screenshot of pathway to host pool diagnostic settings
- Check the desired log categories to activate them for the host pool.
 Specifying diagnostic settings and sending them to the Log Analytics workspace
- Check Send to Log Analytics and designate the workspace as the destination for diagnostic data.
- Repeat the same steps for Workspaces and Application groups.
Enable virtual machine insights to install the Workspace agent
To install the Workspace agent on the session hosts as part of your Windows Virtual Desktop host pool(s), perform the following steps.
- Search for and select Monitor in Azure services.
 Searching for and selecting Monitor in Azure services
- Select Virtual Machines under Insights.
- Select Not monitored.
- Expand the resource group that contains your Windows Virtual Desktop hosts.
 Screenshot of Monitor page in Azure for Virtual Machines
- Select Enable.
 Screenshot of page during monitoring configuration
The agent will automatically be installed and pushed to the session hosts via Azure extensions. For additional information, see Enable Azure Monitor for VMs overview.
Collect performance counters
- Open the Log Analytics workspace.
- Select Advanced settings.
- Follow the DataWindows Performance Counters path.
Note: Limits on API batches require collecting two batches of performance counters in the Log Analytics workspace.
- Select the + button to add the first 20 performance counters.
Note: To avoid the “BatchRequestsLimitExceeded” error message, add a maximum of 20 counters for each batch.
Batch collection 1
|
Terminal Services Session(*)% Processor Time
|
|
Terminal Services(*)Active Sessions
|
|
Terminal Services(*)Inactive Sessions
|
|
Terminal Services(*)Total Sessions
|
|
LogicalDisk(*)% Free Space
|
|
LogicalDisk(*)Avg. Disk sec/Read
|
|
LogicalDisk(*)Avg. Disk sec/Write
|
|
LogicalDisk(*)Current Disk Queue Length
|
|
LogicalDisk(*)Disk Reads/sec
|
|
LogicalDisk(*)Disk Transfers/sec
|
|
LogicalDisk(*)Disk Writes/sec
|
|
LogicalDisk(*)Free Megabytes
|
|
Processor(_Total)% Processor Time
|
|
Memory(*)% Committed Bytes In Use
|
|
Network Adapter(*)Bytes Received/sec
|
|
Network Adapter(*)Bytes Sent/sec
|
|
Process(*)% Processor Time
|
|
Process(*)% User Time
|
|
Process(*)IO Read Operations/sec
|
- Change the Sample Interval for all counters to 60 seconds.
- Select Save.
 Screenshot of Advanced settings, path to performance counters, and addition of performance counters in the Log Analytics workspace
- Add the second batch of performance counters.
Batch collection 2
|
Process(*)IO Write Operations/sec
|
|
Process(*)Thread Count
|
|
Process(*)Working Set
|
|
RemoteFX Graphics(*)Average Encoding Time
|
|
RemoteFX Graphics(*)Frames Skipped/Second – Insufficient Client Resources
|
|
RemoteFX Graphics(*)Frames Skipped/Second – Insufficient Network Resources
|
|
RemoteFX Graphics(*)Frames Skipped/Second – Insufficient Server Resources
|
|
RemoteFX Network(*)Current TCP Bandwidth
|
|
RemoteFX Network(*)Current TCP RTT
|
|
RemoteFX Network(*)Current UDP Bandwidth
|
|
RemoteFX Network(*)Current UDP RTT
|
- As with the first batch, change the Sample Interval for all counters to 60 seconds.
Note: If you do not change the Sample Interval, you may find that your workspace ingests more data, which can result in unexpected costs.
- Select Save.
Creating a workbook in Azure Monitor
- Go to Azure Monitor.
- Go to Workbooks and create a new workbook in Azure Monitor by selecting New.
 Creating a new workbook in Azure Monitor
- In the blank workbook that appears, select the </> button to access the Code – Advanced Editor.
 Screenshot of blank workbook page ready for code to be added
- Copy the code from this sample into the code area for the workbook, replacing the sample code in this workbook: https://github.com/wvdcommunity/AzureMonitor/blob/master/wvd-springrelease-workbook.json
- Select Apply.
 Applying code for the workbook
- Select the Done editing button in the Monitor Workbooks dashboard.
- The log information will fill the custom workbook as shown below.
 Screenshot of the Windows Virtual Desktop dashboard with workbook insights
- Name and save the workbook. (In the example below, we’ve named the workbook Windows Virtual Desktop).
 Naming and saving the Monitor workbook
- Select the SignInLogs diagnostic setting in Azure Active Directory to activate the Logon Location Heatmap diagnostic data.
Note: If you skip activating the Logon Location Heatmap diagnostic data, the error message shown below will appear. For more details, see Integrate Azure AD logs with Azure Monitor logs.
 View of error message “No logons detected in the last 7 days”
Sample queries
Now that you’ve enabled diagnostic data, here are some sample queries you can run.
Current active sessions
Perf
| where ObjectName == "Terminal Services"
| where CounterName == "Active Sessions"
| summarize arg_max(TimeGenerated, *) by Computer
| project Computer, CounterName, CounterValue
Current disconnected sessions
Perf
| where ObjectName == "Terminal Services"
| where CounterName == "Inactive Sessions"
| summarize arg_max(TimeGenerated, *) by Computer
| project Computer, CounterName, CounterValue
Current total sessions
Perf
| where ObjectName == "Terminal Services"
| where CounterName == "Total Sessions"
| summarize arg_max(TimeGenerated, *) by Computer
| project Computer, CounterName, CounterValue
Average and maximum sessions
Perf
| where ObjectName == "Terminal Services"
| where CounterName == "Total Sessions"
| summarize AggregatedValue = avg(CounterValue) by bin(TimeGenerated, 1h), Computer
Perf
| where ObjectName == "Terminal Services"
| where CounterName == "Total Sessions"
| summarize AggregatedValue = max(CounterValue) by bin(TimeGenerated, 1h), Computer
Session duration per user
let Events = WVDConnections | where UserName == 'username';
Events
| where State == "Connected"
| project CorrelationId , UserName, ResourceAlias , StartTime=TimeGenerated
| join (Events
| where State == "Completed"
| project EndTime=TimeGenerated, CorrelationId)
on CorrelationId
| project Duration = EndTime - StartTime, ResourceAlias
| sort by Duration desc
CPU, memory, disk, network usage per host
Logical disk:
Perf
| where ObjectName == "LogicalDisk" and CounterName == "% Free Space"
| where InstanceName <> "_Total"
| summarize AggregatedValue = avg(CounterValue) by bin(TimeGenerated, 10m), Computer, InstanceName
Processor:
Perf
| where ObjectName == "Processor" and CounterName == "% Processor Time"
| summarize AggregatedValue = avg(CounterValue) by bin(TimeGenerated, 10m), Computer, InstanceName
Memory:
Perf
| where ObjectName == "Memory" and CounterName == "% Committed Bytes In Use"
| summarize AggregatedValue = avg(CounterValue) by bin(TimeGenerated, 10m), Computer, InstanceName
Network:
Perf
| where ObjectName == "Network Interface"
| summarize AggregatedValue = avg(CounterValue) by bin(TimeGenerated, 10m), Computer, InstanceName, CounterName
Processor utilization per user:
Perf
| where ObjectName == "Process"
| join
(
VMProcess
| where UserName !contains "system" and UserName !contains "service"
| extend InstanceName = ExecutableName
| project TimeGenerated, InstanceName, Computer, UserName, UserDomain
)
on InstanceName
| summarize AggregatedValue = avg(CounterValue) by bin(TimeGenerated, 10m), InstanceName, CounterName, UserName, Computer
Inbound/outbound network bytes per user
VMConnection
| join
(
VMProcess
| where UserName !contains "system" and UserName !contains "service"
| extend ProcessName = ExecutableName
| project TimeGenerated, ProcessName, Computer, UserName, UserDomain
)
on ProcessName
RTT perf counter for RDP
Perf
| where ObjectName == "RemoteFX Network"
| where CounterName == "Current TCP RTT" or CounterName == "Current UDP RTT"
| summarize AggregatedValue = avg(CounterValue) by bin(TimeGenerated, 1h), Computer, InstanceName
Windows Virtual Desktop client type distribution
WVDConnections
| where State == "Connected"
| summarize ClientCount = dcount(UserName) by ClientOS, ClientVersion
Client types
WVDConnections
| where State == "Connected"
| extend ClientOSType = pack("ClientOSVersion", ClientOS)
| summarize AggregatedValue = count() by ClientOS
Windows Virtual Desktop agent health status
Heartbeat
| summarize heartbeat_count = count() by bin(TimeGenerated, 30m), Computer // bin is used to set the time grain to 30 minutes
| extend Available=iff(heartbeat_count > 0, true, false)
| summarize LastCall = max(TimeGenerated) by Computer, alive
| project Computer, LastCall, alive
Daily active users
Perf
| where ObjectName contains "Terminal Services" and CounterName == "Total Sessions"
| summarize TotalSessions = max(CounterValue) by bin(TimeGenerated, 1d), Computer
Top 10 hosts by CPU utilization
Perf
| where ObjectName == "Processor" and CounterName == "% Processor Time"
| summarize AggregatedValue = avg(CounterValue) by bin(TimeGenerated, 1h), Computer
| where AggregatedValue > 80
| order by AggregatedValue desc
| take 10
Disk performance
Perf
| where ObjectName == "PhysicalDisk" and CounterName == "Avg. Disk Bytes/Read" and InstanceName !contains "Total"
| parse InstanceName with * " " DriveLetter
| summarize AggregatedValue = avg(CounterValue) by bin(TimeGenerated, 10m), Computer, DriveLetter
Add the Windows Virtual Desktop workbook your Azure dashboard
Creating a custom dashboard as a landing page for your Azure portal is beneficial. This dashboard can also be used as a central page for your IT department.
- Open the custom Windows Virtual Desktop workbook you created in Azure Monitor.
- Select the pin buttons for the views you want to add to your Azure dashboard.
 Pinning views of monitoring data to the dashboard
- You can add all views at one time by selecting Pin Workbook in editing mode.
- When you are finished pinning the workbook, select Done Pinning.
 Selecting Done Pinning button
- Select the Dashboard menu.
 Selecting the Dashboard to prepare for personalizing it with resource tiles
- Arrange the resource tiles to personalize the dashboard.
- Select Done customizing,
 Arranging resource tiles on the Windows Virtual Desktop Workspace Dashboard
This is an example of a workspace dashboard with tiles arranged:
 Screenshot of a Windows Virtual Desktop Workspace Dashboard with resource tiles arranged
- Select the Auto refresh interval for the dashboard. Log Analytics metrics will refresh at the same rate as the dashboard.
- Select Apply.
 Selecting and applying refresh intervals for the dashboard
Learn more
If you run into issues during setup, see Troubleshooting overview, feedback, and support for more information.
To stay informed about the latest Windows Virtual Desktop enhancements, join the Windows Virtual Desktop community on Tech Community, where you can also connect with the Windows Virtual Desktop Engineering team and your fellow public preview participants. For more information on tools that can help you empower end users to work securely in a remote work world, see Brad Anderson’s post on New tools to help IT empower employees securely in a remote work world.
This blog post, which comes from a collaboration of different teams within Microsoft, aims to empower our customers on the ARM-based Windows Virtual Desktop. The information in this post is community driven. Nothing is officially launched by the Windows Virtual Desktop product team. I want to highlight @VanessaBruwer, @JasonByway and @ThomasVuylsteke at Microsoft for their work creating the custom workbook.
We welcome your feedback, comments, and questions below.

by Scott Muniz | Jul 8, 2020 | Uncategorized
This article is contributed. See the original author and article here.

In this weekly discussion of latest news and topics around Microsoft 365, hosts – Vesa Juvonen (Microsoft), Waldek Mastykarz (Rencore), are joined by Dan Wahlin – MVP and now Microsoft employee as a Microsoft 365 Cloud Developer Advocate on the new Microsoft 365 Cloud Developer Advocate team.
What is a Cloud Developer Advocate? The bridge between customers & partners and Microsoft 365 & Azure teams. The role advocates for customers, creates learning plans beyond “Hello World” basics, code samples, videos… Dan will focus largely on Fluid Framework. Do you have what it takes to be a Cloud Developer Advocate? If you can admit you don’t know it all and are not afraid of putting yourself out there as speaker, writer, sample developer and community participant, then you might have the right stuff. Additionally, in this episode, 17 recently released articles from Microsoft and the PnP Community are highlighted.
This episode was recorded on Monday, July 6, 2020.
Did we miss your article? Please use #PnPWeekly hashtag in the Twitter for letting us know the content which you have created.
Sharing is caring!

Recent Comments