by Scott Muniz | Jul 28, 2020 | Uncategorized
This article is contributed. See the original author and article here.
Digital clutter is an ever-increasing challenge. It’s one of the reasons why modern life feels so busy and chaotic. Microsoft To Do is committed to providing a complete task management solution that keeps people at the center. To Do helps people focus on and keep track of what matters, in work and in life. Our 3 key promises are: 1) collect tasks from different sources, 2) show urgent and important tasks, and 3) help users complete them (coming soon).
To fulfil our first promise, we’re integrating To Do with the Microsoft 365 suite of applications and making it available in key user workflows. Following up on the full Outlook/To Do integration, Tasks in Teams is rolling out today and will continue through Septermber. With this launch, To Do is now available in Microsoft Teams .
To Do is already integrated with Planner – tasks assigned to you in Planner boards show up in the “Assigned to you” list. To Do is also available in Microsoft Launcher and any task added via Cortana gets added to To Do. By Q121, we will support @mentions in Excel, Word, and PowerPoint, which means that whenever someone @mentions you, the tasks you’re mentioned in will automatically appear in your “Assigned to you” smart list. We’re also working on adding your reading lists from Edge as tasks. More integrations are on the way to make To Do the place for all your tasks.
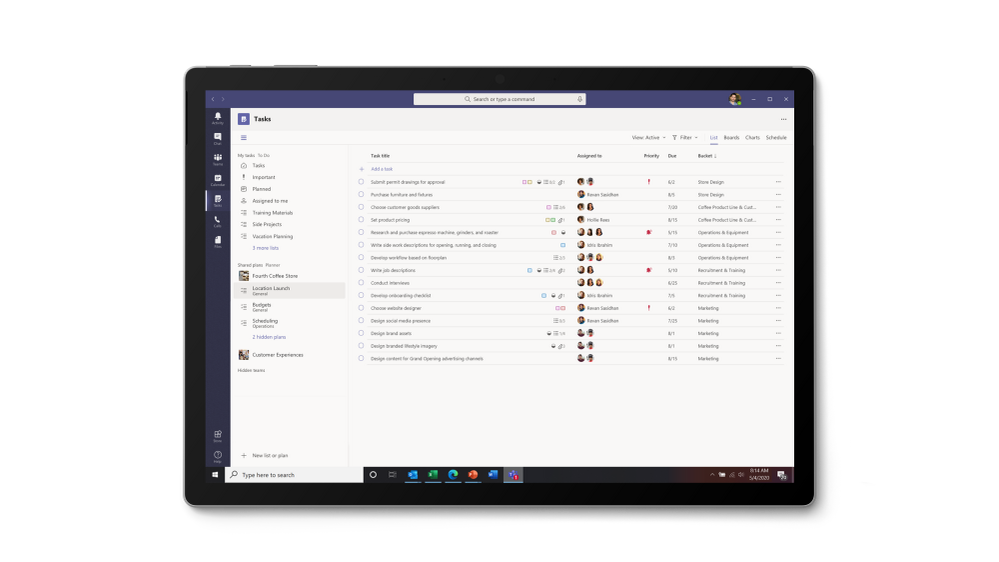
 Tasks in Teams provide consolidated view of your To Do and Planner tasks
To Do is much more than a to-do list organizer. It’s an intelligent fabric that collects and connects tasks across the Microsoft 365 suite of applications. For example, the Insights add-in program for Outlook extracts important commitments or follow-ups from your Outlook messages and, with a click, adds them to To Do. In addition, the My Day smart list has task suggestions collected from across Microsoft 365 to help you prioritize and complete important tasks for your day. Moreover, you can also share lists with coworkers to get more done together. You can easily switch to your personal account and organize your tasks outside of work.
 Quick access to To Do tasks is live for Outlook Web users
To Do is built on the Microsoft Exchange platform, and it meets all security and privacy standards by design like your Outlook inbox. Organization admins can easily grant or remove access to To Do for their employees. We imagine a future where all your tasks in Microsoft 365 apps are collected automatically in To Do so you can focus on what matters and save time every day.

To Do complies with information governance and eDiscovery features of Office 365
We’ll post updates just like this on the Tech Community blog to let you know about new features that you can try in To Do. Check back here for regular posts and check out our Release Notes for more information about updates and fixes. In the meantime, we want to hear from you! Tell us what you think about the Teams integration and let us know what you’re looking forward to next via UserVoice or write to us (todofeedback@microsoft.com).
by Scott Muniz | Jul 28, 2020 | Uncategorized
This article is contributed. See the original author and article here.
Making security easy to use is crucial because hard-to-use security is likely to be neglected entirely. SCRAM with channel binding is a variation of password authentication that is almost as easy to use, but much more secure.
In basic password authentication, the connecting client simply sends the server the password. Then the server checks that it’s the right one, and allows the client to connect. Basic password authentication has several weaknesses which are addressed with SCRAM and channel binding.
In this article, I’ll show you how to set up authentication using SCRAM with channel binding. I implemented the client connection parameter channel_binding in PostgreSQL 13, due to be released in late 2020 (PostgreSQL 13 is in beta now). SCRAM and Channel Binding have already been supported in several releases, but this new connection parameter is necessary to realize the security benefits of SCRAM and Channel Binding.
First, before diving in to the tutorial, some background on SCRAM and Channel Binding.
Disclaimer: This article is just a how-to. As with any security decision, you should perform your own analysis to determine if it’s right for your environment. No security feature is right in all cases.
The SCRAM authentication method in Postgres
SCRAM is a secure password authentication protocol that can authenticate the client. It has several advantages over basic password authentication:
- does not reveal the user’s cleartext password to the server
- is designed to prevent replay attacks
- enables the use of Channel Binding (see next section)
- can support multiple cryptographic hash functions
- currently, PostgreSQL only supports SCRAM using SHA-256
For these reasons, in PostgreSQL, the scram-sha-256 password auth method is strongly recommended over md5 or password.
The first part of this tutorial can be used to set up SCRAM even if you don’t use channel binding.
Channel Binding with SCRAM
In many cases, it’s just as important for the client to authenticate the server, as it is for the server to authenticate the client; this is called mutual authentication. Without mutual authentication, the server could be a malicious imposter or you could be exposed to a MITM attack.
Channel Binding is a feature of the SCRAM protocol that allows mutual authentication over an SSL connection, even without a Certificate Authority (which is useful, since it can be difficult to configure a Certificate Authority in some environments).
It is not recommended to rely on Channel Binding if using clients earlier than version 13.
When using channel binding, you should specify channel_binding=require in the connection string (see connection parameters), which tells the client to demand channel binding before the connection succeeds. Alternatively (or additionally), you can set the PGCHANNELBINDING environment variable to require. Without one of these options set, the client may not adequately authenticate the server, undermining the purpose of channel binding.
How to know if your client supports the channel_binding parameter
First, determine the client driver that your application is using. Typically, the client driver will depend on the language you are using, and you can find it on this list of client drivers . If your client driver is listed as using libpq (the official PostgreSQL client library), that means that it will support the channel_binding connection parameter as long as you are using at least version 13 of libpq. libpq ordinarily comes from an operating system package; for instance, on Ubuntu, look at the version of the package postgresql-client.
If your driver does not use libpq, it may still support the new connection parameter; consult your driver’s documentation for details. For instance, rust-postgres supports the channel_binding connection parameter even though it doesn’t use libpq.
Tutorial on setting up SCRAM with channel binding in PostgreSQL 13
1. Initial Postgres Setup
- Install the Postgres 13 beta and make sure the newer versions of the
postgres and psql binaries are in your PATH. If compiling from source, be sure to use the --with-openssl option.
- Run
initdb -D data -k to initialize a new data directory
pg_ctl -D data -l logfile start to start the server- Make sure you can connect:
psql "host=localhost dbname=postgres user=myuser"
- Type
q at the prompt to quit
pg_ctl -D data stop
2. Configure for SCRAM authentication and safely add a user
- Edit
data/postgresql.conf and add the line password_encryption = scram-sha-256 at the bottom.
- Edit
data/pg_hba.conf to set at least one authentication method to safely use for an initial superuser connection. This is needed to set up at least one user with a SCRAM password, see pg_hba.conf documentation to see the options. In my environment, allowing local connections with trust is secure enough for the initial setup:
- Start Postgres:
pg_ctl -D data -l logfile start
createuser -P myuser
- May need to supply additional options if not using a
local connection.
createuser has important advantages over using manual SQL commands from psql to create the user:
- It prompts for the password, so the plain text password never ends up in the process title, the shell history, or the psql history.
- It cryptographically hashes the password before sending it to the server, so that the server never sees the plaintext password.
- Stop Postgres:
pg_ctl -D data stop
3. Configure pg_hba.conf
Edit pg_hba.conf, and make sure to create an entry that allows TCP/IP connections (one of the records that begins with host...), otherwise SSL won’t be used and Channel Binding won’t work.
Here’s the pg_hba.conf that I’m using for this demo:
host    all             all             127.0.0.1/32            scram-sha-256
host    all             all             ::1/128                 scram-sha-256
You may consider using hostssl instead to reject non-SSL connections. I am allowing non-SSL connections to demonstrate connection failures that can happen when channel binding is required but SSL is off.
If you only allow connections using scram-sha-256, then all users must have a SCRAM password set, or they won’t be able to connect.
4. Start the server and verify that you can connect using SCRAM
pg_ctl -D data -l logfile startpsql "host=localhost dbname=postgres user=myuser"
pg_ctl -D data stop
5. Configure SSL and require channel binding
NOTE: generate the SSL key and certificate according to the best practices in your organization; the instructions below are just for demonstration purposes.
- Generate key and cert:
openssl req -newkey rsa:2048 -nodes -keyout server.key -x509 -days 365 -out server.crt
chmod 400 server.keymv server.key data/mv server.crt data/- Edit
data/postgresql.conf and add the line ssl = on at the bottom.
6. Connect to the server
Make sure you follow the directions to configure pg_hba.conf above.
pg_ctl -D data -l logfile startpsql "host=localhost dbname=postgres user=myuser sslmode=disable"
- should prompt for password and succeed
psql "host=localhost dbname=postgres user=myuser sslmode=require"
- should prompt for password and succeed
psql "host=localhost dbname=postgres user=myuser sslmode=disable channel_binding=require"
- should prompt for password and then fail because channel binding requires SSL; but we have disabled SSL and required channel binding
psql "host=localhost dbname=postgres user=myuser sslmode=require channel_binding=require"
- should prompt for password and succeed
pg_ctl -D data stop
Note that SCRAM in general does not require SSL to be used, but Channel Binding does require SSL.
7. Always Require Channel Binding
Edit your environment to set PGCHANNELBINDING=require so that all clients connecting will require channel binding.
How Channel Binding relates to a Certificate Authority
Note that we didn’t have to configure a Certificate Authority (CA) . A CA is another way for the client to authenticate the server, but it can be difficult to set up and maintain in some environments.
But if you do have a CA in your environment, you can combine it with SCRAM and Channel Binding to authenticate the server based on two separate mechanisms (which can enhance security in case one is compromised). To do so, set sslmode=verify-full or sslmode=verify-ca along with channel_binding=require in your connection parameters.
You can also use the clientcert auth option in pg_hba.conf, to tell the server to verify the client’s certificate against the CA. But note that this auth option doesn’t verify that the CN of the client certificate matches the connecting username (to do that, you need to use the cert auth method, which means you aren’t using SCRAM or any other password authentication).
Importance of the client connection parameter
It’s important to set channel_binding=require in your connection string, otherwise the client may be fooled into not performing Channel Binding at all, and thus not authenticating the server.
The PostgreSQL authentication protocol and libpq were primarily designed around the server authenticating the client (i.e. the server doesn’t trust the client). But the client implicitly trusts the server, attempting to authenticate itself using any mechanism the server requests, and establishing the connection as soon as the server is satisfied. Methods to authenticate the server require the client to explicitly demand them—for instance, by setting sslmode=verify-full in the connection string. Channel Binding is no different: you need to set channel_binding=require.
If this step is neglected, then all a malicious server needs to do to draw in an unsuspecting client is to immediately send an AuthenticationOk message, indicating that the server is satisfied with the connecting client. The client will skip the SCRAM protocol entirely (including Channel Binding), connect to the server, and could begin issuing queries that contain sensitive data to this malicious server.
Or worse, without channel_binding=require, the server could instead send an AuthenticationCleartextPassword message. The client will respond by (you guessed it!) sending the server the cleartext password, even though the user had otherwise configured SCRAM, and thought that at least their cleartext password was safe. This not only undermines Channel Binding, it undermines the entire purpose of SCRAM.
Use SCRAM and remember to set channel_binding=require
SCRAM is a huge improvement over traditional password authentication, and SCRAM with channel binding is even better. But as we can see, PostgreSQL users need to be careful to use it correctly to get the full benefit.
Setting channel_binding=require (or at least setting the environment variable PGCHANNELBINDING to require) is a critical step to protect yourself against certain kind of attacks, and it is available with PostgreSQL client version 13.
About the Author
I am on the Postgres team at Microsoft, and I’m also a PostgreSQL committer. See Microsoft Azure Welcomes PostgreSQL Committers, which introduces me along with fellow committers Andres Freund, Thomas Munro, and David Rowley.

by Scott Muniz | Jul 27, 2020 | Uncategorized
This article is contributed. See the original author and article here.
In this two-part series, we’re going to look at how we can manage SharePoint using PowerShell. This is highly focused on SharePoint Online, but if the cmdlets are available, it also applies to SharePoint on-premises. We’ll start with the basics, and then get some real-world scenarios scripts in part 2 to get you started with your daily management tasks. I’ll also you give some tips along the way to make your life easier.
Let me start by asking this: Have you ever been curious enough to look at how many SharePoint on-premises PowerShell cmdlets are available? If not, I can tell you there are 800+ of them. Now, have you been curious enough to look at how many PowerShell cmdlets are available to manage SharePoint Online?

Well, that’s a big drop isn’t it?! In SharePoint on-premises, there are a lot of commands to configure Search, Service Applications, interact with SQL databases, or other features provided by SharePoint.
With SharePoint Online, we don’t need to do all that. Microsoft manages everything, and we don’t need to worry about databases for instance.
So, what now?
There is another PowerShell module out there… And if you’ve never heard of it, you’re totally missing out!
SharePoint PowerShell PnP (Patterns & Practices) is a module created by a community member (Erwin Van Hunen, MVP) to fill a gap in the management of SharePoint when using only PowerShell.
Currently, there are 492 cmdlets available (v.3.23.2007.1) and the prefix used is ‘PnP’ (i.e.: Get-PnPList).
If you don’t have a native cmdlet, you can still use Client-Side Object Model (CSOM), or Server-Side Object Model (SSOM). However, as administrators, we might know PowerShell, but not be proficient in the other methods.
Note: In this module, you’ll also notice that there are Microsoft Teams cmdlets, which are starting to surface with the July 2020 version!
How can I use it?
To start benefiting from this great module, we first need to install it. We have a few ways to do that.
- Download the .msi
- Install from the PowerShell Gallery
This module is available for SharePoint 2013/2016/2019, and SharePoint Online. It’s important to refer to the official documentation because some commands might be available for a module but not the other.
Once installed with your favorite method, we need to connect to SharePoint Online (make sure you’ve got at least the SharePoint admin role assigned). Depending on the action we want to perform, we can connect to the SharePoint Admin Center, or to a particular site. At its most basic form, connecting would look like this:
$creds = Get-Credential
Connect-PnPOnline -Url "https//<TENANT-NAME>.sharepoint.com/sites/<YOUR-SITE>" -Credential $creds
Spoiler (Highlight to read)
Want a tip? If you enter your credentials in your Windows Credential Manager under “Windows Credentials –> Add a generic credential”, you won’t need to use the -Credential parameter!
Want a tip? If you enter your credentials in your Windows Credential Manager under “Windows Credentials –> Add a generic credential”, you won’t need to use the -Credential parameter!
If your account has multi-factor authentication (MFA) enabled, use the -UseWebLogin parameter. I’d encourage you to visit the Connect-PnPOnline documentation because there are plenty of other ways to connect!
Connect to the SharePoint Admin Center
Depending on which site you’re connected to, you get different results. What I mean is, by connecting to the SharePoint Admin Center you won’t be able to interact much with library content, or fields. But connecting to the Admin Center can give us information about the tenant settings.
Let’s connect to the Admin Center, and run Get-PnPTenant to get some information at the tenant level.
Connect-PnPOnline -Url "https://m365x141782-admin.sharepoint.com/"
Get-PnPTenant

As we are connected to the top-level site (admin one), we can also get all our site collections using the Get-PnPTenantSite cmdlet.
Connect to a Specific SharePoint Site
This is where you’re going to send most of your requests. Use the following to connect to your target site:
Connect-PnPOnline -Url "https://m365x141782.sharepoint.com/sites/Contoso"
Again here, I’m not using the -Credential parameter because my credentials are stored in the Credential Manager on my machine.
Spoiler (Highlight to read)
Want a Tip? If you ever forget on which site you’re connected to, you can run `Get-PnPContext`, and look at the ‘Url’ property.
Want a Tip? If you ever forget on which site you’re connected to, you can run `Get-PnPContext`, and look at the ‘Url’ property.
That’s it for this first part. Part 2 will explore how to interact with sites content! Stay tuned.
by Scott Muniz | Jul 27, 2020 | Uncategorized
This article is contributed. See the original author and article here.
We were recently alerted to an issue whereby a device in the Microsoft Endpoint Manager admin console was showing “failed” for their Windows Update status.
Upon investigation, we discovered that the device was not missing any updates – everything had successfully applied. However, we did find two error codes on the device, which then were calculated by Intune as “failed”. After the policy was re-evaluated, then the device returned to healthy.
Here’s the steps we took to replicate this experience:
- Create a basic Windows Update ring policy and apply to Windows 10 devices.
- Trigger a check for updates and refresh the device.
- Download Psexec.exe
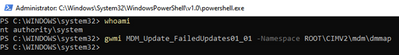
- Run psexec /sid PowerShell.exe from an elevated command prompt or elevated PowerShell window. A new PowerShell instance will open, running in system context.
- Run the following command in the system-context PowerShell window you created in step 4:
gwmi MDM_Update_FailedUpdates01_01 -Namespace ROOTCIMV2mdmdmmap
If nothing is returned, the device does not currently have a failed update.
If Windows Update returns one of the two error codes as you can see on the device, then you’ll see “failed” in the console:
HResult : -2145082874
InstanceID : ec67ed82-8cf6-4fa9-86bf-efdb4e7b5d00
ParentID : ./Vendor/MSFT/Update/FailedUpdates
State :
HResult : -2145082858
InstanceID : 33e3f18f-c868-4d00-8266-01c100acf444
ParentID : ./Vendor/MSFT/Update/FailedUpdates
State :
These two error codes are specific to Windows Update being too busy. It’s rare, but there are times that the service will return these codes. If you run into this, both the Intune policy refresh and then likely the Windows Update policy refresh will need to trigger to ensure policy is evaluated and updated. For more info on Intune policy refresh timelines, see:
https://docs.microsoft.com/mem/intune/configuration/device-profile-troubleshoot#how-long-does-it-take-for-devices-to-get-a-policy-profile-or-app-after-they-are-assigned
Follow Intune Support as a Feature on Twitter as @intunesuppteam for helpful articles, release info, and more!
by Scott Muniz | Jul 27, 2020 | Alerts, Microsoft, Technology, Uncategorized
This article is contributed. See the original author and article here.
Prerequisites
Before you start the Lab please ensure you have the below
- Azure subscription with authorization to create an HDInsight HBase cluster.
- Access to an SSH client like Putty(Windows) /Terminal(Macbook)
Provision HDInsight HBase cluster with Azure Management Portal
To provision HDInsight HBase with the new experience on Azure Management Portal, perform the below steps.
-
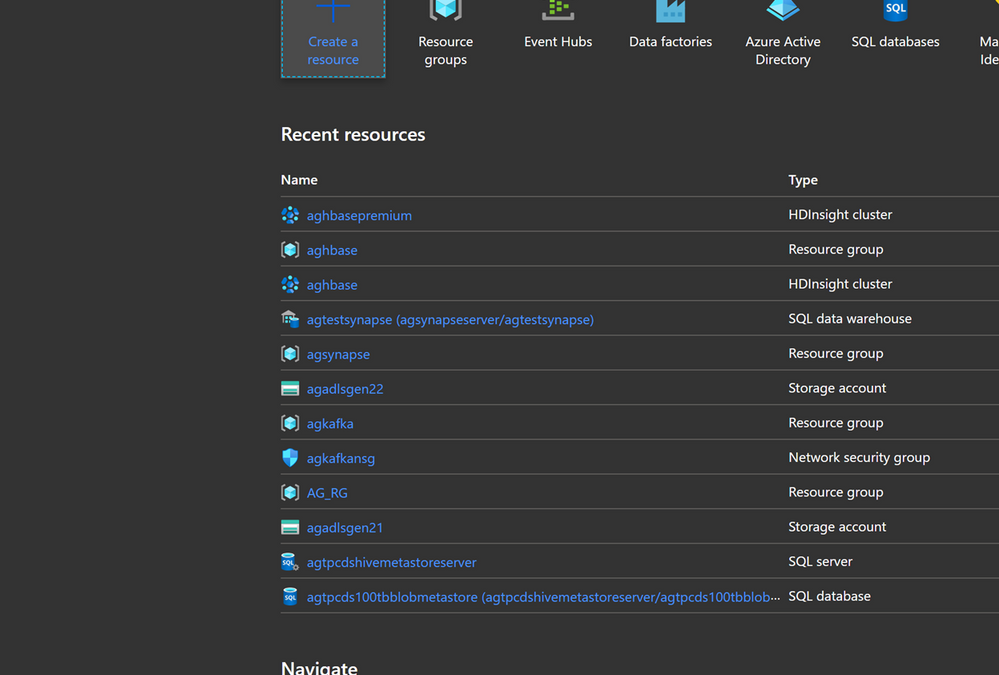
Go to the Azure Portal portal.azure.com. Login using your azure account credentials.

- We would start with creating a Premium Block Blob Storage Account. From the New Page , click on Storage Account.

In the Create Storage Account page populate the below fields.
-
Subscription: Should be autopopulated with the subscription details
-
Resource Group: Enter a resource group for holding your HDInsight HBase deployment
-
Storage account name: Enter a name for your storage account for use in the premium cluster.
-
Region: Enter the name of the region of deployment(ensure that cluster and storage account are in the same region)
-
Performance : Premium
-
Account kind : BlockBlobStorage
-
Replication : Locally-redundant storage(LRS)
-
Cluster login username:Enter username for cluster administrator(default:admin)

- Leave all other tabs at default and click on Review+create to create the storage account.
- After the storage account is created click on Access Keys on the left and copy key1 . We would use this later in the cluster creation process.

- Lets now start deploying an HDInsight HBase cluster with Accelerated writes. Select Create a resource -> Analytics -> HDInsight

On the Basics Tab populate the below fields towards the creation of an HBase cluster.
-
Subscription: Should be autopopulated with the subscription details
-
Resource Group: Enter a resource group for holding your HDInsight HBase deployment
-
Cluster Name: Enter the cluster name. A green tick will appear if the cluster name is available.
-
Region: Enter the name of the region of deployment
-
Cluster Type : Cluster Type – HBase Version- HBase 2.0.0(HDI 4.0)
-
Cluster login username:Enter username for cluster administrator(default:admin)
-
Cluster login password:Enter password for cluster login(default:sshuser)
-
Confirm Cluster login password: Confirm the password entered in the last step
-
Secure Shell(SSH) username: Enter the SSH login user (default:sshuser)
-
Use cluster login password for SSH: Check the box to use the same password for both SSH logins and Ambari Logins etc.

Click Next : Storage to launch the Storage Tab and populate the below fields
- Primary Storage Type: Azure Storage.
- Selection Method: Choose Radio button Use access key
- Storage account name: Enter the name of the Premium Block Blob storage account created earlier
- Access Key:Enter the key1 access key you copied earlier
- Container: HDInsight should propose a default container name. You could either choose this or create a name of your own.

- Leave the rest of the options untouched and scroll down to check the checkbox Enable HBase accelerated writes. (Note that we would later be creating a second cluster without accelerated writes using the same steps but with this box unchecked.)

-
Leave the Security+Networking blade to its default settings with no changes and go to the Configuration+pricing tab.
-
In the Configuration+pricing tab, note the Node configuration section now has a line Item titled Premium disks per worker node.
-
Choose the Region node to 10 and Node Size to DS14v2(you could chooser smaller number and size also but ensure that the both clusters have identical number of nodes and VM SKU to ensure parity in comparison)

-
Click Next: Review + Create
-
In the Review and Create tab , ensure that HBase Accelerated Writes is Enabled under the Storage section.`

Repeat the same steps again to create a second HDInsight HBase cluster , this time without Accelerated writes. Note the below changes
-
- Use a normal blob storage account that is recommended by default
- Keep the Enable Accelerated Writes checkbox unchecked on the Storage tab.

- In the Configuration+pricing tab for this cluster , note that the Node configuration section does NOT have a Premium disks per worker node line item.
- Choose the Region node to 10 and Node Size to D14v2.(Also note the lack of DS series VM types like earlier)

- Click Create to start deploying the second cluster without Accelerated Writes.
- Now that we are done with cluster deployments , in the next section we would set up and run YCSB tests on both these clusters.
Setup and run YCSB tests on the clusters
Login to HDInsight shell
-
Steps to set up and run YCSB tests on both clusters are identical.
-
On the cluster page on the Azure portal , navigate to the SSH + Cluster login and use the Hostname and SSH path to ssh into the cluster. The path should have below format.
ssh <sshuser>@<clustername>.azurehdinsight.net

Create the Table
-
Run the below steps to create the HBase tables which will be used to load the datasets
-
Launch the HBase Shell and set a parameter for the number of table splits. Set the table splits (10 * Number of Region Servers)
-
Create the HBase table which would be used to run the tests
-
Exit the HBase shell
hbase(main):018:0> n_splits = 100
hbase(main):019:0> create 'usertable', 'cf', {SPLITS => (1..n_splits).map {|i| "user#{1000+i*(9999-1000)/n_splits}"}}
hbase(main):020:0> exit
Download the YSCB Repo
- Download the YCSB repository from the below destination
$ curl -O --location https://github.com/brianfrankcooper/YCSB/releases/download/0.17.0/ycsb-0.17.0.tar.gz
- Unzip the folder to access the contents
$ tar xfvz ycsb-0.17.0.tar.gz
- This would create a ycsb-0.17.0 folder. Move into this folder
Run a write heavy workload in both clusters
- Use the below command to initiate a write heavy workload with the below parameters
- workloads/workloada : Indicates that the append workload workloada needs to be run
- table: Populate the name of your HBase table created earlier
- columnfamily: Populate the value of the HBase columfamily name from the table you created
- recordcount : Number of records to be inserted( we use 1 Million)
- threadcount: Number of threads( this can be varied, but needs to be kept constant across experiments)
- -cp /etc/hbase/conf: Pointer to HBase config settings
- -s | tee -a : Provide a file name to write your output.
bin/ycsb load hbase12 -P workloads/workloada -p table=usertable -p columnfamily=cf -p recordcount=1000000 -p threadcount=4 -cp /etc/hbase/conf -s | tee -a workloada.dat
- Run the write heavy workload to load 1 million rows into previously created HBase table.
Ignore the warnings that you may see after submitting the command.
HDInsight HBase with accelerated writes
$ bin/ycsb load hbase12 -P workloads/workloada -p table=usertable -p columnfamily=cf -p recordcount=1000000 -p threadcount=4 -cp /etc/hbase/conf -s | tee -a workloada.dat

2020-01-10 16:21:40:213 10 sec: 15451 operations; 1545.1 current ops/sec; est completion in 10 minutes [INSERT: Count=15452, Max=120319, Min=1249, Avg=2312.21, 90=2625, 99=7915, 99.9=19551, 99.99=113855]
2020-01-10 16:21:50:213 20 sec: 34012 operations; 1856.1 current ops/sec; est completion in 9 minutes [INSERT: Count=18560, Max=305663, Min=1230, Avg=2146.57, 90=2341, 99=5975, 99.9=11151, 99.99=296703]
....
2020-01-10 16:30:10:213 520 sec: 972048 operations; 1866.7 current ops/sec; est completion in 15 seconds [INSERT: Count=18667, Max=91199, Min=1209, Avg=2140.52, 90=2469, 99=7091, 99.9=22591, 99.99=66239]
2020-01-10 16:30:20:214 530 sec: 988005 operations; 1595.7 current ops/sec; est completion in 7 second [INSERT: Count=15957, Max=38847, Min=1257, Avg=2502.91, 90=3707, 99=8303, 99.9=21711, 99.99=38015]
...
...
2020-01-11 00:22:06:192 564 sec: 1000000 operations; 1792.97 current ops/sec; [CLEANUP: Count=8, Max=80447, Min=5, Avg=10105.12, 90=268, 99=80447, 99.9=80447, 99.99=80447] [INSERT: Count=8512, Max=16639, Min=1200, Avg=2042.62, 90=2323, 99=6743, 99.9=11487, 99.99=16495]
[OVERALL], RunTime(ms), 564748
[OVERALL], Throughput(ops/sec), 1770.7012685303887
[TOTAL_GCS_PS_Scavenge], Count, 871
[TOTAL_GC_TIME_PS_Scavenge], Time(ms), 3116
[TOTAL_GC_TIME_%_PS_Scavenge], Time(%), 0.5517505152740692
[TOTAL_GCS_PS_MarkSweep], Count, 0
[TOTAL_GC_TIME_PS_MarkSweep], Time(ms), 0
[TOTAL_GC_TIME_%_PS_MarkSweep], Time(%), 0.0
[TOTAL_GCs], Count, 871
[TOTAL_GC_TIME], Time(ms), 3116
[TOTAL_GC_TIME_%], Time(%), 0.5517505152740692
[CLEANUP], Operations, 8
[CLEANUP], AverageLatency(us), 10105.125
[CLEANUP], MinLatency(us), 5
[CLEANUP], MaxLatency(us), 80447
[CLEANUP], 95thPercentileLatency(us), 80447
[CLEANUP], 99thPercentileLatency(us), 80447
[INSERT], Operations, 1000000
[INSERT], AverageLatency(us), 2248.752362
[INSERT], MinLatency(us), 1120
[INSERT], MaxLatency(us), 498687
[INSERT], 95thPercentileLatency(us), 3623
[INSERT], 99thPercentileLatency(us), 7375
[INSERT], Return=OK, 1000000
Explore the outcome of the test – Accelerated writes and Regular
- The test took 538663(8.97 Minutes) milliseconds to run
- Return=OK, 1000000 indicates that all 1 Million inputs were were successfully written, **
- Write throughput was at 1856 operations per second
- 95% of the inserts had a latency of 3389 milliseconds
- Few inserts took more time , perhaps they were blocked by region severs due to the high workload
HDInsight HBase without accelerated writes
2020-01-10 23:58:20:475 2574 sec: 1000000 operations; 333.72 current ops/sec; [CLEANUP: Count=8, Max=79679, Min=4, Avg=9996.38, 90=239, 99=79679, 99.9  =79679, 99.99=79679] [INSERT: Count=1426, Max=39839, Min=6136, Avg=9289.47, 90=13071, 99=27535, 99.9=38655, 99.99=39839]
[OVERALL], RunTime(ms), 2574273
[OVERALL], Throughput(ops/sec), 388.45918828344935
[TOTAL_GCS_PS_Scavenge], Count, 908
[TOTAL_GC_TIME_PS_Scavenge], Time(ms), 3208
[TOTAL_GC_TIME_%_PS_Scavenge], Time(%), 0.12461770760133055
[TOTAL_GCS_PS_MarkSweep], Count, 0
[TOTAL_GC_TIME_PS_MarkSweep], Time(ms), 0
[TOTAL_GC_TIME_%_PS_MarkSweep], Time(%), 0.0
[TOTAL_GCs], Count, 908
[TOTAL_GC_TIME], Time(ms), 3208
[TOTAL_GC_TIME_%], Time(%), 0.12461770760133055
[CLEANUP], Operations, 8
[CLEANUP], AverageLatency(us), 9996.375
[CLEANUP], MinLatency(us), 4
[CLEANUP], MaxLatency(us), 79679
[CLEANUP], 95thPercentileLatency(us), 79679
[CLEANUP], 99thPercentileLatency(us), 79679
[INSERT], Operations, 1000000
[INSERT], AverageLatency(us), 10285.497832
[INSERT], MinLatency(us), 5568
[INSERT], MaxLatency(us), 1307647
[INSERT], 95thPercentileLatency(us), 18751
[INSERT], 99thPercentileLatency(us), 33759
[INSERT], Return=OK, 1000000
Comparison of the HBase Write numbers with explanation
| Parameter |
Unit |
With Accelerated writes |
Without Accelerated writes |
| [OVERALL], RunTime(ms) |
Milliseconds |
567478 |
2574273 |
| [OVERALL], Throughput(ops/sec) |
Operations/sec |
1770 |
388 |
| [INSERT], Operations |
# of Operations |
1000000 |
1000000 |
| [INSERT], 95thPercentileLatency(us) |
Microseconds |
3623 |
18751 |
| [INSERT], 99thPercentileLatency(us) |
Microseconds |
7375 |
33759 |
| [INSERT], Return=OK |
# of records |
1000000 |
1000000 |
- [OVERALL], RunTime(ms) : Total execution time in milliseconds
- [OVERALL], Throughput(ops/sec) : Number of operations/sec across all threads
- [INSERT], Operations: Total number of insert operations,with associated average, min, max, 95th and 99th percentile latencies below
- [INSERT], 95thPercentileLatency(us): 95% of INSERT operations have a data point below this value
- [INSERT], 99thPercentileLatency(us): 99% of INSERT operations have a data point below this value
- [INSERT], Return=OK: Record OK indicates that all INSERT operations were succesfull with the count alongside
Try out a few other workloads and compare
Read Mostly(95% Read & 5% Write) : workloadb
bin/ycsb run hbase12 -P workloads/workloadb -p table=usertable -p columnfamily=cf -p recordcount=1000000 -p operationcount=100000 -p threadcount=4 -cp /etc/hbase/conf -s | tee -a workloadb.dat
| Parameter |
Unit |
With Accelerated writes |
Without Accelerated writes |
| [OVERALL], RunTime(ms) |
Milliseconds |
292029 |
374379 |
| [OVERALL], Throughput(ops/sec) |
Operations/sec |
3424 |
2537 |
| [READ], Operations |
Operations/sec |
949833 |
949586 |
| [UPDATE], Operations |
Operations/sec |
50167 |
50414 |
| [READ], 95thPercentileLatency(us) |
Microseconds |
1401 |
3395 |
| [READ], 99thPercentileLatency(us) |
Microseconds |
1387 |
3611 |
| [READ], Return=OK |
# of records |
949833 |
949586 |
Read Only : workloadc
bin/ycsb run hbase12 -P workloads/workloadc -p table=usertable -p columnfamily=cf -p recordcount=1000000 -p operationcount=100000 -p threadcount=4 -cp /etc/hbase/conf -s | tee -a workloadc.dat
| Parameter |
Unit |
With Accelerated writes |
Without Accelerated writes |
| [OVERALL], RunTime(ms) |
Milliseconds |
272031 |
253256 |
| [OVERALL], Throughput(ops/sec) |
Operations/sec |
3676 |
3948 |
| [READ], Operations |
Operations/sec |
1000000 |
1000000 |
| [READ], 95thPercentileLatency(us) |
Microseconds |
1385 |
1410 |
| [READ], 99thPercentileLatency(us) |
Microseconds |
3215 |
3723 |
| [READ], Return=OK |
# of records |
1000000 |
1000000 |


Recent Comments