Near real-time monitoring of SQL Server Linux/containers using Telegraf-InfluxDB and Grafana

Near real-time monitoring of SQL Server Linux/containers using Telegraf-InfluxDB and Grafana

This article is contributed. See the original author and article here.

Introduction: 


In this blog, we will look at how we configure near real-time monitoring of SQL Server on Linux and containers with the Telegraf-InfluxDB and Grafana stack. This is built on similar lines to Azure SQLDB and Managed Instance solutions already published by my colleague Denzil Ribeiro. You can refer to the above blogs to know more about Telegraf, InfluxDB and Grafana. 


A quick rundown of all the tasks we’ll be carrying out to complete the setup:


  1. We will first install the Telegraf, InfluxDB, and Grafana containers on the monitoring host machine. You may be wondering why containers are used? because they are simple to set up and also provide isolation. 

  2. Then, we will prepare the target SQL Server instances that we will monitor by creating the login on all of the target SQL Server instances (SQL Server on Linux/containers/Windows) that telegraf will use to connect to SQL Server instances for data collection.

  3. As this is a demo, I am running all three containers on a single host machine, but depending on the instances you monitor and data that is collected, you may decide to run the containers on different nodes.

  4. The data retention policies of InfluxDB will then be configured. The retention policy ensures that Influxdb does not grow out of bounds. 

  5. Finally, we will configure and set up Grafana to create our dashboard with graphs and charts.


Let’s Build:


For this demonstration, the host on which I deploy the containers is an Azure VM running Ubuntu 20.04. I’m collecting data from the four SQL Server instances listed below:


  1. A SQL Server instance running on RHEL.

  2. Two SQL Server container instances, one deployed using the Ubuntu image and the other using the RHEL image.

  3. A SQL Server running on Windows.


Let’s start deploying containers:


  1. Install docker on the Ubuntu 20.04 host, which is our monitoring VM. To install Docker on Ubuntu 20.04 VM, refer to this article.

  2. Run the command below to create a docker network. This is the common network on which all three containers (Telegraf, InfluxDB, and Grafana) will be deployed.

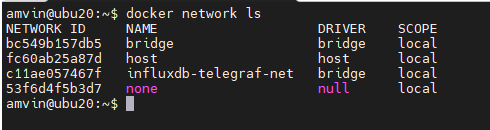
    docker network create --driver bridge influxdb-telegraf-net 
    #You can change the name of the network from “influxdb-telegraf-net” to whatever you want.​

    you can list the network using the command

    docker network ls​

    amvin87_0-1628258795694.png


  3. We will now create the SQL Server login that telegraf will use to connect to the target SQL Server instances. This login must be created on all target SQL Server instances that you intend to monitor. You can change the login name from telegraf to any other name of your choice, but the same also needs to be changed in the telegraf.conf file as well.

    USE master; 
    CREATE LOGIN telegraf WITH PASSWORD = N'StrongPassword1!', CHECK_POLICY = ON; 
    GO 
    GRANT VIEW SERVER STATE TO telegraf; 
    GO 
    GRANT VIEW ANY DEFINITION TO telegraf; 
    GO 


  4. Run the following command to deploy the telegraf container

    docker run -d --name=telegraf -v /home/amvin/monitor/sqltelegraf/telegraf.conf:/etc/telegraf/telegraf.conf --net=influxdb-telegraf-net telegraf 
    # where:/home/amvin/monitor/sqltelegraf/telegraf.conf is a telegraf configuration file placed on my host machine, please update the path as per your environment.
    # please ensure that you change the IP addresses and port numbers to your target SQL Server instances in the telegraf.conf file that you create in your environment. 

    Note: You can download the sample telegraf.conf from here. Please remember to change the IP address to your target SQL Server instance IP addresses.


  5.  Run the following command to deploy the InfluxDB container

    docker run --detach --net=influxdb-telegraf-net -v /home/amvin/monitor/data/influx:/var/lib/influxdb:rw --hostname influxdb --restart=always -p 8086:8086 --name influxdb influxdb:1.8 
    
    # where: /home/amvin/monitor/data/influx is a folder on the host that I am mounting inside the container, you can create this folder in any location.
    # please ensure you set the right permissions so files can be written inside this folder by the container.  ​


  6. Deploy the Grafana container using the following command

    docker run --detach -p 3001:3000 --net=influxdb-telegraf-net --restart=always -v /home/amvin/monitor/data/grafana:/var/lib/grafana -e "GF_INSTALL_PLUGINS=grafana-azure-monitor-datasource,grafana-piechart-panel,savantly-heatmap-panel" --name grafana grafana/Grafana 
    
    # where: home/amvin/monitor/data/grafana is a folder on the host that I am mounting inside the container, you can create this folder in any location.
    # please ensure you set the right permissions so files can be written inside this folder. 


With the containers now deployed, use “docker ps -a” to list them, and you should see something like this:


amvin87_0-1628260115106.png


Note: Please ensure that you open the ports on the host to which Grafana and InfluxDB containers are mapped to, in this case they are 3000 and 8086 respectively. 


Let’s now setup retention policy on InfluxDB to ensure that there is limited growth of the database. I am setting this for 30 days, you can configure it as per your requirement.


sudo docker exec -it influxdb bash
#then run beow commands inside the container
influx
use telegraf; 
show retention policies; 
create retention policy retain30days on telegraf duration 30d replication 1 default; 
quit


Setting up Grafana: 


We are now ready to create the dashboard, before that we need to setup Grafana and to do that follow the below steps: 


  • Browse to your Grafana instance – http://[GRAFANA_IP_ADDRESS_OR_SERVERNAME]:3000 

  • First time you login into Grafana, login and password are set to: admin. Also take a look at the Getting Started Grafana documentation. 

  • Add a data source for InfluxDB. Detailed instructions are at in the grafana data source docs 

    • Type: InfluxDB

    • Name: InfluxDB (this is also the default) 

    • URL: http://[INFLUXDB_HOSTNAME_OR_IP_ADDRESS]:8086. (The default of http://localhost:8086 works if Grafana and InfluxDB are on the same machine; make sure to explicitly enter this URL in the field. ) 

    • Database: telegraf 

    • Click “Save & Test”. You should see the message “Data source is working”. 


  • Download Grafana dashboard JSON definitions from the repo from here and then import them into Grafana. 


You are ready and this is how the dashboard should look, feel free to modify the graphs as per your requirement.


amvin87_0-1628261239658.png


amvin87_1-1628261266254.png


amvin87_2-1628261285192.png


Customer review: Abnormal Security helps protect our environment with next-gen email security

This article is contributed. See the original author and article here.

Abnormal Security, an app available in Azure Marketplace, uses advanced artificial intelligence detection techniques to stop targeted phishing attacks. The cloud-native email security platform protects enterprises by detecting anomalous behavior and developing a deep understanding of people, relationships, and business context. Abnormal Security is a member of the Microsoft Intelligent Security Association.


Azure Marketplace interviewed Ben S., an IT director in the manufacturing sector, to learn what he had to say about the product.


What do you like best about Abnormal Security?
Abnormal Security stood out to us as a nuanced and unique way to approach the idea of business email compromise. Through their behavioral engine, they would build out personas for what is normal and expected interaction for your employee base, and through that identification, they would classify what is abnormal activity. And they carry that forward from your internal personnel to the vendor base that you contact and interact with.


It does a really great job of providing reporting both at a high level and then down to the granular details. So there’s a handful of dashboards that help to show attack trends and attack types, whether it be credential phishing, malware scam, or social engineering. Any of those types of categories it’s able to represent both in percentage and count. It’s also able to show attacker origin. And then the other piece that I think is incredibly helpful is that, for the emails it does remediate or take action on, it doesn’t just do that blindly. It actually takes that email message and is able to highlight the pieces that caused its threat score to be elevated so that you, as a security analyst or a support individual, can go through and understand what it is you’re looking at and know why something would be considered a threat or malicious.


How has the product helped your organization?
We saw a lot of banking impersonation and, in some cases, internal invoice impersonation taking place. We were receiving pretty legitimate-looking invoices from known vendors. But they were coming from different email servers. There were also instances where the external contact had been compromised and the invoice had banking information changes to it, trying to get us to wire funds to an attacker’s bank account. Abnormal had a great proof of concept that they were able to walk us through. From the time we turned it on, we saw immediate results from that. The solution integrates with our Exchange Online environment and doesn’t sit in line like a traditional secure email gateway type of solution. It sits next to it and maintains that same visibility. So if an attack is identified after the fact, it’s still connected to the point where it’s able to then do post-remediation and pull those delivered messages out from mailboxes.


Another useful feature is the abuse mailbox. It’s a function that allows us in IT support to leverage some email client toolbar applications for employees to be able to submit suspect messages. Previously that was a manual effort by our security team, where that would become a helpdesk ticket item that then would require hands-on analysis by someone on my team.


How are customer service and support?
Customer service has been great. When we reached out and started to engage with them on the proof of concept, they were tremendous in helping to get the platform configured. And then that carried forward to when we were customers as we were getting more and more familiar with the platform and asking questions, primarily around why certain emails were classified the way they were. Those were all easy-to-open cases where we got connected with dedicated support personnel. They configured this solution for us so that we have some flexibility in some different classifications, most notably the ability for us to maintain our VIP list of people that potentially are at higher risk, or that we want additional scrutiny around because of approval power.


Any recommendations to other users considering this product?
I think the biggest thing in the security space is there are a ton of different solutions and platforms trying to address similar issues. It’s important, when you’re looking for a solution, to understand what you’re looking to address. Financial loss, for us, was one of the biggest drivers, and in the evaluations we did, Abnormal showed the best capabilities to help address that risk.


What is your overall rating for this product?
5 out of 5 stars.


Cloud marketplaces are transforming the way businesses find, try, and deploy applications to help their digital transformation. We hope these improvements make your experience in Azure Marketplace intuitive and simple. Learn more about Azure Marketplace and find ways to discover the right application for your cloud solution needs.

Deliver authentic customer service with Dynamics 365

Deliver authentic customer service with Dynamics 365

This article is contributed. See the original author and article here.

Human interaction is at the cornerstone of every experience and today’s world has dramatically shifted what that means. Customers expect each touchpoint with businesses to be authentic, timely, and efficient, which has led to a rapid acceleration of customer engagement tools. Perhaps most important is customer service scenarios, where businesses must act on customer feedback to deliver in the moment. However, many businesses are falling short on this key activity, leading to more dissatisfaction and inefficiency.

61 percent of companies don’t close the loop with customers who gave feedback (Forrester)1

Customer service is paramount to the success and longevity of customer relationships. That’s why Dynamics 365 Customer Voice brings powerful data, sentiment, and satisfaction analysis to Dynamics 365 Customer Service. With easy-to-use tools, your team will be empowered with the right information at the right time. To learn more about how to get started using Dynamics 365 Customer Voice with Dynamics 365 Customer Service, read our free e-book, “The Power of Knowing Your Customers.”

Panduit boosts loyalty by automating surveys

Companies that emphasize customer service are at the forefront of delivering great experiences. They adapt their systems to meet customer demands while elevating how they operate in a digital environment.

Panduit, a global electrical and network infrastructure manufacturer, took this to heart as they rebuilt their customer service group into a broader customer experience organization. With Dynamics 365 Customer Voice and Customer Service, Panduit built a single platform to create a data-driven culture centered on the customer. They used survey results to track its Net Promoter Score as a strategic way to monitor overall customer sentiment and loyalty.

“For us, Dynamics 365 trumped its competitors because it’s such an easy platform to use. Now that [our customer service teams] get near real-time feedback in the voice of the customer, our advocates understand exactly what they need to change or continue doing” Jim Dillon, Director of Order Fulfillment, Panduit.

A connected service and voice of customer program doesn’t just impact the customer’s experience, it positively shifts how the company operations. Streamlined data and real-time insights into the customer make exceeding customer expectations simple, freeing up time for developers to work on other impactful projects. No longer can silo data be an effective form of understanding customers, and companies need to shift their systems into comprehensive platforms to provide the best customer experience.

Read more about how Panduit used Dynamics 365 to understand their customers.

Accelerate empathy and effectiveness of agents

Your customer service department is arguably the doorstep to your brand, products, and perception. From online chats to support agents, each avenue is a make-or-break moment for the customer and their relationship with your brand. These moments are built on two things: empathy and efficiency.

Dynamics 365 Customer Voice maximizes the effectiveness of the support you give customers, creating tailored interactions and cultivating longevity. Within Dynamics 365 Customer Service, chat agents can send surveys after a purchase or service, automatically capturing direct feedback. Additionally, surveys can be created as a feedback and customer service mechanism, giving businesses the opportunity to resolve complaints. Watch the video below to learn how to easily use surveys in Dynamics 365.

This embed requires accepting cookies from the embed’s site to view the embed. Activate the link to accept cookies and view the embedded content.

This site uses cookies for analytics, personalized content and ads. By continuing to browse this site, you agree to this use.

Agents who have access to automatically analyzed feedback from Customer Voice can help customer service departments continually understand their customers. And, with automation tools, agents can gather satisfaction scores and utilize the data to create more effective and efficient service calls and support chats. True digital transformation of customer service departments starts with the customer and with quality data, but ends with authentic connections. The technologies of tomorrow can create unparalleled value for organizations as agents can continually learn about the customer, improve their own effectiveness, and elevate brands.

The future of connected customer service

Connectivity is essential in a digital-first world, not just with customers but within companies. While each department has its own responsibility, they can all interact with the same singular customer making it critical that everyone is aligned on who that customer is, what their satisfaction is, and how to deliver on their wants and needs. A connected environment increases the chances for a positive experience, even in situations where a response is needed quickly.

63 percent of companies don’t have a cadence of sharing in line with decision making (Forrester)1

Aligning technologies across the department, from voice of customer solutions to customer service solutions to your customer data platform, creates a wealth of unified data that all agents can tap into. This can create a level of consistency and proactiveness unmatched by competitors. Connecting technologies isn’t just about aligning on data, it’s also elevating the knowledge of agents and their understanding of customers. The future will demand tailored, consistent experiences, and creating a comprehensive solution that pulls all your data together for every scenario will leave a lasting impact on your valued customers.

Learn more

To learn more about listening to customers and aligning data across your organization, visit the Dynamics 365 Customer Voice website or start your free Dynamics 365 Customer Voice trial today.

To learn more about delivering great customer service, visit the Dynamics 365 Customer Service website or start your free Dynamics 365 Customer Service trial today.

Download our free infographic to learn more about Dynamics 365 Customer Voice.


1- The State Of CX Measurement And VoC Programs, 2020, Faith Adams, Forrester, May 3, 2021.

The post Deliver authentic customer service with Dynamics 365 appeared first on Microsoft Dynamics 365 Blog.

Brought to you by Dr. Ware, Microsoft Office 365 Silver Partner, Charleston SC.

Experiencing Data Gaps issue in Application Insights – 08/04 – Investigating

This article is contributed. See the original author and article here.

Initial Update: Wednesday, 04 August 2021 17:07 UTC

We are aware of issues within Application Insights data ingestion in the Korea Central and India West regions and are actively investigating. The issues began at 16:24 UTC. Some customers may experience delayed or missed Metric Alerts and metric data gaps.
  • Next Update: Before 08/04 18:30 UTC
We are working hard to resolve this issue and apologize for any inconvenience.
-Jack

Get Ready to Do More with Teams Meeting Recordings in Microsoft 365!

Get Ready to Do More with Teams Meeting Recordings in Microsoft 365!

This article is contributed. See the original author and article here.

Since we first announced users could save Teams meetings recordings in Microsoft 365, we’ve clocked immense progress – with most users now saving their Teams meetings recordings by default on OneDrive and SharePoint than on Classic Stream. With this switch, users are enjoying many new benefits from meeting recordings being better integrated with Microsoft 365, including: easy share controls and external sharing capabilities, improved video management, advanced compliance and governance, and much more.


In line with the vision for Stream (built on SharePoint), and to bring these increased benefits to all our users, all new Teams meeting recordings will soon be saved to OneDrive and SharePoint – with rollout beginning incrementally from August 16, 2021. 


TMR in ODSP GIF_intro.gif


Major updates to transcript coverage and controlling downloads.


Central to the changes we’re making are our users’ needs. Thus, alongside our efforts to transition meeting recordings to Microsoft 365, we’ve been gathering your feedback – resulting in the following product updates and feature accelerations to ensure a more accessible and secure product:


Generating Teams live transcription for all meetings to ensure closed captions are available during playback in Microsoft 365:


  • Available today: Teams Live Transcription with speaker attribution has been expanded to all Office and Microsoft 365 license types. 

  • Rolling out by August: Live transcription will always be generated when a user clicks ‘Start recording’ on desktop client.  

  • Rolling out by August: Live transcription will be available across all meeting types, including channel meetings and ad-hoc meetings.  

  • Rolling out by August: Live transcription and live captions will be available for 15 additional spoken languages. 


Downloading and editing a transcript file: 


  • Available today: Users can download the transcript file from the Teams meeting ‘Transcripts’ tab, where users can edit and share the file manually with others.    

  • Under development: Improvements to the above flow by allowing users to download the transcript file from the video player itself, make changes locally, and upload the file to the player so that the changes are reflected in the closed captions.  

  • Other immediate options to edit transcripts within the video player: users can download recordings from ODSP and upload to Classic Stream, where a transcript will be generated on-demand and users can edit the transcript within the video itself. 

  • If you have questions about this or other features, please contact support through your M365 Admin Center or your account manager. 


Blocking the downloads of meeting recordings is now available for all users in ODSP:


  • Available today: Block downloads for non-channel meeting recordings has been rolled out and turned on by default for all recordings.  

  • Available today: Block downloads for channel meeting recordings has been rolled out and admins may enable this feature through a new Teams policy setting. 


To learn more about these updates, admins can see Message Center post 222640. Microsoft is excited about these updates that will bring higher quality and more accurate transcription to more people and languages than ever before. 


What else is happening with Teams meeting recordings stored in Microsoft 365? 


The changes above fall within the broader context of the work we’re doing with Stream (on SharePoint). Several other features have begun lighting up for Teams meeting recordings stored in Microsoft 365 including: 


  • Now available: Auto-recording  Meeting owners can set meetings to automatically start recording. 

  • Now available: Stream start page  Search and manage meeting recordings from the new Stream start page (stream.office.com) 

  • Rolling out: Stream video player – Watch recordings from the new Stream web player.  

  • Under development: Auto-expiration of meeting recordings – learn more about this feature.  


To learn more about these, and other upcoming features for Stream (on SharePoint), click here. 


In a nutshell, be ready for new experiences with Teams meeting recordings in Microsoft 365.