This article is contributed. See the original author and article here.
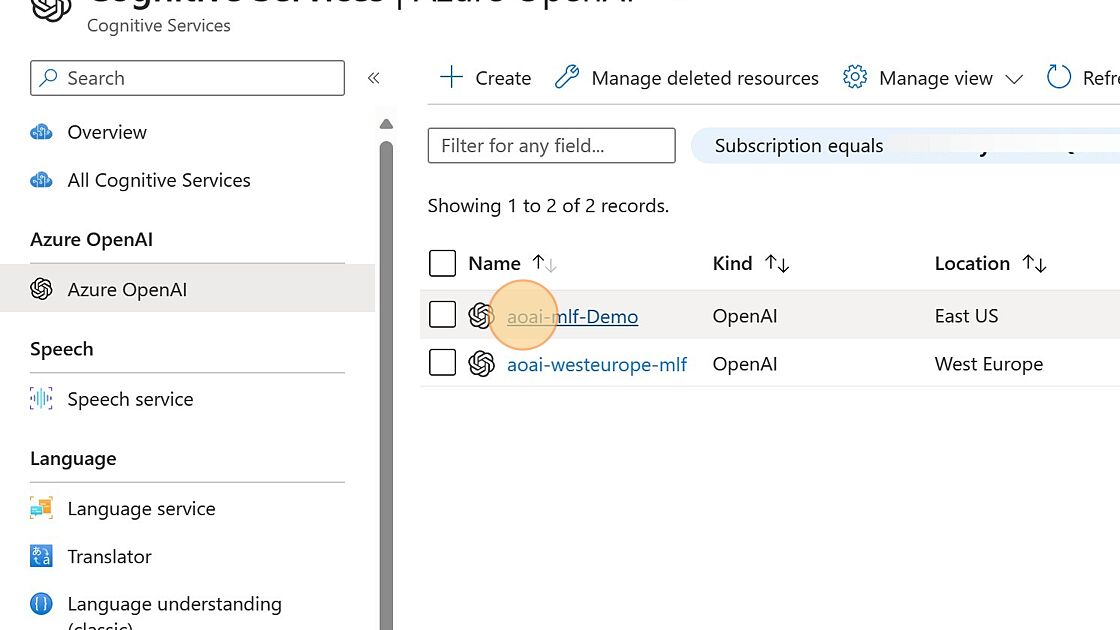
Introduction
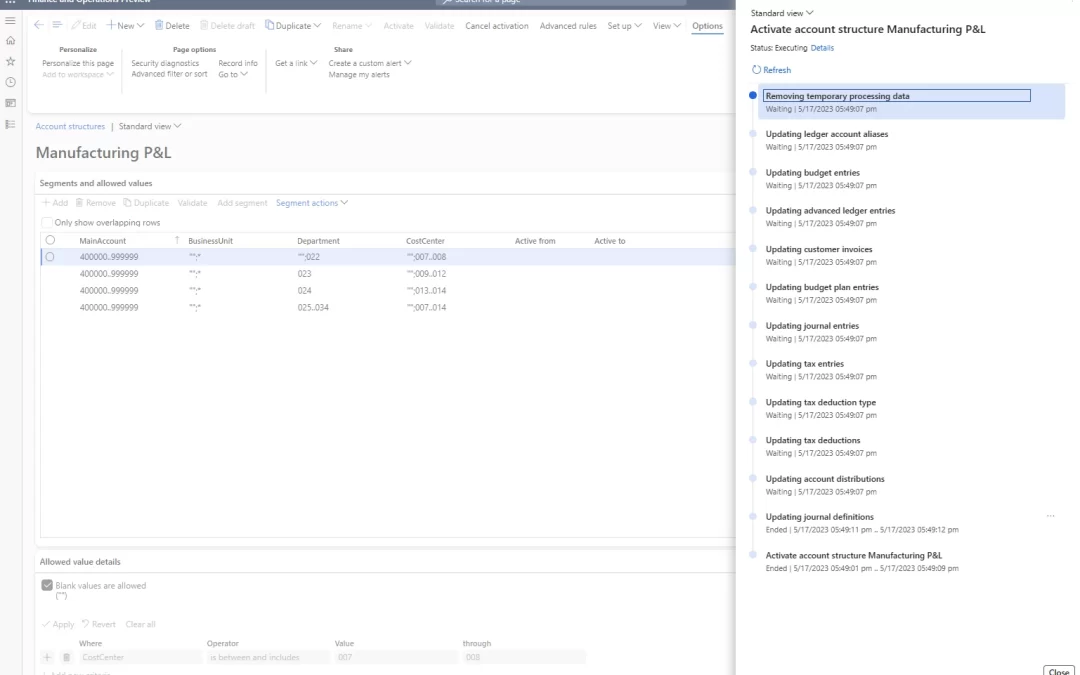
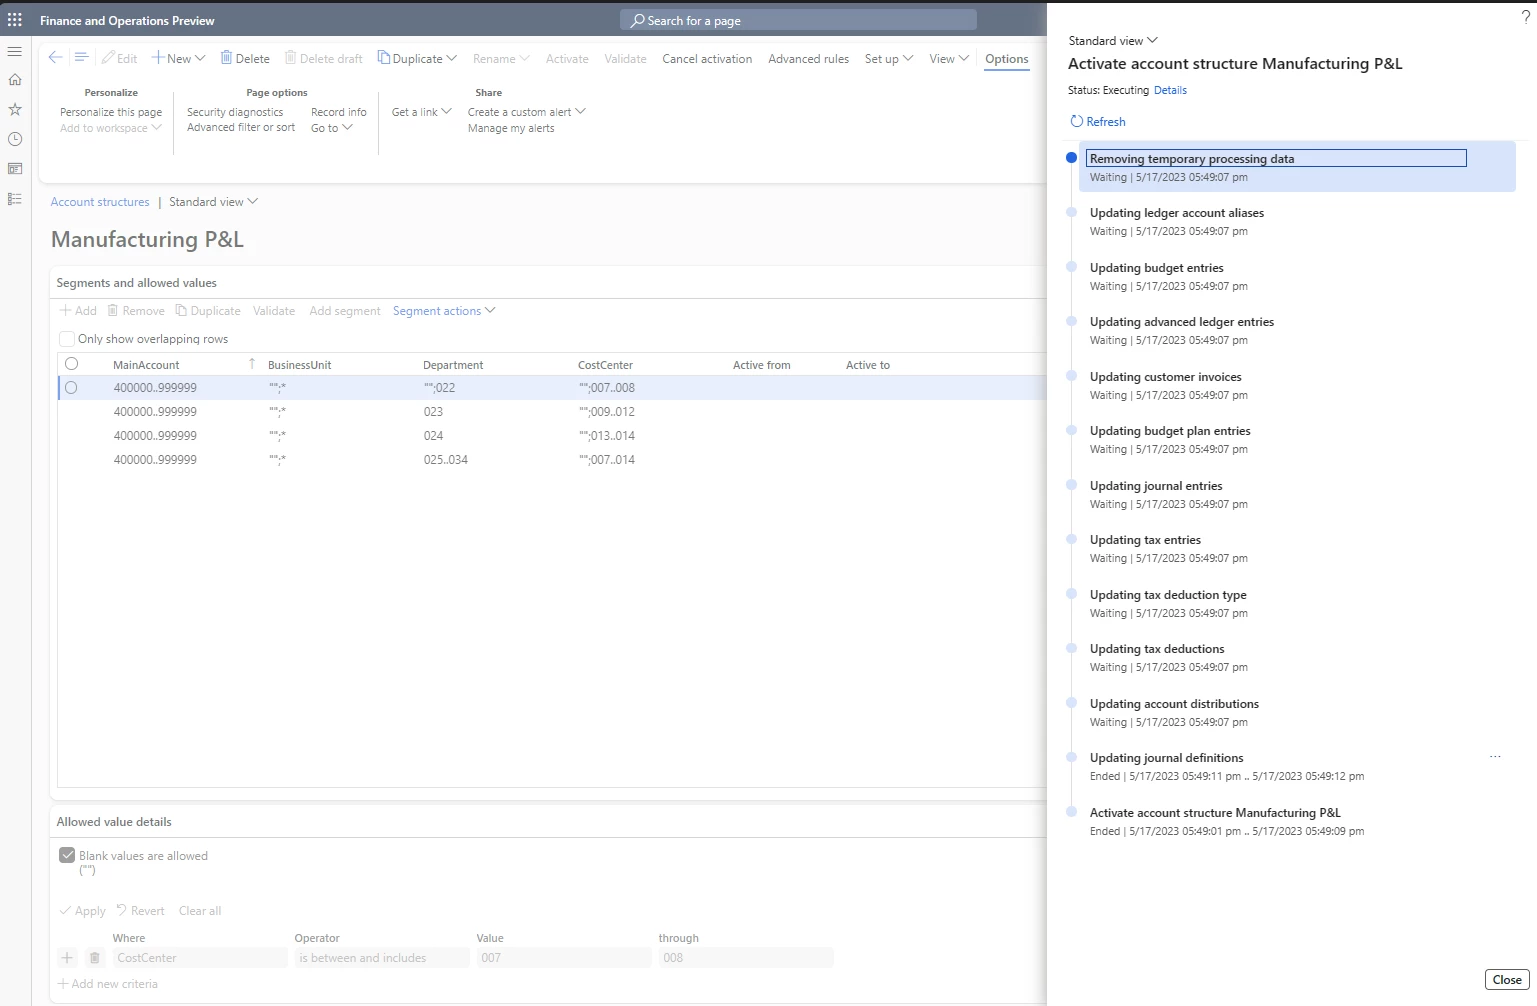
Account structures in Dynamics 365 Finance use a main account and financial dimensions to create a set of rules that determine the order and allowed values when entering account numbers in transactions. Once an account structure is defined, it must be activated. Historically, the account structure activation process has been time consuming. It was also difficult to view the activation progress or to view any errors with the new configuration. If an account structure configuration change caused an error, a user could not find the root error message on the account structure page, but rather needed to dig through batch job logs to find the error message to understand the problem with the new account structure configuration.
Feature details
In order to solve these problems, we have recently released an enhancement to the account structure activation process in application release 10.0.31. This performance enhancement lets you activate account structures more quickly by allowing multiple transaction updates to happen at the same time. An added benefit of this new feature enhancement is allowing the structure to be marked as active immediately after it is validated and before the remaining unposted transactions are updated to the new structure configuration. This allows transaction processing to continue while the existing unposted transactions are updated to the new structure.
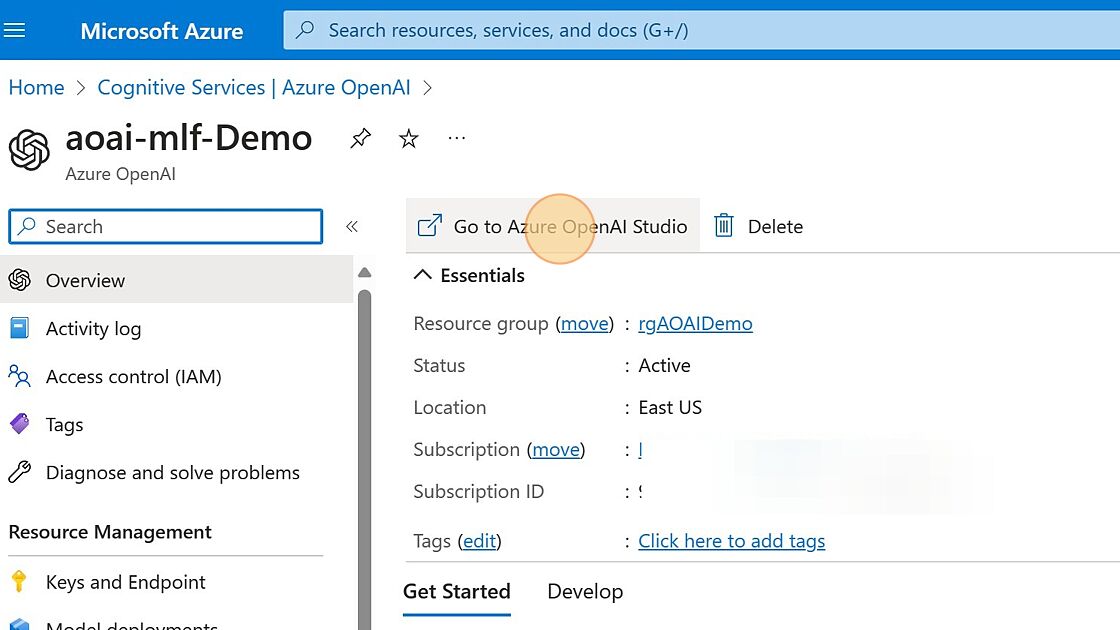
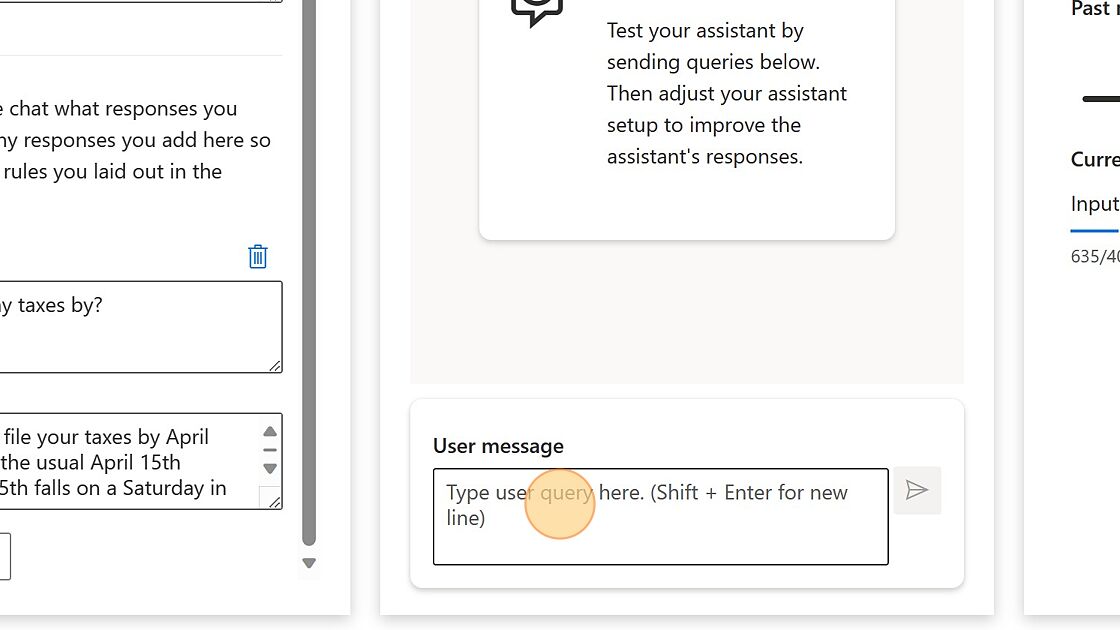
To view the status of the activation, select View activation status above the grid on the Account structures page. You can also view the activation status by selecting View on the Action Pane and then selecting Activation status on the drop-down menu.
Enable the feature
In order to use this new functionality, enable the feature “Account structure activation performance enhancement” from within feature management.
This article is contributed. See the original author and article here.
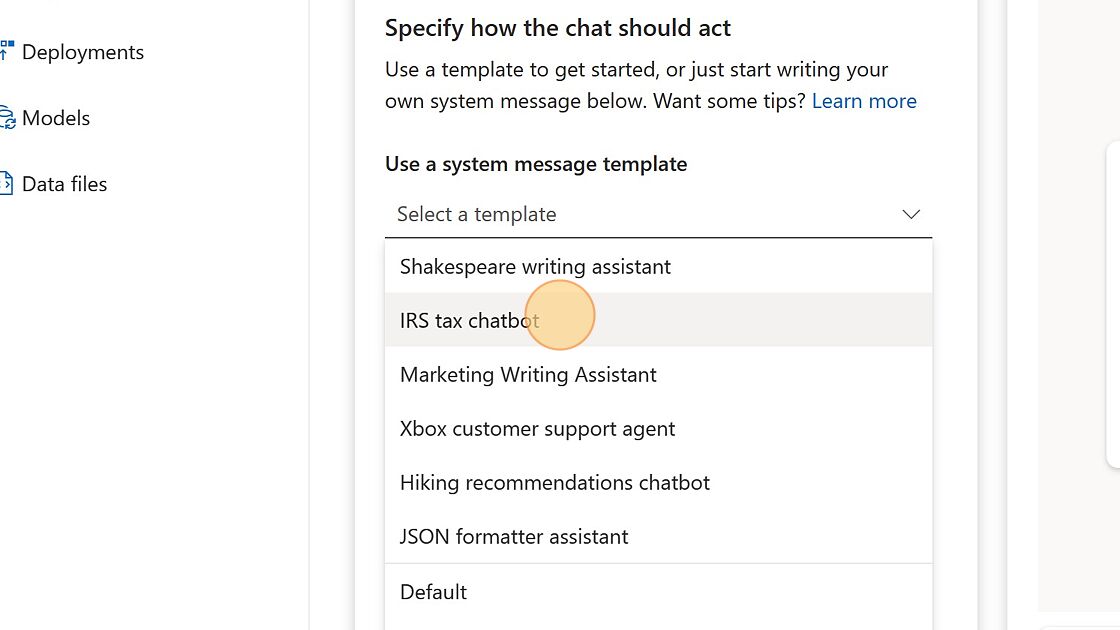
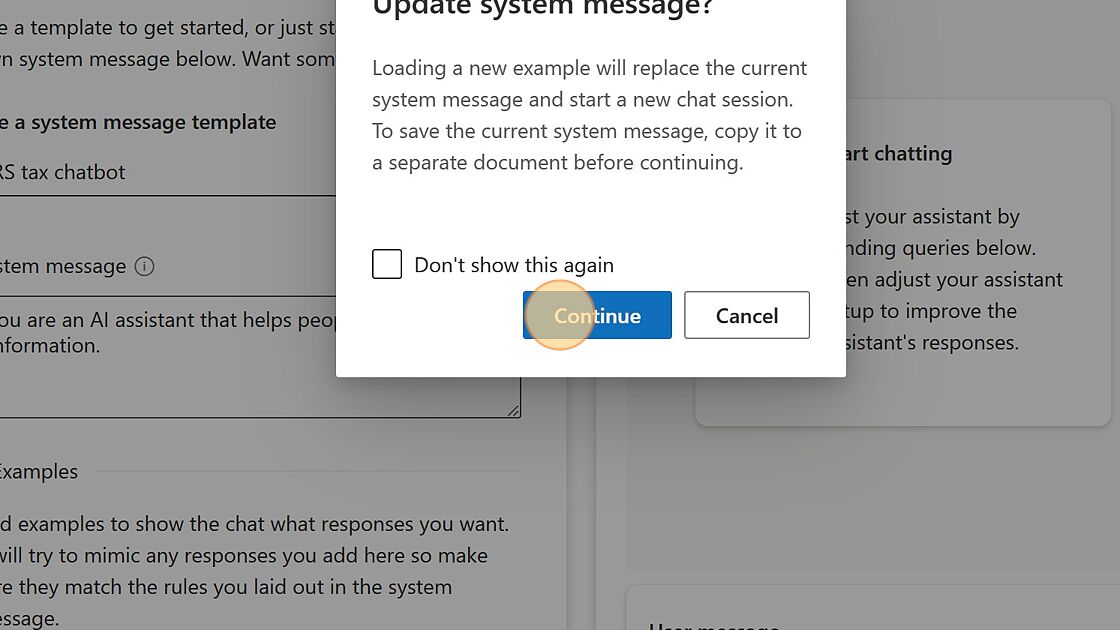
Code Optimizations: A New AI-Based Service for .NET Performance Optimization
We are thrilled to announce that Code Optimizations (previously known as Optimization Insights) is now available in public preview! This new AI-based service can identify performance issues and offer recommendations specifically tailored for .NET applications and cloud services.
What is Code Optimizations?
Code Optimizations is a service within Application Insights that continuously analyzes profiler traces from your application or cloud service and provides insights and recommendations on how to improve its performance.
Code Optimizations can help you identify and solve a wide range of performance issues, ranging from incorrect API usages and unnecessary allocations all the way to issues relating to exceptions and concurrency. It can also detect anomalies whenever your application or cloud service exhibits abnormal CPU or Memory behavior.
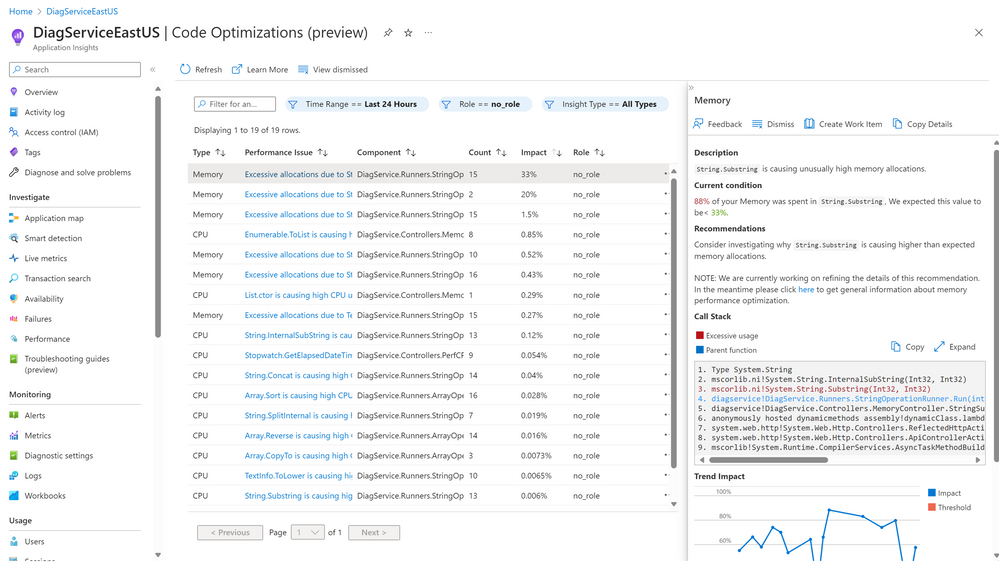
Code Optimizations Page
Why should I use Code Optimizations?
Code Optimizations can help you optimize the performance of your .NET applications and cloud services by:
Saving you time and effort: Instead of manually sifting through gigabytes of profiler data or relying on trial-and-error methods, you can use Code Optimizations to automatically uncover complex performance bugs and get guidance on how to solve them.
Improving your user experience: By improving the speed and reliability of your application or cloud service, you can enhance your user satisfaction and retention rates. This can also help you gain a competitive edge over other apps or services in your market.
Saving you money: By fixing performance issues early and efficiently, you can reduce the need for scaling out cloud resources or paying for unnecessary compute power. This can help you avoid problems such as cloud sprawling or overspending on your Azure bill.
How does Code Optimizations work?
Code Optimizations relies on an AI model trained on thousands of traces collected from Microsoft-owned services around the globe. By learning from these traces, the model can glean patterns corresponding to various performance issues seen in .NET applications and learn from the expertise of performance engineers at Microsoft. This enables our AI model to pinpoint with accuracy a wide range of performance issues in your app and provide you with actionable recommendations on how to fix them.
Code Optimizations runs at no additional cost to you and is completely offline to the app. It has no impact on your app’s performance.
How can I use Code Optimizations?
If you are interested in trying out this new service for free during its public preview period, you can access it using the following steps:
Sign up for Application Insights if you haven’t already. Application Insights is a powerful application performance monitoring (APM) tool that helps you monitor, diagnose, and troubleshoot your apps.
Enable profiling for your .NET app or cloud service. Profiling collects detailed information about how your app executes at runtime.
Navigate to the Application Insights Performance blade from the left navigation pane under Investigate and select Code Optimizations from the top menu.
Link to Code Optimizations from Application Insights: Performance
This article is contributed. See the original author and article here.
Microsoft has been on a journey to harness the power of artificial intelligence to help security teams scale more effectively. Microsoft 365 Defender correlates millions of signals across endpoints, identities, emails, collaboration tools, and SaaS apps to identify active attacks and compromised assets in an organization’s environment. Last year, we introduced automatic attack disruption, which uses these correlated insights and powerful AI models to stop some of the most sophisticated attack techniques while in progress to limit lateral movement and damage.
Today, we are excited to announce the expansion of automatic attack disruption to include adversary-in-the-middle attacks (AiTM) attacks, in an addition to the previously announced public preview for business email compromise (BEC) and human-operated ransomware attacks.
AiTM attacks are a widespread and can pose a major risk to organizations. We are observing a rising trend in the availability of adversary-in-the-middle (AiTM) phishing kits for purchase or rent, with our data showing that over organizations have already been attacked in 2023.
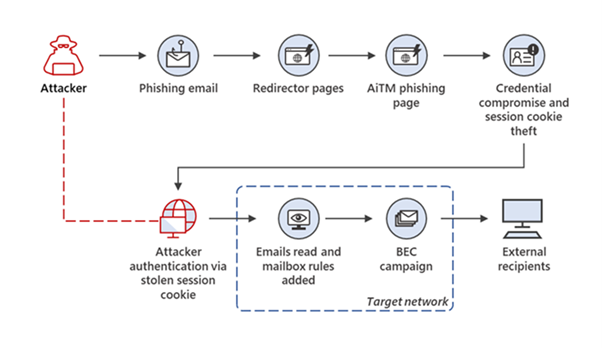
During AiTM attacks (Figure 1), a phished user interacts with an impersonated site created by the attacker. This allows the attacker to intercept credentials and session cookies and bypass multifactor authentication (MFA), which can then be used to initiate other attacks such as BEC and credential harvesting.
Automatic attack disruption does not require any pre-configuration by the SOC team. Instead, it’s built in as a capability in Microsoft’s XDR.
Figure 1. Example of an AiTM phishing campaign that led to a BEC attack
How Microsoft’s XDR automatically contains AiTM attacks
Similarly to attack disruption of BEC and human-operated ransomware attacks, the goal is to contain the attack as early as possible while it is active in an organization’s environment and reduce its potential damage to the organization. AiTM attack disruption works as follows:
High-confidence identification of an AiTM attack based on multiple, correlated Microsoft 365 Defender signals.
Automatic response is triggered that disables the compromised user account in Active Directory and Azure Active Directory.
The stolen session cookie will be automatically revoked, preventing the attacker from using it for additional malicious activity.
Figure 2. An example of a contained AiTM incident, with attack disruption tag
To ensure SOC teams have full control, they can configure automatic attack disruption and easily revert any action from the Microsoft 365 Defender portal. See our documentation for more details.
This article is contributed. See the original author and article here.
Introduction
Earlier in May 2022, we launched Azure Monitor HCI Insights for public preview. Based on customer feedback during the preview, we improved the performance of the workbooks and supported the new Azure Monitor Agent and are excited to announce General Availability (GA) of Azure Monitor HCI Insights.
What is HCI Insights?
Azure Stack HCI Insights is an interactive, fully integrated service which provides health, performance, and usage insights about Azure Stack HCI clusters that are connected to Azure and are enrolled in Azure Monitor. In Microsoft Azure, you can see all your resources in Azure portal and monitor them with Azure Stack HCI Insights.
There are some key benefits of using Azure Stack HCI Insights:
It’s managed by Azure and accessed from Azure portal, so it’s always up to date, and there’s no database or special software setup required.
Azure Monitor Agent uses managed identity to interact with Log analytics workspace which ensures secure communication.
It’s highly scalable, which means it is capable of loading more than 250 cluster information sets across multiple subscriptions at a time, with no boundary limitations on cluster, domain, or physical location.
It’s highly customizable. The user experience is built on top of Azure Monitor workbook templates, where you can easily add/remove/edit visualizations and queries.
HCI Insights follows Pay-as-you-go model which means you pay only for the logs that are collected and they can be removed/edited as per user need.
What’s new in GA?
The new, enhancedAzure Monitor HCI Insights uses the new improved Azure Monitor Agent and Data Collection Rule. These rules specify the event logs and performance counters that need to be collected and stores it in a Log Analytics workspace. Once the logs are collected, HCI Insights uses Azure Monitor Workbooks to provide deeper insights on the health, performance and usage of the cluster.
There are a few prerequisites for using Azure Stack HCI Insights:
Azure Stack HCI cluster should be registered with Azure and Arc-enabled. If you registered your cluster on or after June 15, 2021, this happens by default. Otherwise, you’ll need to enable Azure Arc integration.
The cluster must have Azure Stack HCI version 22H2 and the May 2023 cumulative update or later installed.
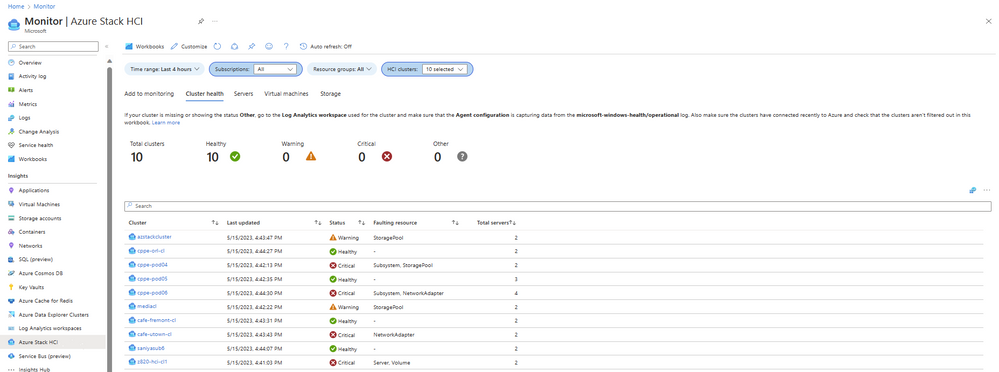
Below is a screenshot of the Azure workbook displayed for multiple clusters.
You can click on the cluster name, and it will redirect you to the single cluster workbook template with a drill down view and more details as shown below:
Pre-defined workbook templates exist with default views to give you a head-start. You can switch between different tabs like Health, Servers, Virtual machines, and Storage. Each tab provides data and metrics about the cluster which is carefully designed keeping your needs in mind. Health data such as faults and resource status, performance data like IOPS and throughput, and usage data like CPU usage and memory usage are collected. Moreover, the rich visualizations make it easier to decipher the data and give a quick glance of useful insights.
Additional data can be easily collected in the form of event logs or performance counters, and you can add it to the Data collection rule that was created while enabling monitoring for the cluster. Once the data starts flowing, the user can use Azure workbooks to visualize the collected data. A workbook provides a set of visualizations like charts, graphs, grids, honeycomb, composite bar, maps etc. and it is very convenient to modify and alter. It allows you to pin the graphs to Azure dashboards which gives a holistic view of resource health, performance, and usage. It is also very easy to share the data by downloading this information in Excel and deriving useful insights.
Customers also use logs and Insights workbook templates to create alerts. Some of the common alerts created by customers are if cluster node is down, and if CPU or memory usage exceeds set threshold. You can set up alerts for multiple clusters and integrate 3rd party solutions like PagerDuty to get notified. This will make sure that you take timely action and resources are healthy and performant.
This is just the beginning of Monitoring Insights for Azure Stack HCI. We plan to build additional workbook templates for new HCI features and essential monitoring capabilities. If you have feedback, please send it to hcimonitoring@microsoft.com!


Recent Comments