by Contributed | Mar 10, 2021 | Technology
This article is contributed. See the original author and article here.
“Linux agents have heartbeat issues. Literally everyday heartbeat alerts are detected on random Linux machines, but then when those machines are checked, they are found to be up and running. To solve this problem in the console, the agents under question are restarted. But that is an issue when there are so many agents and a lot of heartbeat alerts!” – Large SCOM customer monitoring 1000s of Linux agents.
The origin of the problem
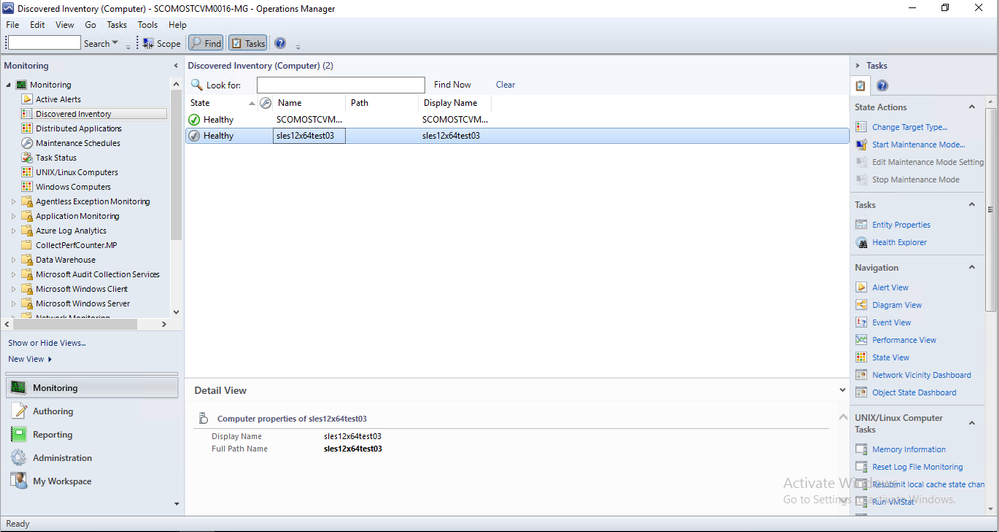
The problem was a big one: Until the release of SCOM 2019 UR1, individual Linux agents would randomly ‘grey-out’ in the SCOM Ops and Web Console as shown below in the image, where the second agent is ‘greyed out’.
A ‘grey agent’ technically means that the state of the agent is ‘Unknown’. The agent might be healthy or unhealthy, but the Management Server that is watching the agent can’t reach the agent to determine its health. Imagine going for a vacation and losing your phone in the process. You might be healthy and having the time of your life, but other folks concerned about you have no way of reaching you to determine your state since connections are dead.
On a technical level, a management server regularly sends a signal to each agent it is monitoring, and expects a reply from each one of them (called an agent heartbeat). When an agent fails to send a heartbeat response upon receipt of a signal from the management server, it greys out in the console.
Why is that a problem
Agents greying out leads to alerts being generated. This is a problem for the system administrator who is monitoring the system because of the following reasons:
- Based on the alerts, they will contact the Linux Admin in charge of the Linux servers. The Linux Admin then checks the Linux agent, only to find it up and running. This wastes the time of both the Linux Admin and the System Admin
- The pattern is random. That means the System Admin is not able to determine which agent greying alert is real and which is a false alarm. They have to equally check all the agents that are greyed out
- Sometimes agents grey out at night or after midnight. The system admin then has to manage the system at such odd hours.
The solution
When multiple customers brought the issue to our attention and upon further investigation, the issue was found to be in the agent. Earlier, the Linux agent was running one process that was responsible for both sending heartbeats and for managing the collection of performance metrics. For any reason, if the process became too busy in collecting performance metrics, it would become stalled. If the process becomes stalled, it would not be able to send heartbeats also to the management server causing the agent to grey out.
With SCOM 2019 UR1 onwards, a dedicated process was introduced in the SCOM Linux agent to send the heartbeat. The process called ‘omiagent’ running under the ‘omi’ user now is responsible for sending heartbeat responses regularly to the management server whenever the management server sends a heartbeat request to the agent.
How it solved the problem
Since the problem existed in the SCOM Linux agent and not the Management Server, for customers who upgraded their agent to use the latest version, agents don’t grey out anymore unless there is a genuine problem because the performance metrics process has been decoupled from the heartbeat process. For the system and Linux administrators, this solves the problem of:
- Random greying out of agents
- False alarms
The overall impact is in terms increased reliability of SCOM Linux monitoring. This will lead to time saved investigating false alarms and also stress and tensions relieved in terms of not having to needlessly worry whether the agent going gray in the Ops console is due to a false alarm or if it is actually indicates the Linux server being down/unreachable

by Contributed | Mar 10, 2021 | Technology
This article is contributed. See the original author and article here.
I love static sites! In 2020 I have created ten production sites with various static site generators and a couple of POCs. My favorites are Hugo and Next.js.
The story
Internally in our team, we did the same. For our Valo partner/client documentation, we used mkdocs as our static site generator. Static is just fast and relatively easy to use. All our developers know how to use Markdown, and it is also a great way to add code snippets and such.
A couple of months, we were discussing to start writing some developer guidance. Which tools are we using, how do we do things, and why? The platform’s idea would be to make it easier for anyone new to quickly get started and get a good view of how our team works.
As this was developer focussed in the first place, we started thinking about a static site. Although we opted for Azure DevOps wiki, as we are thinking about moving towards GitHub, we went for mkdocs. The platform should also consolidate all the documentation that lives in the project repository, wiki, and old intranet (soon to be removed).
After a couple of iterations, I asked the question: are we doing the right thing here? Is this platform the right thing to use? After that, I proposed the crazy idea to move all our documentation to SharePoint.
The first thought was, it would be hard to maintain. As a developer, you want to add the documentation as quickly as possible so that you can go and focus on your code again. Going to SharePoint meant our developers would have to add multiple web parts on the page (text, images, snippets, …).
That is when the second crazy idea came. What if I create a static site generator for our team?
Doctor came to life
After that meeting, I did a quick proof of concept with the CLI for Microsoft 365 and Markdown web part in SharePoint. I never saw a real use-case in the web part, but it makes total sense for Doctor.
After some fiddling around, and some tests, it would work. All I had to do was create a new CLI for Microsoft 365 command, which allows updating the contents/properties of a web part.
INFO: The required command to create was spo page control set.
Once I created control set command, my next task was to build an internal tool we could use during a CI/CD. As I saw value for others and as Valo, we want to help others in the community. I made this an open-source project.
INFO: The reason for using the CLI for Microsoft is because it is feature-rich, and I do not want to reinvent the wheel. Using the CLI allows the tool to open many more possibilities in the future and build upon the shoulder of giants.
What makes Doctor great?
The great thing about Doctor is that you can keep the documentation as close to your code as you want. Of course, you do not have only to use it for development projects. You can also use it for other scenarios like documentation and architecture projects.
The tool itself will keep the pages up to date on SharePoint. During this process, it does the following:
- Check if the page exists. If not, it will create the page
- Check if the Markdown web part with a specific ID exists. If not, add it
- Update the Markdown from the current page to the web part

The process is straightforward but so powerful.
INFO: Right now, the tool does only create and update. It will not remove any content. I have already added this as an enhancement to the issue list: Specify if you allow pages to be removed on publish #7.
What makes it great to move your documentation with Doctor to Sharepoint?
For us, the move of our documentation to SharePoint has the following advantages:
- Dogfooding (as we have an intranet project, it is a great way to dogfood it as well).
- One platform to rule it all, but still, use the most familiar tools to use. For instance, HR can use SharePoint, but Development can use Markdown, and it all ends up on the same platform.
- Powerful search capabilities of Microsoft 365
- You can modify the page, add web parts to it, change its layout, and so much more as long as you keep the Markdown web part on the page. It will only update that.
- Your ID department will love it as they can manage security and do not have yet another platform to support it.
Getting started
If you want to get started, check out the documentation on getdoctor.io.
Installing the doctor on your machine can be done by running: npm i -g @estruyf/doctor.
To make your start as easy as possible, I shared a sample repository for you to use: doctor sample. Clone it, and get started.

What do you think?
Of course, you like your tools and see value in them, but what do you think? Would this be something you see yourself using? Do you face similar challenges in your company when it comes to where to write documentation?
Happy to chat about it in the discussion section of the repository.
Feedback?
In case you have feedback/ideas. Feel free to add them to the discussions section as well.
Can I contribute?
Yes, you can! It is for the community, so if you see the value and want to add something, please do a PR. I would be pleased to merge it and credit you with our changelog and socials.
Showcase how you are using Doctor
If you want, you can also showcase how you are using Doctor in your project/solution/company. Feel free to checkout showcase Doctor to find out more about how you can do this.
Happy documenting
by Contributed | Mar 10, 2021 | Technology
This article is contributed. See the original author and article here.
In the previous episode we provided recommendations about how to use the Microsoft 365 Defender API and, specifically, how to optimize the Advanced hunting query.
In this episode we will demonstrate use cases detailing how to access the API data and use this information in other products.
One of the most common uses of the API is for visualization in PowerBI. This provides the capability to analyze, visualize, and share your data with others quickly and easily.
If you are not familiar with PowerBi, we suggest you visit the Microsoft PowerBi web site, and download PowerBI desktop.
We already documented how to use PowerBI to create custom reports using
Microsoft Defender for Endpoint APIs connection to Power BI – Windows security | Microsoft Docs.
Today we would like to give you additional information on how to use Microsoft 365 APIs with PowerBi, specifically in the following use cases:
- Identifying onboarded devices and their health status
- Viewing the compliance status of the devices based on the security recommendations
- Aggregating alerts
- Using Aadvanced hunting queries to build a custom view
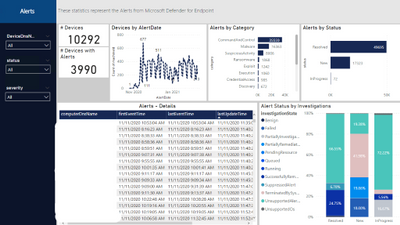
And build some visualizations like the following dashboard
Figure 1. Alert Status
Before you begin
Let’s start by connecting the Microsoft 365 APIs by opening the PowerBi desktop and add a new data source.
From the menu select “Get data” and add an “OData feed” connector to access the Microsoft 365 Defender API.

Figure 2. PowerBi connectors
Insert https://api.security.microsoft.com/api as the URL of the API.

Figure 3. OData feed connector
Provide your credentials.

Figure 4. Provide credentials
After the authentication you will see all the different APIs you can access.

Figure 5. Available APIs
NOTE: Be aware that not all APIs can be used to retrieve data as is with PowerBi, some will require additional parameters (e.g. the MachineAction API requires the DeviceID to properly retrieve data for the specific devices and can be used for example in scripts automation), or the AdvancedHunting and AdvancedQueries APIs require a KQL query as a parameter (we will provide an example later). In addition you should use only documented APIs, which means they are supported by the product. In this view you will get all APIs also ones that are still work in progress.
Get started
Now that you’ve added the connection, we can proceed with loading data.
Select the “Alerts” API.

Figure 6. Alerts APIs
You should see the data loaded in the Alerts table.

Figure 7. Alerts APIs – Available fields
Before moving on, let’s do some optimization to simplify and speed up the process of accessing additional data with other Microsoft 365 APIs.
From the top menu select “Transform Data”.

Figure 8. Transform data
Then, select “New Source”.

Figure 9. New Source
Then, select “Blank Query”.

Figure 10. Blank Query
Then select “Advanced Editor”.

Figure 11. Advanced Editor
Once you have the Advanced Editor open, replace the default code with the following code and save.

Figure 12. Advanced Editor – Content
(Query as text, ResultType as text) => if ResultType = “record” then
let
source = OData.Feed(“https://api.securitycenter.microsoft.com/api/” & Query, null, [Implementation=”2.0″, MoreColumns=true]),
#”toList” = {source},
#”toRecord” = Record.FromList(#”toList”, {“Record”})
in
#”toRecord”
else
let
source = OData.Feed(“https://api.securitycenter.microsoft.com/api/” & Query, null, [Implementation=”2.0″, MoreColumns=true]),
#”toTable” = #table(1, {{source}})
in
#”toTable”
Rename the Query1 to customODataQuery, as this will be the function name that we will use, passing different values as parameters it will allow us to retrieve data from different APIs.
We can also organize the queries in different groups to easy understand the different meaning.

Figure 13. Functions – customODataquery
We will now create a query by starting from a blank query and replacing the name of the API we want to access; we need to pass two parameters: the name of the API and the expected results type (“table” or “record”)
let
Source = customODataQuery(“alerts”,”table“)
in
Source

Figure 14. Advanced Editor – ODataAlerts
Follow the same steps to add additional APIs.

Figure 15. ODataAlerts
When you select one of the tables, you can expand the data.

Figure 16. ODataAlerts – Table
After the expansion you will see all the available columns.

Figure 17. ODataAlerts – Columns
Once you have loaded the tables you are ready to organize the data to visualize in a dashboard.
Check out some of the examples we provided in the PowerBi template published here.
The PowerBi template contains the following connection to the corresponding APIs:

Figure 18. PowerBi Template connections
Example dashboards and uses
Let’s take a look at some examples of dashboards and visualizations in PowerBI.
Microsoft Defender for Endpoint Onboarded Devices
This dashboard organizes the details of the onboarded devices.

Figure 20. Microsoft Defender for Endpoint Onboarded Devices page
To populate the data, we need the Machines API, so add another query as we did previously (use the customODataQuery PowerBi function we created previously) and specific the Machines API.
let
Source = customODataQuery(“Machines“,”table“)
in
Source
We also would like to adjust the timestamp to date, in this way we can use this field to create data aggregations by day.

Figure 21. Machines API – Query
The built-in APIs provide a lot of information to conduct a thorough investigation. You can also aggregate the data to tailor fit your investigation needs.
Should you find that additional information is needed to enhance the existing set of APIs, please let us know.
Microsoft Defender for Endpoint Security Control
This page aggregates the recommendations from Threat & Vulnerability Management. In this case we filtered for by Antivirus and Endpoint Detection and Response.

Figure 22. Security Recommendation – Security Control Summary page
To populate the data, we need the Recommendations API, so we will add another query as we did previously (use the customODataQuery PowerBi function we created previously) and specify the Recommendations API.
let
Source = customODataQuery(“Recommendations“,”table“)
in
Source
We also will need to expand the machineReferences field to join this information with the Machines table

Figure 23. Recommendations API – Query
This will quickly show you the overall compliance status of devices and give you an easy way to export a list of affected devices for remediation.
Microsoft Defender for Endpoint Agent Health Status
Should you wish to get some data based on a custom query, you can access the AdvancedHunting API.
In the previous episode of this series, we encouraged you to optimize and adopt best practices when writing your own queries; this becomes even more important when you plan to use a custom query with APIs to load data into PowerBi, because write efficient optimized queries will execute faster and will consume less resources
Let’s take this query Endpoint Agent Health Status Report from GitHub as an example, in PowerBI we defined 2 additional functions and we created a new query.
We can start with this template and replace the text with the query we would like to use
let
Source = customquery(“COPY YOUR QUERY HERE“)
in
Source
In our case we added this additional statement to return results from the last 24 hours.
| where Timestamp >= ago(24h)
Here you can see a way to represent the result in a visual format.

Figure 24. Microsoft Defender for Endpoint Agent Health Status page
Conclusion
In this post, we demonstrated how you can use the Microsoft 365 APIs and PowerBi to easlyeasily create a tailored dashboard that can help you create visualizations with key information or KPI. We covered the step-by-step instructions to access the Machines, Recommendations and Alerts APIs and how to build custom queries with Advanced hunting API , we used APIs to easily access the Microsoft 356 data and PowerBI to “translate” the date from tables in a visual format. We hope that this can be helpful for you and increase the creation of data visualizations.
Appendix
For more information about Microsoft 365 Defender APIs and the features discussed in this article, please read:
As always, we’d love to know what you think. Leave us feedback directly on Microsoft 365 security center or start a discussion in Microsoft 365 Defender community


Recent Comments