by Contributed | Mar 11, 2021 | Technology
This article is contributed. See the original author and article here.
There was some new Windows Server goodness announced at Microsoft Ignite by Bernardo Caldas, VP of Program Management from the Azure Edge and Platform team. In the Featured Session “Latest Azure Innovation for Windows Server and SQL Server” – he revealed some great nuggets of information about Windows Server 2022, Azure Stack HCI and new functionality that got some buzz called “Hotpatching”. I am willing to bet you didn’t catch something that’s worth talking about. It’s a new edition of Windows Server called Azure Edition. To be fair – its full name is: Windows Server 2019 Datacenter: Azure Edition.
That’s right – a special version of Windows Server 2019. This is a separate product that has a unique build number and codebase. It will be serviced in parallel to Windows Server 2019 Datacenter Core and will have the exact same feature set but will have one main addition – it supports hotpatching. Hotpatching is a new Windows Update technology that will provide significant update advantages due to its ability to apply patches in memory and not require a reboot of the server. Check out this quick demo video of Windows Server 2019 hotpatching in action:
For more complete details on Hotpatching, you can see the initial documentation about it on our docs site (Hotpatch for Windows Server Azure Edition (preview) | Microsoft Docs).
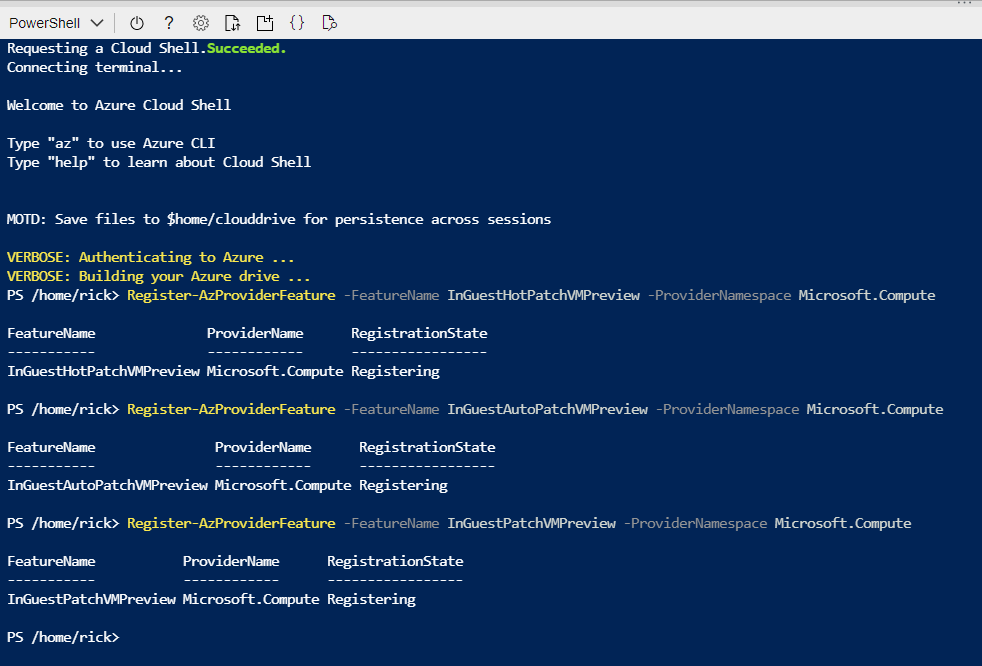
You want to get you hands dirty now? Start your testing early and try out Windows Server 2019 Datacenter: Azure Edition with your Microsoft Azure subscription. All you need to do is enroll your subscription into the Azure Update Manager preview. The easiest way to do this is to sign into the Azure Portal and open an Azure Cloud Shell instance from the top right corner. You will want to execute the following three powershell commands to enroll in the preview:
Register-AzProviderFeature -FeatureName InGuestHotPatchVMPreview -ProviderNamespace Microsoft.Compute
Register-AzProviderFeature -FeatureName InGuestAutoPatchVMPreview -ProviderNamespace Microsoft.Compute
Register-AzProviderFeature -FeatureName InGuestPatchVMPreview -ProviderNamespace Microsoft.Compute
Your output should look like this from a CloudShell prompt
The registration can take up to 15 minutes – you can check on it’s status with the Get-AzProviderFeature command:
Get-AzProviderFeature -FeatureName InGuestHotPatchVMPreview -ProviderNamespace Microsoft.Compute
Get-AzProviderFeature -FeatureName InGuestAutoPatchVMPreview -ProviderNamespclearace Microsoft.Compute
Get-AzProviderFeature -FeatureName InGuestPatchVMPreview -ProviderNamespace Microsoft.Compute
Once the status comes back as Registered, you can either wait some more or choose to propagate this down to the Compute Resource Provider faster with:
Register-AzResourceProvider -ProviderNamespace Microsoft.Compute
You should expect to have the following as a successful registration

Now that your subscription is enabled, you will want to deploy a new Virtual Machine from the Windows Server Operating Systems Preview image by searching for one in the Azure Marketplace OR by using this shortcut https://aka.ms/WindowsServerAzureEdition and clicking on the “GET IT NOW” button.

You can select the Windows Server 2019 Datacenter: Azure Edition from the drop down and click on Continue to start the deployment process in the Azure portal. I recommend you click on the CREATE button to have full visibility into the configuration options for this deploy.

Your VM will have a couple of additional configuration options in the Manage section, most notably “Enable Hotpatch (preview)” and “Patch Orchestration Options” with a single choice of “Azure-Orchestrated”. These will be enabled by default for your deployment.

Once deployment is complete you can see the details of hotpatching by going to the virtual Machine overview page and selecting Guest and Host Updates from the left hand side menu under the Operations section. From there – click on Go to Hotpatch (Preview)

You’ll notice there has been no evaluation of machines before. You can force an assessment by clicking on the Assess Now button.

Hotpatching works with cumulative updates on a monthly basis. Microsoft will issue baseline updates every three months in preview and hotpatch updates on the two months in-between each baseline. An example of this schedule is:

Your newly deployed Windows Server 2019 Datacenter: Azure Edition machine comes pre-installed with the latest updates and based on when you try this out – will require hotpatch updates to be current.

From this assessment you can choose Install Updates Now and fill in the details of what updates you wish to install and if you will allow a reboot. Click on the Install button to instruct the Azure Agent to proceed with the install.

Now you now have your first Windows Server 2019 Datacenter: Azure Edition machine setup for hotpatching. A reminder that you should not be using this machine in production as it is currently in preview for testing purposes. Windows Server Azure Edition will be serviced in parallel to Windows Server 2019 and will continue with future releases of Windows Server. Don’t forget – the only major difference between Windows Server 2019 Datacenter editions is the support for Hotpatching in Microsoft Azure.
Stay tuned for more updates on future releases of Windows Server as we get closer to general availability.
by Contributed | Mar 11, 2021 | Technology
This article is contributed. See the original author and article here.
There was some new Windows Server goodness announced at Microsoft Ignite by Bernardo Caldas, VP of Program Management from the Azure Edge and Platform team. In the Featured Session “Latest Azure Innovation for Windows Server and SQL Server” – he revealed some great nuggets of information about Windows Server 2022, Azure Stack HCI and new functionality that got some buzz called “Hotpatching”. I am willing to bet you didn’t catch something that’s worth talking about. It’s a new edition of Windows Server called Azure Edition. To be fair – its full name is: Windows Server 2019 Datacenter: Azure Edition.
That’s right – a special version of Windows Server 2019. This is a separate product that has a unique build number and codebase. It will be serviced in parallel to Windows Server 2019 Datacenter Core and will have the exact same feature set but will have one main addition – it supports hotpatching. Hotpatching is a new Windows Update technology that will provide significant update advantages due to its ability to apply patches in memory and not require a reboot of the server. Check out this quick demo video of Windows Server 2019 hotpatching in action:
For more complete details on Hotpatching, you can see the initial documentation about it on our docs site (Hotpatch for Windows Server Azure Edition (preview) | Microsoft Docs).
You want to get you hands dirty now? Start your testing early and try out Windows Server 2019 Datacenter: Azure Edition with your Microsoft Azure subscription. All you need to do is enroll your subscription into the Azure Update Manager preview. The easiest way to do this is to sign into the Azure Portal and open an Azure Cloud Shell instance from the top right corner. You will want to execute the following three powershell commands to enroll in the preview:
Register-AzProviderFeature -FeatureName InGuestHotPatchVMPreview -ProviderNamespace Microsoft.Compute
Register-AzProviderFeature -FeatureName InGuestAutoPatchVMPreview -ProviderNamespace Microsoft.Compute
Register-AzProviderFeature -FeatureName InGuestPatchVMPreview -ProviderNamespace Microsoft.Compute
Your output should look like this from a CloudShell prompt
The registration can take up to 15 minutes – you can check on it’s status with the Get-AzProviderFeature command:
Get-AzProviderFeature -FeatureName InGuestHotPatchVMPreview -ProviderNamespace Microsoft.Compute
Get-AzProviderFeature -FeatureName InGuestAutoPatchVMPreview -ProviderNamespclearace Microsoft.Compute
Get-AzProviderFeature -FeatureName InGuestPatchVMPreview -ProviderNamespace Microsoft.Compute
Once the status comes back as Registered, you can either wait some more or choose to propagate this down to the Compute Resource Provider faster with:
Register-AzResourceProvider -ProviderNamespace Microsoft.Compute
You should expect to have the following as a successful registration
Now that your subscription is enabled, you will want to deploy a new Virtual Machine from the Windows Server Operating Systems Preview image by searching for one in the Azure Marketplace OR by using this shortcut https://aka.ms/WindowsServerAzureEdition and clicking on the “GET IT NOW” button.
You can select the Windows Server 2019 Datacenter: Azure Edition from the drop down and click on Continue to start the deployment process in the Azure portal. I recommend you click on the CREATE button to have full visibility into the configuration options for this deploy.
Your VM will have a couple of additional configuration options in the Manage section, most notably “Enable Hotpatch (preview)” and “Patch Orchestration Options” with a single choice of “Azure-Orchestrated”. These will be enabled by default for your deployment.
Once deployment is complete you can see the details of hotpatching by going to the virtual Machine overview page and selecting Guest and Host Updates from the left hand side menu under the Operations section. From there – click on Go to Hotpatch (Preview)
You’ll notice there has been no evaluation of machines before. You can force an assessment by clicking on the Assess Now button.
Hotpatching works with cumulative updates on a monthly basis. Microsoft will issue baseline updates every three months in preview and hotpatch updates on the two months in-between each baseline. An example of this schedule is:
Your newly deployed Windows Server 2019 Datacenter: Azure Edition machine comes pre-installed with the latest updates and based on when you try this out – will require hotpatch updates to be current.
From this assessment you can choose Install Updates Now and fill in the details of what updates you wish to install and if you will allow a reboot. Click on the Install button to instruct the Azure Agent to proceed with the install.
Now you now have your first Windows Server 2019 Datacenter: Azure Edition machine setup for hotpatching. A reminder that you should not be using this machine in production as it is currently in preview for testing purposes. Windows Server Azure Edition will be serviced in parallel to Windows Server 2019 and will continue with future releases of Windows Server. Don’t forget – the only major difference between Windows Server 2019 Datacenter editions is the support for Hotpatching in Microsoft Azure.
Stay tuned for more updates on future releases of Windows Server as we get closer to general availability.
by Contributed | Mar 10, 2021 | Technology
This article is contributed. See the original author and article here.
Overview
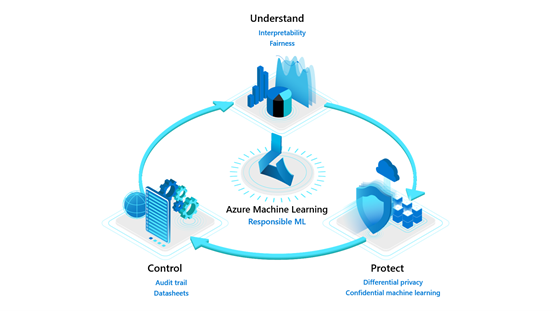
Model interpretability and fairness are part of the ‘Understand’ pillar of Azure Machine Learning’s Responsible ML offerings. As machine learning becomes ubiquitous in decision-making from the end-user utilizing AI-powered applications to the business stakeholders using models to make data-driven decisions, it is necessary to provide tools at scale for model transparency and fairness.
Explaining a machine learning model and performing fairness assessment is important for the following users:
- Data scientists and model evaluators – At training time to help them to understand their model predictions and assess the fairness of their AI systems, enhancing their ability to debug and improve models.
- Business stakeholders and auditors – To build trust with defined ML models and deploy them more confidently.
Customers like Scandinavian Airlines (SAS) and Ernst & Young (EY) put interpretability and fairness packages to the test to be able to deploy models more confidently.
- SAS used interpretability to confidently identify fraud in its EuroBonus loyalty program. SAS data scientists could debug and verify model predictions using interpretability. They produced explanations about model behavior that gave stakeholders confidence in the machine learning models and assisted with meeting regulatory requirements.
- EY utilized fairness assessment and unfairness mitigation techniques with real mortgage adjudication data to improve the fairness of loan decisions from having an accuracy disparity of 7 percent between men and women to less than 0.5 percent.
We are releasing enhanced experiences and feature additions for the interpretability and fairness toolkits in Azure Machine Learning, to empower more ML practitioners and teams to build trust with AI systems.
Model understanding using interpretability and fairness toolkits
These two toolkits can be used together to understand model predictions and their fairness through a loan allocation scenario using For this demonstration, we shall treat this as a loan decision problem. Let’s say that the label indicates whether each individual repaid a loan in the past. We will use the data to train a predictor to predict whether previously unseen individuals will repay a loan or not. The assumption is that the model predictions are used to decide whether an individual should be offered a loan.

Identify your model’s fairness issues
Our revamped fairness dashboard can help uncover the harm of allocation which leads to the model unfairly allocating loans among different demographic groups. The dashboard can additionally uncover harm of quality of service which leads to a model failing to provide the same quality of service to some people as they do to others. Using the fairness dashboard, you can identify if our model treats different demographics of sex unfairly.
Dashboard configurations
When you first load the fairness dashboard, you need to configure it with desired settings, including:
- selection of your sensitive demographic of choice (e.g., sex[1])
- model performance metric (e.g., accuracy)
- fairness metric (e.g., demographic parity difference).
Model assessment view
After setting the configurations, you will land on a model assessment view where you can see how the model is treating different demographic groups.
https://channel9.msdn.com/Shows/Docs-AI/loan-allocation-fairness-toolkit/player
Our fairness assessment shows an 18.3% disparity in the selection rate (or demographic group difference). According to that insight, 18.3% more males are receiving qualifications for loan acceptance compared to females. Now that you’ve seen some unfairness indicators in your model, you can next use our interpretability toolkit to understand why your model is making such predictions.
Diagnose your model’s predictions
The new revamped interpretability dashboard greatly improves the user experience of the previous dashboard. In the loan allocation scenario, you can understand how a model treats female loan applicants differently than male loan applicants using the interpretability toolkit:
https://channel9.msdn.com/Shows/Docs-AI/loan-allocation-interpretability/player
- Dataset cohort creation: You can slice and dice your data into subgroups (e.g., female vs. male vs. unspecified) and investigate or compare your model’s performance and explanations across them.
- Model performance tab: With the predefined female and male cohorts, we can observe the different prediction distributions between males and female cohorts, with females experiencing higher probability rates of being rejected for a loan.
- Dataset explorer tab: Now that you have seen in the model performance tab how females are rejected at a higher rate than males, you can use the data explorer tab to observe the ground truth distribution between males and females. For males, the ground truth data is well balanced between those receiving a rejection or approval whereas, for females, the ground truth data is heavily skewed towards rejection thereby explaining how the model could come to associate the label ‘female’ with rejection.
- Aggregate feature importance tab: Now we observe which top features contribute to the model’s overall prediction (also called global explanations) towards loan rejection. We sort our top feature importances by the Female cohort, which indicates that while the feature for “Sex” is the second most important feature to contribute towards the model’s predictions for individuals in the female cohort, they do not influence how the model makes predictions for individuals in the male cohort. The dependence plot for the feature “Sex” also shows that only the female group has positive feature importance towards the prediction of being rejected for a loan, whereas the model does not look at the feature “Sex” for males when making predictions.
- Individual feature importance & What-If tab: Drilling deeper into the model’s prediction for a specific individual (also called local explanations), we look at the individual feature importances for only the Female cohort. We select an individual who is at the threshold of being accepted for a loan by the model and observe which features contributed towards her prediction of being rejected. “Sex” is second most important feature contributing towards the model prediction for this individual. The Individual Conditional Expectation (ICE) plot calculates how a perturbation for a given feature value across a range can impact its prediction. We select the feature “Sex” and can see that if this feature had been flipped to male, the probability of being rejected is lowered drastically. We create a new hypothetical What-If point from this individual data point and switch only the “Sex” from female to male, and observe that without changing any other feature related to financial competency, the model now predicts that this individual will have their loan application accepted.
Once some potential fairness issues are observed and diagnosed, you can move to mitigate those unfairness issues.
Mitigate unfairness issues in your model
The unfairness mitigation part is powered by the Fairlearn open-source package which includes two types of mitigation algorithms: postprocessing algorithms (ThresholdOptimizer) and reduction algorithms (GridSearch, ExponentiatedGradient). Both operate as “wrappers” around any standard classification or regression algorithm. GridSearch, for instance, treats any standard classification or regression algorithm as a black box, and iteratively (a) re-weight the data points and (b) retrain the model after each re-weighting. After 10 to 20 iterations, this process results in a model that satisfies the constraints implied by the selected fairness metric while maximizing model performance. ThresholdOptimizer on the other hand takes as its input a scoring function that underlies an existing classifier and identifies a separate threshold for each group to optimize the performance metric, while simultaneously satisfying the constraints implied by the selected fairness metric.
The original fairness dashboard also enables the comparison of multiple models, such as the models produced by different learning algorithms and different mitigation approaches. Bypassing the dominated models of GridSearch for instance, you can see the unmitigated model on the upper right side (with the highest accuracy and highest demographic parity difference) and can click on any of the mitigated models to observe them further. This allows you to examine trade-offs between performance and fairness.

Comparing results of unfairness mitigation
After applying the unfairness mitigation, we go back to the interpretability dashboard and compare the unmitigated model with the mitigated model. In the figure below, we see a more even probability distribution for the female cohort for the mitigated model on the right:

Revisiting the fairness assessment dashboard, we also see a drastic decrease in demographic parity difference from 18.8% (unmitigated model) to 0.412% (mitigated model):

Saving model explanations and fairness metrics to Azure Machine Learning Run History
Azure Machine Learning’s (AzureML) interpretability and fairness toolkits can be run both locally and remotely. If run locally, the libraries will not contact any Azure services. Alternatively, you can run the algorithms remotely on AzureML compute and log all the explainability and fairness information into AzurML’s run history via the AzureML SDK to save and share them with other team members or stakeholders in AzureML studio.


AzureML’s Automated ML supports explainability for its best model as well as on-demand explainability for any other models generated by Automated ML.
Learn more
Explore this scenario and other sample notebooks in the Azure Machine Learning sample notebooks GitHub.
Learn more about the Azure Machine Learning service.
Learn more about Responsible ML offerings in Azure Machine Learning.
Learn more about interpretability and fairness concepts and see documentation on how-to guides for using interpretability and fairness in Azure Machine Learning.
Get started with a free trial of the Azure Machine Learning service.
[1] This dataset is from the 1994 US Census Bureau Database where “sex” in the data was limited to binary categorizations.
by Contributed | Mar 10, 2021 | Technology
This article is contributed. See the original author and article here.
The Azure Service Fabric 7.2 seventh refresh release includes stability fixes for standalone, and Azure environments and has started rolling out to the various Azure regions. The updates for .NET SDK, Java SDK and Service Fabric Runtime will be available through Web Platform Installer, NuGet packages and Maven repositories in 7-10 days within all regions.
This update will only be available through manual upgrades. Clusters set to automatic upgrades will not receive this update unless toggled to manual.
- Service Fabric Runtime
- Windows – 7.2.477.9590
- Ubuntu 16 – 7.2.476.1
- Ubuntu 18 – 7.2.476.1804
- Service Fabric for Windows Server Service Fabric Standalone Installer Package – 7.2.477.9590
- .NET SDK
- Windows .NET SDK – 4.2.477
- Microsoft.ServiceFabric – 7.2.477
- Reliable Services and Reliable Actors – 4.2.477
- ASP.NET Core Service Fabric integration – 4.2.477
- Java SDK – 1.0.6
Key Announcements
- Support for Service Fabric 7.1 will be extended until July 31st, 2021.
- Key Vault references for Service Fabric applications are now GA on Windows and Linux.
- .NET 5 apps for Windows on Service Fabric are now supported as a preview.
- .NET 5 apps for Linux on Service Fabric will be added in the Service Fabric 8.0 release.
For more details, please read the release notes.
by Contributed | Mar 10, 2021 | Technology
This article is contributed. See the original author and article here.
For a lot of people, a project is more than a set of tasks with the team members assigned to work on them. You may need to track issues or risks or a process to decide which projects even get funded. This all can be done by extending Project for the web through Power Apps. To make it easier for you to get started, we are providing the Project Accelerator, which builds out these kinds of scenarios for you.
The Project Accelerator enables several scenarios in Project:
Proposals
No one has enough time or resources to pursue every great idea. Through project requests, you can gather a set of information to help you decide which requests get funded and turned into projects. Take this to the next level by integrating your process with Power Automate.

Programs
As you run more projects, it is ideal to be able to organize them into programs so you can easily step back and see the bigger picture.

Risks
With any project, there are risks that need to be tracked so you can prepare in advance to either avoid or deal with them.

Issues
Anyone in project management knows that issues come up as a project progresses – maybe the weather isn’t favorable or maybe something disrupts the supply chain. Whatever it is, you want to track the issue, know who is driving the mitigation, and clearly see the next steps.

Changes
As projects progress, there are going to be changes such as scope, design, or maybe an outcome of an issue mitigation. Tracking that change is key so everyone can look back and understand the history of the project.
Status
As your project progresses, you want to routinely update stakeholders on how the project is tracking on key health indicators and even create status reports around what has been accomplished and what’s up next.

With the accelerator, everything is customizable. See a field that isn’t relevant to you? Remove it! Want a different set of choices for fields like Strategic Alignment? Great! Change them! Most changes don’t even involve writing code. Just go into the Power App, update the tables, update the forms, and voila! your changes are live.
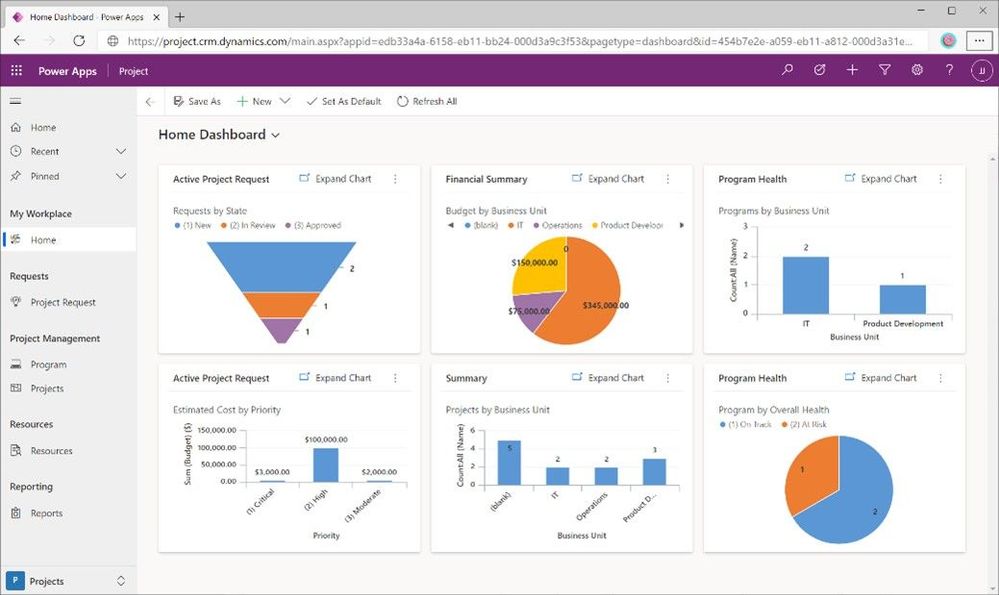
As this is built on Power Apps, you also can easily add charts to better visualize your data directly in the Power App. The accelerator provides a set, but again, you can easily customize these to meet your needs.

To deploy the Accelerator in your environment, get started in GitHub. In that site, you’ll find information about how to deploy it, a Power BI template that you can use alongside it, as well as details about licenses that you’ll need to run it.

Recent Comments