This article is contributed. See the original author and article here.
SAP has released security updates to address vulnerabilities affecting multiple products. An attacker could exploit some of these vulnerabilities to take control of an affected system.
This article is contributed. See the original author and article here.
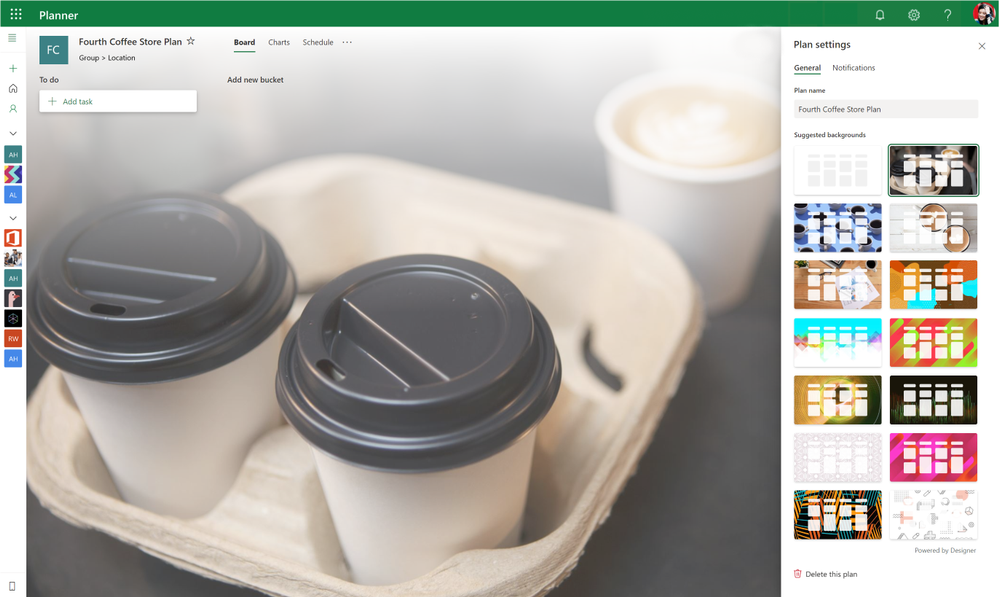
Planner enables us to visualize our work in a fun and flexible way. But it can be difficult to identify which plan you are in, especially when you’re a member of 50 different plans that look the same.
That’s why we’re excited to begin rolling out smart backgrounds, which lets you customize your Planner boards to make them your own and help others quickly find the right plan. We’re starting to roll out smart backgrounds in Planner for the web this week.
With smart backgrounds, you can choose from a variety of image recommendations to liven up your Planner boards. Smart backgrounds is powered by the same Designer feature that suggests creatively designed templates in PowerPoint. Designer works in the background, trying to match the title of your plan with relevant and unique high-quality background images, like a coffee scene for your Coffee Store plan, a business backdrop for your Online Marketing plan, or a city skyline for your Town Hall Meeting plan.
To access recommended background images, click on Plan settings from the dropdown menu under (…). With one click or tap, you can personalize, differentiate, and more easily identify your plans and task cards.
Smart backgrounds is currently only available in the Planner web experience.
Tell us what you think! We love hearing feedback from the Planner community, so leave a comment below or head over to Planner’s UserVoice to vote on and share new ideas. And keep checking the Tech Community Blog site for the latest Planner updates and other task management news.
This article is contributed. See the original author and article here.
As the world of sales is increasing its adoption of digital transformation, we are looking for ways to help boost your sales teams’ productivity and give them tools, like conversation intelligence, that help them focus on winning deals without distractions.
After talking to sellers and managers from different sales teams, we found that the tasks that are the most energy-consuming during calls and time-consuming after calls are capturing action items, and later following up on them.
As a seller, your daily routine is full of calls with different customers regarding various deals. In each call, you need to note all your commitments to your customer and try to remember what the customer committed to do. Later, you need to find the time to follow up on those commitments: send a follow-up email, set up meetings, update information regarding the deal, and much more.
Starting today, you can forget about forgetting. With this update to action items, you can focus on what really mattersbeing more engaged in the conversation and gaining the customer’s trust.
Action items updates in conversation intelligence
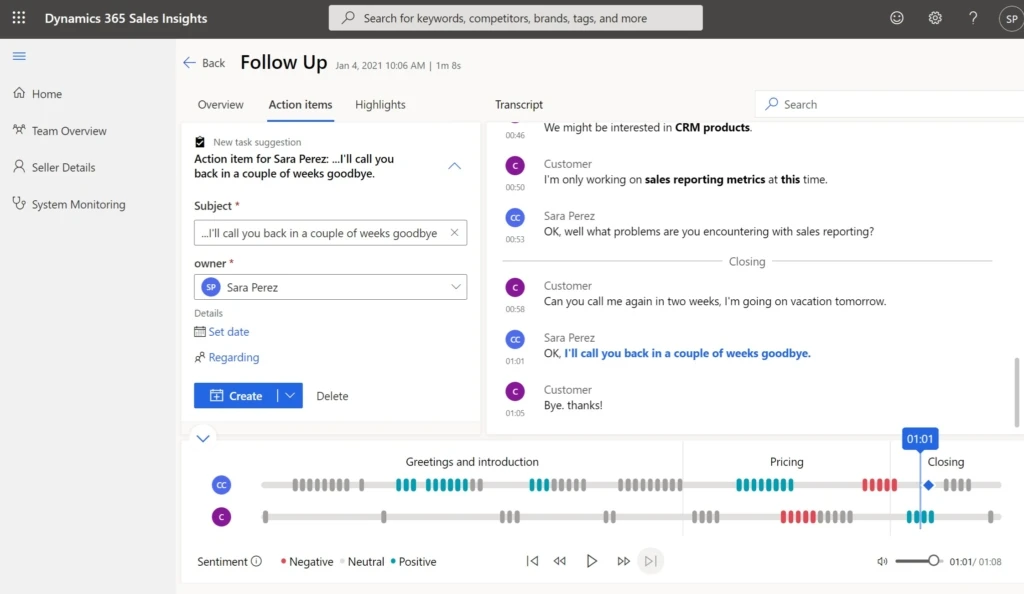
In the first version of action items, we identified commitment sentences during the call and presented the seller with a quote of the commitments.
In this action items version, which was released as part of Dynamics 365 2020 release wave 2, there is an improved artificial intelligence model that better captures and contextually understands the commitments that you or your customer made throughout the call.
It has robust capabilities that not only capture the action items but also make them more comprehendible and actionable. In just a few clicks you can send an email, set up a meeting, or add a phone call activity or a task. No need to juggle between different apps. In this design, we give you an all-in-one app experience.
The action items updates integrate with our new call summary page design, to give the best user experience to the sellers and managers. Now, by a quick overview, you can understand which topics were discussed in different parts of the call and what was the sentiment there. Then you can drill down further to a specific point of interest and see the insights for that segment. Thus, you can better understand the customer’s needs and wishes.
Getting started with conversation intelligence
To understand the full capabilities of Dynamics 365 Sales Insights and the value it brings to Dynamics 365 sales customers, visit Dynamics 365 Sales, check out the sales insights add-in datasheet, or read these FAQs where you’ll find a list of supported languages and answers to other common questions.
Next steps
If you’re currently using conversation intelligence and have any feedback, questions, or suggestions, we’d like to hear from you on the Ideas forum.
This article is contributed. See the original author and article here.
At Azure Sentinel we take pride in the ability to ingest data from a variety of sources(learn more).
However, data ingestion time may vary for different data sources under different circumstances.
In this blog post we will address the delay challenge: understanding the impact of the ingestion delay and how to fix it.
Why is the delay significant?
When ingesting data into Sentinel we might encounter delays for a variety of reasons.
These delays might affect our scheduled queries in the following way:
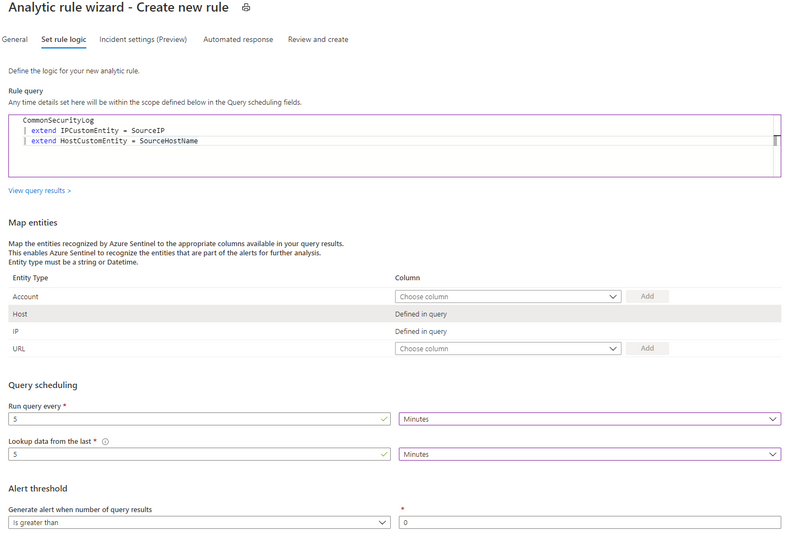
When writing a custom detection rule, we set the “Run query every” and the “Lookup data from the last” parameters.
For our , let’s assume we run our query every five minutes and lookup data in a five-minute “look-back” window.
Ideally (when there is no delay), this detection will not miss any events.
So, how would it look?
The event arrives as it is generated, and the window contains the event as we wanted.
Now, assume there is some delay for our data source.
For this example, let’s say the event was ingested 2 minutes after it was generated (delay of 2 minutes).
Example #1:
As we see, the event is generated within the first “look-back” window, but on the first run the event is not ingested into the workspace.
No big deal – after all, we’ll catch it on the second run, right?
Wrong! The next time the query is scheduled to run, the event has been ingested, however it will be filtered out by the time-generated filter (since it happened more than five minutes ago), and the rule won’t fire an alert.
So, what can I do?
How to handle the delay:
To solve the issue, we’ll need to be able to know what is the delay for our data type.
In our example it was easy since we knew it was 2 minutes.
But we can figure it out by using the Kusto function “ingestion_time()” and calculating the difference between “TimeGenerated” and the ingestion time – we will talk more about it later.
So, after finalizing the number we can try to address our problem.
The basic intuition is probably telling you – “We need to increase the window size. It will help us”.
You are correct: this is indeed a part of the solution.
Since our “look-back” window is 5 minutes, and our delay is 2 minutes we will set the “look-back” window to 7 minutes.
We can see now that our missed event is contained in the “look-back” window (7 minutes), problems solved.
As you can probably realize by now, we can create duplication since the look back windows overlap.
For a different event, the following diagram applies.
Example #2:
Since the event “TimeGenerated” is in both windows it will fire 2 alerts meaning we need to find a way to solve the duplication. Going back to our original problem (example #1), we missed events since our data wasn’t ingested when our scheduled query ran. Then we extended the “look-back” to include the event but caused duplication. So, we would like to associate the event to the window we extended to contain it. Meaning: ingestion_time() > ago(5m) (original rule “look-back” = 5min). This will associate our event from the previous example to the first window.
As we can see the ingestion time restriction trims the additional 2 minutes added to the look back.
And for our previous example we can see that the event is captured by the second run look-back window.
This query summarizes it up:
let ingestion_delay= 2min;
let rule_look_back = 5min;
CommonSecurityLog
| where TimeGenerated >= ago(ingestion_delay + rule_look_back)
| where ingestion_time() > (rule_look_back)
Now when we know how to tackle the ingestion delay that was given to us let’s see how we can determine the ingestion delay by ourselves.
Note: when joining multiple tables each has its own delay, we need to take it into consideration.
Calculating ingestion delay:
Ingestion delay may be caused from a verity of reasons and may change according to the source of the data.
Azure Sentinel collects logs from multiple sources which means that we may see different delays.
This blog post provides a dashboard holding latency and delays for the different data types flowing into the workspace.
In the following example we calculated the 99 and 95 percentiles of delay by the Device Vendor and Device product (for the common security logs table).
Note: when joining multiple data types, we need to understand what kind of changes to apply to the “look-back“.
This article is contributed. See the original author and article here.
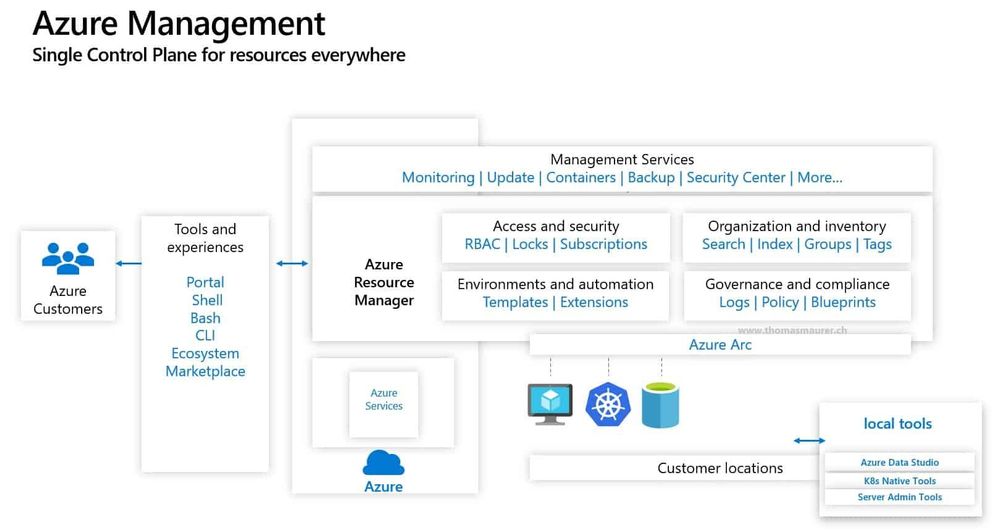
In this Azure Arc video, I want to share the latest Azure Arc hybrid cloud management capabilities. Hybrid Cloud management becomes more and more important for many customers. We are seeing the customers taking advantage of cloud computing, but at the same time have the need to run applications on-premises or at other cloud providers. These can have multiple reasons like data sovereignty, network latency and connectivity, leveraging your existing investments, and many more. However, by running applications and services in different locations, we can also see that most environments get more complex to manage. This is whereMicrosoft Azure Arccan help you to connect services outside of Azure, running on-premises, other cloud providers, or at the edge, and use Microsoft Azure as a single control plane to manage your hybrid infrastructure and applications.
Azure Arc Hybrid Cloud Management Control Plane
A while ago, I presented an overview of Azure Arc with the latest capabilities at an online conference. Since I get a lot of questions, I thought that I should share a recording of my presentation with all of you. Here is my Azure Arc video, 2021 edition:
In this video, you will see how you can manage and govern your Windows and Linux machines hosted outside of Azure on your corporate network or other cloud providers, similar to how you manage native Azure virtual machines. When a hybrid machine is connected to Azure, it becomes a connected machine and is treated as an Azure resource. Azure Arc provides you with the familiar cloud-native Azure management experience, like RBAC, Tags, Azure Policy, Log Analytics, and more.
If you want to learn more on Azure Arc, we also have aMicrosoft Learn learning path, which will provide you with some guided learning modules.
I hope this Azure Arc video provides you with a short overview of how you can use Azure Arc as a single control plane to manage resources outside of Azure. For more Hybrid Cloud architectures, check out my blog onhow to create Azure Hybrid Cloud Architectures. If you have any questions, feel free to leave a comment below.


Recent Comments