This article is contributed. See the original author and article here.
At Azure Sentinel we take pride in the ability to ingest data from a variety of sources(learn more).
However, data ingestion time may vary for different data sources under different circumstances.
In this blog post we will address the delay challenge: understanding the impact of the ingestion delay and how to fix it.
Why is the delay significant?
When ingesting data into Sentinel we might encounter delays for a variety of reasons.
These delays might affect our scheduled queries in the following way:
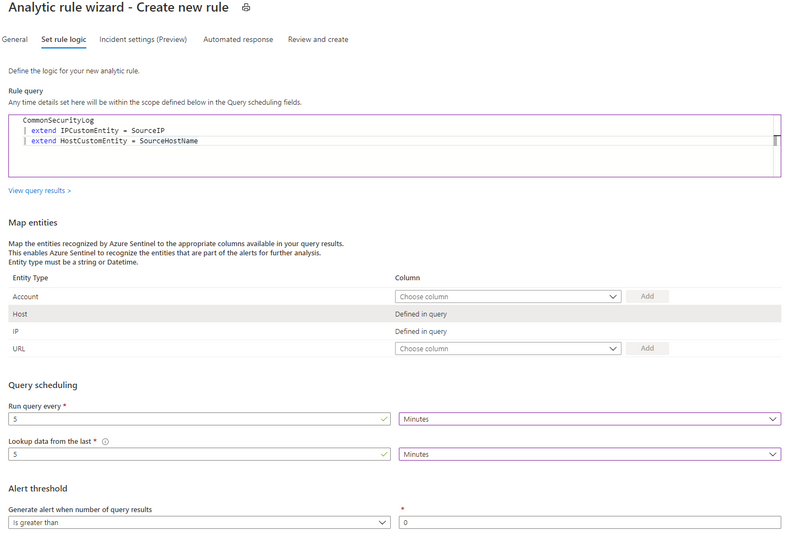
When writing a custom detection rule, we set the “Run query every” and the “Lookup data from the last” parameters.
For our , let’s assume we run our query every five minutes and lookup data in a five-minute “look-back” window.
Ideally (when there is no delay), this detection will not miss any events.
So, how would it look?

The event arrives as it is generated, and the window contains the event as we wanted.
Now, assume there is some delay for our data source.
For this example, let’s say the event was ingested 2 minutes after it was generated (delay of 2 minutes).
Example #1:

As we see, the event is generated within the first “look-back” window, but on the first run the event is not ingested into the workspace.
No big deal – after all, we’ll catch it on the second run, right?
Wrong! The next time the query is scheduled to run, the event has been ingested, however it will be filtered out by the time-generated filter (since it happened more than five minutes ago), and the rule won’t fire an alert.
So, what can I do?
How to handle the delay:
To solve the issue, we’ll need to be able to know what is the delay for our data type.
In our example it was easy since we knew it was 2 minutes.
But we can figure it out by using the Kusto function “ingestion_time()” and calculating the difference between “TimeGenerated” and the ingestion time – we will talk more about it later.
So, after finalizing the number we can try to address our problem.
The basic intuition is probably telling you – “We need to increase the window size. It will help us”.
You are correct: this is indeed a part of the solution.
Since our “look-back” window is 5 minutes, and our delay is 2 minutes we will set the “look-back” window to 7 minutes.

We can see now that our missed event is contained in the “look-back” window (7 minutes), problems solved.

As you can probably realize by now, we can create duplication since the look back windows overlap.
For a different event, the following diagram applies.
Example #2:

Since the event “TimeGenerated” is in both windows it will fire 2 alerts meaning we need to find a way to solve the duplication.
Going back to our original problem (example #1), we missed events since our data wasn’t ingested when our scheduled query ran.
Then we extended the “look-back” to include the event but caused duplication.
So, we would like to associate the event to the window we extended to contain it.
Meaning: ingestion_time() > ago(5m) (original rule “look-back” = 5min).
This will associate our event from the previous example to the first window.

As we can see the ingestion time restriction trims the additional 2 minutes added to the look back.
And for our previous example we can see that the event is captured by the second run look-back window.

This query summarizes it up:
let ingestion_delay= 2min;
let rule_look_back = 5min;
CommonSecurityLog
| where TimeGenerated >= ago(ingestion_delay + rule_look_back)
| where ingestion_time() > (rule_look_back)
Now when we know how to tackle the ingestion delay that was given to us let’s see how we can determine the ingestion delay by ourselves.
Note: when joining multiple tables each has its own delay, we need to take it into consideration.
Calculating ingestion delay:
Ingestion delay may be caused from a verity of reasons and may change according to the source of the data.
Azure Sentinel collects logs from multiple sources which means that we may see different delays.
This blog post provides a dashboard holding latency and delays for the different data types flowing into the workspace.
In the following example we calculated the 99 and 95 percentiles of delay by the Device Vendor and Device product (for the common security logs table).
Note: when joining multiple data types, we need to understand what kind of changes to apply to the “look-back“.

The query:
CommonSecurityLog
| extend delay = ingestion_time() - TimeGenerated
| summarize percentiles(delay,95,99) by DeviceVendor, DeviceProduct
Now that we have this data, we can know what kind of changes to apply to the “look-back” based on the delay that we have.
The fact that we distinguish between different sources emphasize the different delay from different data types.
Important to know: Azure Sentinel scheduled alert rules are delayed by 5min.
This allows data types with a smaller delay to be ingested on time for the scheduled run.
For more information, please visit our documentation.
Brought to you by Dr. Ware, Microsoft Office 365 Silver Partner, Charleston SC.

Recent Comments