by Contributed | Apr 9, 2022 | Technology
This article is contributed. See the original author and article here.
The SQL Server Profiler using SQL Server Management Studio (SSMS) currently support Azure SQL Manage Instance and SQL Server platforms and does not support Azure SQL DB platform, so as a workaround we can use SQL Server Profiler extension for Azure Data Studio (ADS).
“The SQL Server Profiler extension provides a simple SQL Server tracing solution similar to SQL Server Management Studio (SSMS) Profiler except built using Extended Events. SQL Server Profiler is very easy to use and has good default values for the most common tracing configurations. The UX is optimized for browsing through events and viewing the associated Transact-SQL (T-SQL) text. The SQL Server Profiler for Azure Data Studio also assumes good default values for collecting T-SQL execution activities with an easy to use UX. This extension is currently in preview.” More information can be found here.
In this article we will cover the below contents:
- How to use the SQL Server Profiler extension for Azure SQL DB.
- How to export the output session into an XML-file (.xml).
- How to export the output session into an XEL-file (.xel) and store it into an Azure Storage Account.
Prerequisites:
How to use the SQL Server Profiler extension for Azure SQL DB:
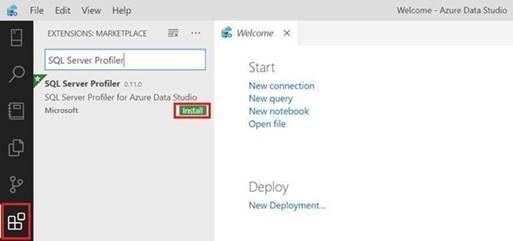
- Open ADS and click on Extensions from the left-side then search for SQL Profiler For Azure Data Studio and finally click on Install, please have look at the below snapshot:
- Click on Connections (Left-side), then click on Add Connection, please have a look at the below snapshot:

- In the add new connection dialog, fill in your Azure SQL Server information and select the database, please have a look at the below snapshot:

- In the create new firewall rule, click on reenter your credentials, please have a look at the below snapshot:

- After entering your credentials and back to the firewall rule dialog, select add my client IP and then click OK, please have a look at the below snapshot:

- After that you will be back to the connection dialog, then select your database and click connect, please have a look at the below snapshot:

- After establishing a connection, right-click on your Azure SQL database and select Launch profiler (Alt+P), please have a look at the below snapshot:

- From Start New Profiler Session dialog, enter session name and click on Start, please have a look at the below snapshot:

- A profiler tab will appear with all the events that is currently running on the Azure SQL database, please have a look at the below snapshot:

- Right-click on your Azure SQL database and select New Query, please have a look at the below snapshot:

- Enter your specified query and click on Run, then click on the profiler tab and you will notice your query event is logged, please have a look at the below snapshot:

How to export the output session into an XML-file (.xml):
- Open SSMS and connect to your Azure Database.
- Open Extended Events and select the session that you have created in Azure Data Studio.
- Right-click on the session buffer and select View Target Data.
- In the Session buffer tab (in the right-side) right-click and select Refresh (XML data will be created).
- Click on XML Data and save the new view tab as XML and please send it to me.
Please have a look at the following snapshots:


How to export the output session into an XEL-file (.xel) and store it into an Azure Storage Account:
- From SSMS, right-click on your session and select properties
- From session properties, select Data Storage to and enter your Azure Storage Account to save the file as “.xel” as shown in the below image and click OK.
- From SSMS, right-click on your session and select start session (if not running already).
- After you finish from capturing events, open your storage account where you saved your “.xel” file.
- Download it into your local machine then open it using SSMS and follow this document to export the results into table to be able to filter the results as per your needs.

More information can be found in the below document:
by Contributed | Apr 8, 2022 | Technology
This article is contributed. See the original author and article here.
This blog shows how to create dashboards to visualize the performance of the sample manufacturing operation presented in the blog Rewind the Metaverse with Data History for Azure Digital Twins. You can use these examples to build your own dashboards to analyze the behavior of environments that you model using Azure Digital Twins.
To get started, complete the following prerequisites.
- Gain access to a Grafana resource where you can create your dashboards.
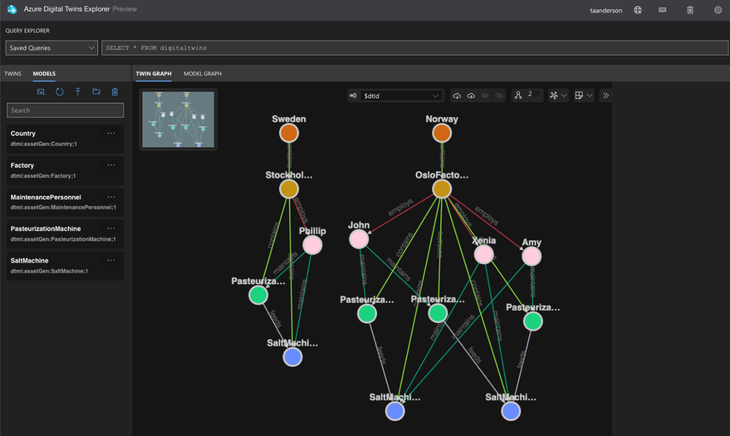
- Complete the steps in the above-mentioned blog or in the article Use data history with Azure Data Explorer. Upon completion, you will have a working data history connection between Azure Digital Twins and Azure Data Explorer that enables you to perform historical analytics on a simulated dairy operation containing factories, people, and machines across multiple locations. Below is a visualization of the twin graph of the dairy operation created during the exercise.
Next, follow the below steps to create dashboards to visualize the performance of the dairy operation.
Connect Grafana to an Azure Data Explorer data source
The data history feature for Azure Digital Twins historizes twin changes to an Azure Data Explorer database. You can connect this database to Grafana by following the steps in Visualize data from Azure Data Explorer in Grafana (the video included in the guide is a great place to start). When installing the Azure Data Explorer plugin, make sure that the plugin is version 3.6.1 or higher.
Assign your app registration the Azure Digital Twins Data Reader role
In the above step, you will create an app registration. Assign this app registration the Azure Digital Twins Data Reader role on your Azure Digital Twins instance. This will enable the KQL queries run by the dashboards to query your Azure Digital Twins instance.
Start by viewing your Azure Digital Twins instance in the portal. Select Access Control (IAM) from the left navigation and select Add role assignment.

In the next screen, select the Azure Digital Twins Data Reader role, and select Next.

In the next screen, choose +Select members. Search for the name of your app registration and choose Select.

On the next screen, select Review + assign.
Import the Contoso Dairy dashboards into Grafana
Three dashboard JSON files are provided in this repo folder. Download the files. Import the Machine View by Factory, Maintenance Technician dashboard into Grafana as shown below.

In the import dialog, select the Azure Data Explorer data source you created earlier and enter values for your Azure Digital Twins endpoint and data history table name. Complete this same process for the other dashboard JSON files.

Once a dashboard loads, you will see time series charts and gauges for machines in the dairy operation. You can make selections from the dropdown menus at the top to drill down on the machines of interest.

When you select an item from the menu, it triggers a query to the twin graph of the dairy operation that searches for twins based on twin name, twin type, relationships between twins, and other parameters. The result of the query is held in a Grafana variable. To view variables, click on the gear icon in the upper right-hand corner of a dashboard, then click on Variables in the left navigation panel.

The KQL queries for most variables dynamically assemble an Azure Digital Twins query via the strcat() KQL function. In many cases, the assembled Azure Digital Twins query references other Grafana variables from other menus. Grafana denotes variables in a query expression with a $. For example, the MaintTech variable is based on a query that searches for all twins that have an employs relationship with a factory twin, where the factory twin ID is defined by the Factory variable. The result of the query is held in the MaintTech Grafana variable.
You can also view the KQL queries that fetch data for a panel. Click on Edit to view the panel query.

In the editor, you can view the query for each tile that uses Grafana variables. These variables are driven by the menu queries discussed above.

Conclusion
In this walkthrough, you learned how to use Grafana to support visualization experiences for environments modeled in Azure Digital Twins. The relationships in the underlying twin graph of the dairy operation combined with time series data enable a variety of performance analytics. Example analytics include summing the output of machines that feed a common downstream machine, comparing the performance of similar machines in the same factory, or comparing machines in different factories. Explore the query for each Grafana dashboard in this blog as well as additional queries here for more examples.
by Scott Muniz | Apr 7, 2022 | Security, Technology
This article is contributed. See the original author and article here.
CISA’s Sharing Cyber Event Information Fact Sheet provides our stakeholders with clear guidance and information about what to share, who should share, and how to share information about unusual cyber incidents or activity.
CISA uses this information from partners to build a common understanding of how adversaries are targeting U.S. networks and critical infrastructure sectors. This information fills critical information gaps and allows CISA to rapidly deploy resources and render assistance to victims suffering attacks, analyze incoming reporting across sectors to spot trends, and quickly share that information with network defenders to warn other potential victims. Click the fact sheet link to learn more and visit our Shields Up site for useful information.
by Contributed | Apr 7, 2022 | Technology
This article is contributed. See the original author and article here.
In our continued effort to improve collaboration in Visio for the web, we’re excited to announce the availability of the popular Office feature, @mentions. This capability makes it easier to collaborate on shared diagrams by giving you the ability to get someone’s attention directly within the comments pane and pull them into the file where you need their input.
Here’s how it works
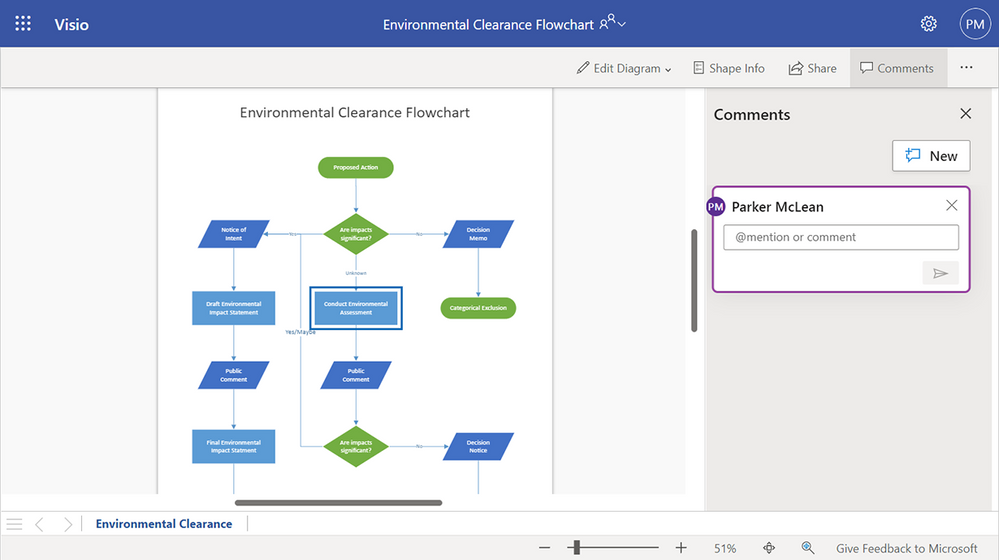
To get started, sign in to visio.office.com and open an existing Visio file saved on SharePoint or OneDrive. By default, the file will open in Visio Viewer. To add a new comment to the page itself, select Comments > New. You can also add a new comment to any object on the page, such as a shape or connector by selecting the object and then selecting Comments > New.
Example of a new comment being created in Visio Viewer.
Alternatively, you can open the file in Visio Editor by selecting Edit Diagram > Edit in Browser. Right-click anywhere on the page or on any object on the page and add a new comment by selecting New Comment from the floating context menu that appears on right-click or from the Insert or Review tab > New Comment. Type “@” and the first few letters of the person’s first or last name. You’ll see a drop-down list of contacts that updates as you type more characters. Select the name of the person you’d like to tag.
 Example of a list of names that auto-populates when using the @mention feature in Visio for the web.
To be more casual, you can delete everything except the person’s first name in the @mention. To include more people, type “@” again and mention someone else.
 Example of a posted comment using the @mention feature in Visio for the web.
Note, if the person you are mentioning does not already have permission to open the Visio file, you will be asked to provide them with access.
 Example of the Share dialogue box that appears when a recipient does not have access to a file.
An email notification that includes a preview of the comment thread and diagram will automatically be sent to the person(s) you tag. In addition, the email notification includes a link that will take them to the comment in the file. This link will open the file in Visio Viewer, bringing them directly into the diagram and into the conversation. The person can either reply to the comment thread directly in Visio Viewer or open the diagram in Visio Editor by selecting Edit in Browser from the Edit Diagram drop-down.
 Example of an email notification showing a preview of the comment thread and flowchart, as well as a direct link to view the comment in the document.
If someone gets mentioned more than once in a short period of time, they will receive a batch of notifications in a single summary email.
Availability
The ability to @mention your colleagues in a Visio file is now available in the Viewer and Editor in both Visio for the web and Microsoft Teams.
Requirements and known limitations
- The file must be saved in SharePoint or OneDrive.
- Tenants with Conditional Access will not be able to create @mentions. Please contact your IT Administrator for more information.
- The @mentions feature does not work for guest or external accounts—you cannot @mention such accounts, nor can guest or external accounts @mention collaborators in Visio files outside of their tenant.
- Files containing @mentions can be opened in the Visio desktop app; however, any @mentions will appear as plain text. If a comment containing an @mention is edited, the @mention will be permanently converted to plain text.
Give us your feedback! Please tell us about your experience with @mentions in Visio for the web by leaving a comment below, sending feedback via the Visio Feedback portal, or submitting feedback directly in the Visio web app using “Give Feedback to Microsoft” in the bottom right corner. Follow us on Twitter and LinkedIn to stay informed with the latest updates for Visio.
Continue the conversation by joining us in the Microsoft 365 Tech Community! Whether you have product questions or just want to stay informed with the latest updates on new releases, tools, and blogs, Microsoft 365 Tech Community is your go-to resource to stay connected!
by Scott Muniz | Apr 7, 2022 | Security, Technology
This article is contributed. See the original author and article here.
VMware has released security updates to address vulnerabilities in multiple products. An attacker could exploit some of these vulnerabilities to take control of an affected system.
CISA encourages users and administrators to review VMware Security Advisory Advisories VMSA-2022-0011 and VMSA-2022-0012 and apply the necessary updates.

Recent Comments