This article is contributed. See the original author and article here.
Azure App Services currently provides two workflows for scaling: scale up and scale out.
Scale up: Get more CPU, memory, disk space, and extra features. You scale up by changing the pricing tier of the App Service plan that your app belongs to.
Scale out: Increase the number of VM instances that run your app. You can scale out to as many as 30 instances, depending on your pricing tier. App Service Environments in Isolated tier further increases your scale-out count to 100 instances. You can scale manually or automatically based on predefined rules and schedules.
These existing scaling workflows work well, but you may want to instead have the App Service platform automatically scale your web app without the hassle of defining auto-scaling rules & schedules.
We are introducing a new platform-managed automatic scaling feature in Azure App Services. Below is a list of key features provided by App Service’s built-in automatic scaling feature:
The App Service platform will automatically scale out the number of running instances of your application to keep up with the flow of incoming HTTP requests, and automatically scale in your application by reducing the number of running instances when incoming request traffic slows down.
Developers can define per web app scaling and control the minimum number of running instances per web app.
Developers can control the maximum number of instances that an underlying app service plan can scale out to. This ensures that connected resources like databases do not become a bottleneck once automatic scaling is triggered.
Enable or disable automatic scaling for existing app service plans, as well as apps within these plans.
Address cold start issues for your web apps with pre-warmed instances. These instances act as a buffer when scaling out your web apps.
Automatic scaling works with the existing Premium Pv2 and Pv3 SKUs.
Automatic scaling is billed on per second basis and uses the existing Pv2 and Pv3 billing meters.
Pre-warmed instances are also charged on per second basis using the existing Pv2 and Pv3 billing meters once it’s allocated for use by your web app [For additional details about pre-warmed instances refer to AZ Cli section below ]
Use Azure CLI or ARM templates to enable automatic scaling.
Suggested scenarios for automatic scaling:
You want your web app to scale automatically without setting up an auto-scale schedule or set of auto-scale rules based on various resource metrics.
You want your web apps within the same app service plan to scale differently and independently of each other.
A web app is connected to backend data sources like databases or legacy systems which may not be able to scale as fast as the web app. Automatic scaling allows you to set the maximum number of instances your app service plan can scale to. This helps avoid scenarios where a backend is a bottleneck to scaling and is overwhelmed by the web app.
Enable Automatic scaling using Azure CLI:
Step 1:
This step enables automatic scaling for your existing app service plan and web apps within this plan
az resource update -g <<resource group name>> -n <<app service plan name>> –set properties.ElasticScaleEnabled=1 –resource-type Microsoft.Web/serverfarms
az resource update -g sampleResourceGroup -n sampleAppServicePlan –set properties.ElasticScaleEnabled=1 –resource-type Microsoft.Web/serverfarms [This enables automatic scaling for the app service plan named “sampleAppServicePlan”]
*** In some scenarios while setting the value of ElasticScaleEnabled=1 for an existing app service plan for App service Linux you may receive an error message (“Operation returned an invalid status ‘Bad Request’”). In such scenarios follow below mentioned steps:
Execute above step using the — debug flag to return details about the error
az resource update -g <<resource group name>> -n <<app service plan name>> –set properties.ElasticScaleEnabled=1 –resource-type Microsoft.Web/serverfarms — debug (You can now view detailed error message which should be similar to “Message”:”Requested feature is not available in resource group <<Your Resource Group Name>>. Please try using a different resource group or create a new one.”)
You should now create a new resource group and an app service plan (It is recommended to use PV3 SKU for the new app service plan) and then set ElasticScaleEnabled=1
Step 2:
This step defines maximum number of instances that your app service plan can scale to
az resource update -g <<resource group name>> -n <<app service plan name>> — properties.maximumElasticWorkerCount=** –resource-type Microsoft.Web/serverfarms
az resource update -g sampleResourceGroup -n sampleAppServicePlan — properties.maximumElasticWorkerCount=10 –resource-type Microsoft.Web/serverfarms [This sets the max scale out limit of app service plan named “sampleAppServicePlan” to 10 instances]
*** Value of maximumElasticWorkerCount should be less than or equal to 30 (Maximum instances that a premium SKU app service plan can scale out)
*** Value of maximumElasticWorkerCount should be greater than or equal to current instance count (NumberOfWorkers) for your app service plan
Step 3:
This step enables minimum number of instances that your web app will always be available on (per app scaling)
az resource update -g <<resource group name>> -n <<web app name>>/config/web –set properties.minimumElasticInstanceCount=** –resource-type Microsoft.Web/sites
az resource update -g sampleResourceGroup -n sampleWebApp/config/web –set properties.minimumElasticInstanceCount=5 –resource-type Microsoft.Web/sites[This sets the minimum number of instances for the web app named “sampleWebApp” to 5. In this example Web app named “sampleWebApp” is deployed to app service plan named “sampleAppServicePlan “]
Step 4:
This step enables the number of pre-warmed instances readily available for your web app to scale (buffer instances).
*** Default value of “preWarmedInstanceCount” is set as 1 and for most scenarios this value should remain as 1
az resource update -g <<resource group name>> -n <<web app name>>/config/web –set properties.preWarmedInstanceCount=** –resource-type Microsoft.Web/sites
az resource update -g sampleResourceGroup -n sampleWebApp/config/web –set properties.preWarmedInstanceCount=2 –resource-type Microsoft.Web/sites[This sets the number of buffer instances available for automatic scaling for the web app named “sampleWebApp” to 2]
*** Assuming that your web app has five always ready instances (minimumElasticInstanceCount=5) and the default of one pre-warmed instance. When your web app is idle and no HTTP requests are received, the app is provisioned and running with five instances. At this time, you aren’t billed for a pre-warmed instance as the always-ready instances aren’t used, and no pre-warmed instance is allocated. Once your web app starts receiving HTTP Requests and the five always-ready instances become active, and a pre-warmed instance is allocated and the billing for it starts. If the rate of HTTP Requests received by your web app continues to increase, the five active instances are eventually used and when App services decides to scale beyond five instances, it scales into the pre-warmed instance. When that happens, there are now six active instances, and a seventh instance is instantly provisioned and fill the pre-warmed buffer. This sequence of scaling and pre-warming continues until the maximum instance count for the app is reached. No instances are pre-warmed or activated beyond the maximum.
Step 5:
This step disables automatic scaling for your existing app service plan and web apps within this plan
az resource update -g <<resource group name>> -n <<app service plan name>> –set properties.ElasticScaleEnabled=0 –resource-type Microsoft.Web/serverfarms
az resource update -g sampleResourceGroup -n sampleAppServicePlan –set properties.ElasticScaleEnabled=0 –resource-type Microsoft.Web/serverfarms [This disables automatic scaling for the app service plan named “sampleAppServicePlan”]
FAQ:
The App Service automatic scaling feature is currently in early preview.
Automatic scaling is currently supported for Azure App Service for Windows and Linux.(App service for Windows containers and App Service Environments do not support automatic scaling)
Automatic scaling can be configured via Azure CLI and ARM templates only. Azure Portal (UX) support for this feature will be enabled in a future release.
Automatic scaling is available only for Azure App Services Premium Pv2 and Pv3 SKUs
App Service’s automatic scaling feature is different than Azure Autoscale. Automatic scaling is a new built-in feature of the App Service platform that automatically handles web app scaling decisions for you. Azure Autoscale is a pre-existing Azure feature for defining schedule-based and resource-based scaling rules for your app service plans. for your app service plans.
Once automatic scaling is configured, existing Azure Autoscale rules and schedules (if any) will not be honored. Applications can use either automatic scaling, or Azure Autoscale, but not both. If you disable automatic scaling for your app service plan by setting ElasticScaleEnabled=0; existing Autoscale rules if any, will be applicable once again
Health check should not be enabled on web apps with this automatic scaling feature turned on. Due to the rapid scaling provided by this feature, the health check requests can cause unnecessary fluctuations in HTTP traffic. Automatic scaling has its own internal health probes that are used to make informed scaling decisions.
You can only have Azure App Service web apps in the app service plan where you wish to enable automatic scaling. If you have existing Azure Functions apps in the same app service plan, or if you create new Azure Functions apps, then automatic scaling will be disabled. For Functions it is advised to use the Azure Functions Premium plan instead.
This article is contributed. See the original author and article here.
Azure Virtual Machine Scale Sets lets you create and manage a group of virtual machines to run your app or workload and provides sophisticated load-balancing, management, and automation. This is a critical service for creating and dynamically managing thousands of VMs in your environment. If you are new to the service this show will get you up to speed or if you haven’t looked at VM Scale Sets in a while we’ll show you how the service has significantly evolved to help you efficiently architect your apps for centralized configuration, high availability, auto-scaling and performance, cost optimization, security, and more.
We are Microsoft’s official video series for IT. You can watch and share valuable content and demos of current and upcoming tech from the people who build it at Microsoft.
-Welcome to Azure Essentials. I’m Matt McSpirit, and in the next few minutes, I’ll give you an overview of Azure virtual machine scale sets, a critical service for creating and dynamically managing thousands of VMs in your environment. Now if you are new to the service this will get you up to speed, or if you haven’t looked at VM scale sets in a while we’ll show you how it has significantly evolved to help you efficiently architect your apps for centralized configuration, high availability, auto-scaling and performance, cost optimization, security, and more.
-So, let’s start by addressing what is a Virtual Machine Scale Set in Azure? Well as the name implies, this Azure service lets you create and manage a group of virtual machines to run your app or workload and provides sophisticated load-balancing, management, and automation. VM Scale Sets lays the foundation for centralized and consistent configuration of VMs in your environment. One of the primary functions is to specify a VM template with the characteristics that you need for your apps and workloads to run reliably. This includes: the VM image, with support for Windows and Linux platform images as well as your own custom images, the VM size, your networking parameters, the number of VM instances in the group, and with virtual machine extensions you can also add post-deployment configuration like monitoring, anti-malware and automation.
-As you set them up, there are two management modes to deploy your scale sets: Uniform Orchestration, which is optimized for large stateless workloads where your VM instances are identical. Or the newer Flexible orchestration mode, which adds more options: from running workloads with different VM types; or changing your VM sizes without redeploying your scale set; to architecting your scale sets for high availability. And the good news is, they are all easy to set up. You can define your Virtual Machine Scale Set in the Azure Portal as you just saw or with an Azure Resource Manager Template. Of course, if you prefer you can use scripting tools like Azure CLI, PowerShell, and even infrastructure as code tools like Terraform.
-Once set up, any new VM added to the scale set will inherit the configurations that you have defined. And it’s easy to make changes across your scale set. For example, with image-based upgrades, when a new version of a custom or marketplace image is made available, Virtual Machine Scale Sets will detect that and start upgrading the VM instances in batches, and you can use protection policies to exclude VMs that you don’t want to upgrade. Or another example of what you can do is to upgrade your existing VMs in one-go to take advantage of the latest and greatest VMs in Azure.
-That said, beyond consistent configurations, scale sets are used to distribute your business-critical application across multiple instances to provide high availability. And this is achieved in a number of ways. For example, you can automatically distribute up to 1,000 VM instances between availability zones in minutes. This gives you utmost availability, up to 99.99%, and helps you to mitigate any possible datacenter wide issues. Availability zones are offered in most geographies and represent physically separate locations in an Azure region composed of one or more datacenters with independent power, cooling, and networking. VMs can be automatically spread across fault domains in a region, or you can specify a fault domain as part of your VM deployment, which makes it easier to replace VMs. Now this is especially relevant for open-source databases like Cassandra or other quorum-based applications.
-Of course, you also have the option to replicate your VM instances to another Azure region for failover compute. And for storage redundancy, you can also back up data disks using Azure Backup. Beyond hardware failure resilience measures, to get ahead of issues before they impact your operations, you can install the application health extension on each VM instance, so that your app or workload can report application-specific health metrics to Azure. And once you enable automatic instance repair, Azure will automatically remove and replace instances in an unhealthy state, to maintain high availability.
-As you architect for availability with Azure VM Scale Sets you can of course also scale your applications on demand while increasing performance. Scale sets integrate with Azure load balancer for basic layer-four traffic distribution and Azure Application Gateway for more advanced layer-seven traffic distribution. This helps you to easily spread your incoming network traffic across the VMs in your scale sets. Which in turn helps you build scalable solutions while maintaining high levels of performance.
-You can also configure your VM scale set to auto-scale. For example, if you’re running an e-commerce site you may need to scale your front end in response to some event, like a holiday sales spike. Azure will automatically add and subtract VM instances in response to demand so that there is no decline in your app or workload experience. Under scaling, you can use metric-based auto-scaling rules and define thresholds that trigger an increase in VM instances to scale out. And likewise, you can set similar thresholds for when to scale in, taking into account a specified cool down period which allows for a buffer of time before the scale in action is triggered.
-And of course, you can manually scale out and in as you need to. The ability to dynamically scale your VM pool also brings numerous efficiencies as you run your workloads on Azure, because instead of pre-provisioning VMs you’re only paying for the compute resources your application needs. And for even more savings, for your interruptible workloads, you also have the flexibility of using Azure Spot VMs that take advantage of spare compute capacity in Azure as and when it’s available.
– You can also mix and match Azure Spot VMs with regular on-demand VMs. And if you’re worried about Spot VM evictions, the try to restore feature in Azure Virtual Machine Scale Sets, will automatically try to restore an evicted Spot VM and maintain the target VM instance count in your scale set. In fact, we covered Spot VMs as part of your cost optimization strategy, in our last Essentials overview which you can watch at aka.ms/EssentialsSpotVMs.
-Next, Virtual Machine Scale Sets help you improve the security posture of your applications by keeping them up-to-date. Upgrades can be performed automatically, in random order, manually, or using rolling upgrades in defined batches. In addition to image upgrades, you can also do automatic VM guest patching for critical and security updates, and this helps to ease management by safely and automatically patching virtual machines to maintain security compliance. Patch orchestration is managed by Azure and updates are rolled out sequentially across VMs in the scale set to avoid application downtime. You can also force updates on-demand. And with Automatic Extension Upgrades, critical updates are applied as they become available from publishers.
-So that was a quick overview of Azure Virtual Machine Scale Sets and how they can help you to create and deploy thousands of VMs in minutes. The metrics and template-based approach helps you to consistently architect your apps and workloads for auto-scaling, availability, and performance, giving you the control that you need. This lets you focus on your app instead of the complexities of managing your infrastructure. And to learn more visit aka.ms/VMSSOverview and keep watching Microsoft Mechanics for more in the series, bye for now!
This article is contributed. See the original author and article here.
Azure Purview lets you govern Azure SQL Databases at scale, and with ease. The following details how to register and scan your Azure SQL Database, along with how to extract lineage to view and analyze how data is being transformed. It also describes how to discover assets easily by grouping Azure SQL Database schemas and tables into Purview collections.
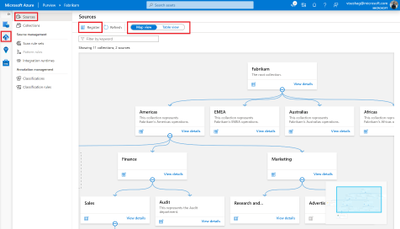
Register and scan Navigate to your Purview account and click on the Data Map section to the left. You can view your data estate map and choose to view your sources in table format as well.
Purview now supports 20-plus source types, ranging from Azure SQL Database, to AWS S3, to Oracle Database. Sources can be registered in two ways: by either clicking on the register button on the top left or by navigating to the collection that you’d like to register the source to and clicking on the Register quick action icon. Then click on the Azure SQL Database source tile and fill in the required details.
As part of the required details, register your source to a collection of interest. In our example, we register the source to the Finance collection.
Once your source is registered, the next step is to set up a scan. While setting up your scan, fill in details for the integration runtime, database name, and credential. You can also set up your scan with a collection; in our example, it’s the Audit collection under Finance. So you can now scope your scan to only the Audit tables to ensure all assets are scanned into the catalog with the right collection associated for discovery and access control.
See results of the scan by clicking on View details for your source.
Lineage extraction (preview) While setting up your scan, you can now extract lineage from stored procedures and other artifacts in your Azure SQL Database source.
Learn more on how to get onboarded to the Preview program here.
Discover—search and browse for your Azure SQL Database tables Once a scan completes, you can discover assets either via search or browse. To search, enter keywords in the search bar on the top of the Purview studio and narrow down results by the facet filters Purview provides.
To browse, click on the browse assets tile on the catalog home page, navigate to the By collection tab and navigate to the collection that you scanned assets into. In our example, it would be Audit. If you have access to this collection, click on it to browse for your assets.
Add business metadata to your Azure SQL database assets You can also navigate to one of your Azure SQL tables and view details. To aid in discoverability and compliance, add descriptions and business glossary terms by clicking on the Edit button.
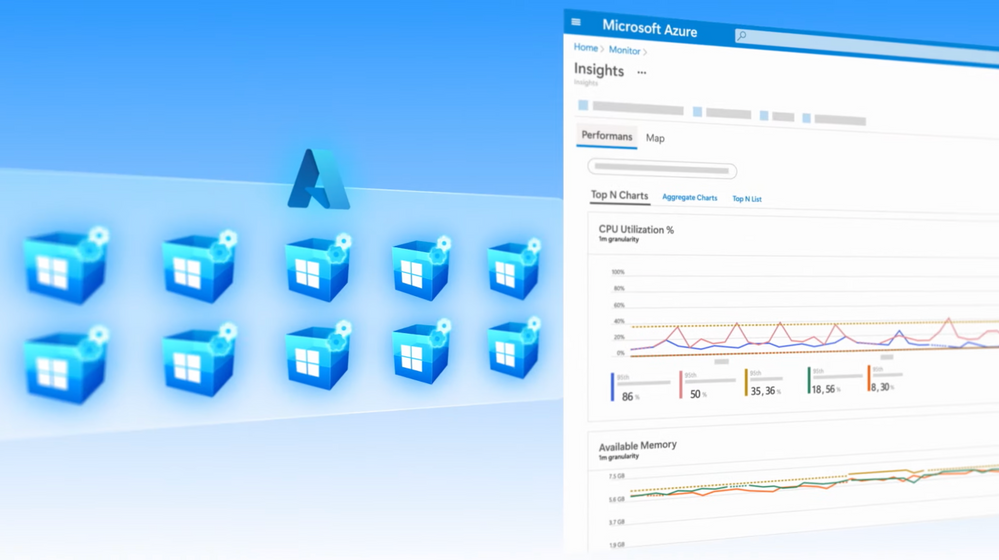
Insights (preview) Finally, view all your Azure SQL Database-related insights around assets, scans, glossary, classification, and labels by navigating to the Insights section of Purview.
Get started today!
Quickly and easily create an Azure Purview account to try the generally available features.
Read documentation on how to register and scan an Azure SQL Database in Azure Purview.
This article is contributed. See the original author and article here.
Mark a device non-compliant after 7 days of inactivity in the Microsoft Defender for Endpoint mobile app.
To be protected, customers must be confident that their end users’ devices are compliant with security policies. Today, end users are often able to bypass protections that are set by their organization. For example, users uninstall, disable settings/permissions, and force stop or clear storage of their Defender for Endpoint mobile app. Removing or disabling the Defender for Endpoint app can leave a mobile device more vulnerable to an attack.
We are excited to announce the public preview of tamper protection for mobile devices. This new feature helps ensure the retention of the Defender for Endpoint mobile app on users’ devices and helps protect devices persistently. This feature detects devices that are out of protection for over 7 days, due to tampering with the Defender for Endpoint mobile app. These devices are marked non-compliant in Microsoft Intune (part of Microsoft Endpoint Manager).
Organizations can also set up Conditional Access policies to enforce the activation and use of the Defender for Endpoint mobile app. With these Conditional Access policies in place, users can access corporate resources only if their devices are in a compliant state. Blocked users can regain access only after the Defender for Endpoint mobile app is set up with all required permissions and the app is actively sending signals to Defender for Endpoint.
For this initial release we have scoped the detection of devices out of protection for 7 days. In upcoming releases, we plan to make this duration configurable by your security admin or your tenant admin.
How to get and configure this feature
Share your Organization Tenant name and Tenant ID with Microsoft at atpm@microsoft.com, to be added to the public preview of this feature.
Set up a Device compliance policy that requires Defender for Endpoint to be at or under the following machine risk score: Low (Your risk score can be set per your organization’s requirements)
Set up a Conditional Access policy to block access to corporate resources on devices that are non-compliant with your device compliance policy.
Try tamper protection for mobile devices out and let us know how it goes! We’re excited to share these new updates with you and continue to build on security capabilities across platforms.
This article is contributed. See the original author and article here.
In the previous part of this blog series- Microsoft 365 Compliance audit log activities via O365 Management API – Part 1, we discussed the importance of auditing and reporting for an organization’s security and compliance posture. We also discussed Microsoft auditing solutions, auditing architecture (and its components), as well as Microsoft Information Protection audit log schema
DLP-Activities Audit Log Schema
Let’s try to go over some of the audit log schema parameters for email and file events to make it clearer. Please note that the below is a cut-down list of the schema as most of the schema parameters are self-explanatory. For a full and updated list of DLP log schema, please visit Microsoft official documentation here, however, we will highlight a few schema parameters that we believe are important to explain what they mean and how can we use them. Below is an example of a DLP audit log:
For a complete updated list and full description of the Log RecordType, please refer to this article. Here we are only listing the relevant DLP Record types.
Operation
The operation type for the audit log (Referenced here as discussed above)
DlpRuleMatch
DlpRuleUndo
DlpInfo
DlpRuleMatch – This indicates a DLP rule was matched. These events exist in both Exchange and SharePoint Online and OneDrive for Business.
For Exchange it includes false positive and override information.
For SharePoint Online and OneDrive for Business, false positive and overrides generate separate events.
DlpRuleUndo – These only exist in SharePoint Online and OneDrive for Business. These events indicate a previously applied policy action has been “undone” – either because of false positive/override designation by user, or because the document is no longer subject to policy (either due to policy change or change to content in doc).
DlpInfo – These only exist in SharePoint Online and OneDrive for Business. These events indicate a false positive designation but no action was “undone.”
IncidentId
The DLP incident unique ID
String of text
DLP-Specific Extended Schema
PolicyId
The GUID of the DLP policy for this event
DLP Policy GUID
PolicyName
The friendly name of the DLP policy for this event
DLP Policy name (string)
RuleId
The GUID of the DLP rule for this event.
DLP Rule GUID
RuleName
The friendly name of the DLP rule for this event
DLP Rule name (string)
Actions
A list of actions taken because of a DLP RuleMatch event.
Examples only:
ExSetHeader
ExModifySubject
ApplyContentMarking
Encrypt
BlockAccess
NotifyUser
The DLP policy actions depend on many variables, such as, workload in scope (EXO, SPO, etc.) and conditions selected. Here we listed a few DLP policy action examples for the purpose of the article.
Severity
The severity of the rule match.
Low
Medium
High
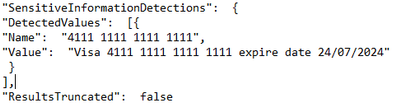
DLP-Specific Extended SENSITIVE Schema (the SensitiveInformationDetections section of the log)
DetectedValues
An array of sensitive information that was detected.
Name
Value
DLP sensitive data is only available in the activity feed API to users that have been granted “Read DLP sensitive data” permissions.
Example from our tenant API (Teams DLP event):
ResultsTruncated
Indicates if the logs were truncated due to large number of results.
True
False
DLP sensitive data is only available in the activity feed API to users that have been granted “Read DLP sensitive data” permissions.
See example above
DLP-Specific Extended SENSITIVE Schema (the ExceptionInfo section of the log)
Reason
For a DLPRuleUndo event, which indicates why the rule no longer applies.
Override
Document Change
Policy Change
DLP sensitive data is only available in the activity feed API to users that have been granted “Read DLP sensitive data” permissions.
Example from our tenant API (Teams DLP event):
Justification
If the user chose to override policy, any user-specified justification is captured here.
String of text
DLP sensitive data is only available in the activity feed API to users that have been granted “Read DLP sensitive data” permissions.
See example above
Rules
A collection of GUIDs for each rule that was designated as a false positive or override, or for which an action was undone.
DLP Rule GUID(s)
DLP sensitive data is only available in the activity feed API to users that have been granted “Read DLP sensitive data” permissions.
See example above
MIP/DLP in Office 365 Management API
So before knowing how to retrieve MIP and DLP logs via Office 365 Management API queries, we need to know first, where to look for them.
Below is a summary of each of the Office 365 Management API content blobs and what operations they contain. Please use this as a reference whenever you are performing a log search for a specific activity event for MIP and/or DLP.
Content Blob
Operation
Notes
Audit.AzureActiveDirectory
UserLoggedIn
Very useful in general for any investigation or reporting purposes.
Audit.Exchange
MIPLabel
DLPRuleMatch
AutoSensitivityLabelRuleMatch
Audit.SharePoint
DLPRuleMatch
DLPRuleUndo
DlpInfo
FileSensitivityLabelChanged
FileSensitivityLabelChanged is applicable to a document using:
Office on the Web
Audit.General
SensitivityLabelApplied
SensitivityLabelUpdated
SensitivityLabelChanged
SensitivityLabelRemoved
SensitivityLabeledFileOpened
SensitivityLabeledFileApplied
SensitivityLabeledFileRenamed
SensitivityLabeledFileRemoved
FileSensitivityLabelChanged
AutoSensitivityLabelRuleMatch
DLPRuleMatch
DLPRuleUndo
DlpInfo
SensitivityLabelApplied, SensitivityLabelChanged, SensitivityLabelRemoved are applicable to:
SPO/Teams sites
Emails and files activities from Microsoft 365 Apps Only
SensitivityLabelUpdated is applicable to a document using:
Microsoft 365 Apps.
SensitivityLabeledFileChanged is applicable to a document using:
Office on the Web
Auto-labelling policy.
SensitivityLabeledFileRemoved is applicable to a document using:
SensitivityLabeledFileOpened is applicable to a document using:
Microsoft 365 Apps
DLP.All
DLPRuleMatch
DLPRuleUndo
DlpInfo
MIPLabel
DLP events may include sensitive data (if configured)
Querying Management API
In this section, we will go over the configuration details in depth to prepare the environment before performing any API queries. As well as the “Compliance API” script that we have created to help querying and exporting the Microsoft 365 audit log activities via Office 365 management API.
Register your application in Azure AD
In order to be able to query the Office 365 Management API endpoints, you will need to configure your application with the right permissions. For a step-by-step guide, please visit the Microsoft official documentation here for more details.
Compliance-API Script
We have created a sample Office Management API script that enables administrators to access their tenant management API service (given all the prerequisites steps above have been completed). The script uses a few variables that you will need to update to be able to use it in your tenant (explained below). Also, the script mainly uses the “Get” function to export the log activities to a bunch of JSON files from the main 5 content blobs that we need. Now, let’s go through the script.
Script facts
We highly recommend using this script and testing it first in your testing environment. If you need to use it in your production environment, consider removing the hard-coded variables (as shown below) from the script. It is highly NOT RECOMMENDED to keep any passwords, secrets, etc. within files or scripts on endpoints. You may consider using secure string or Azure Key Vault with Azure functions/variables.
The script exports the log data to JSON files, due to the extensive information and attributes for each log event. The aim was to export all the Microsoft 365 audit logs so that they suit everyone’s needs (not only for MIP and DLP). For example, if there are MIG, eDiscovery, or Communication Compliance audit logs, these will be exported too. Further customization can be done to the script if needed to narrow the export scope, by applying export filters (i.e., Operation -eq, etc.). So, it is up to you to use it the way that works best for you.
The script checks content availability (i.e., notifications) that became available today, which means from 12:00 AM UTC to the current time. If you want to specify a different period (keeping in mind that the maximum period for which you can query is 24 hours), you can add the starttime and endtime parameters in the script to the URI in the last 24 hours from the time runs. Like the below (don’t forget to define the starttime and endtime parameters):
Invoke-WebRequest -Method GET -Headers $OfficeToken -Uri "$BaseURI/content?contentType=$Subscription&startTime=$Date022T00:00&endTime=$Date022T23:59&PublisherIdentifier=$TenantGUID" ErrorAction Stop
Script variables
The script defined variables are depicted below, you will need to update the following:
•$AppClientID = " The Azure AD registered application ID "
•$ClientSecretValue = " The application secret Value"
•$TenantGUID = " Tenant ID – you can get it from Azure AD portal"
•$tenantdomain = " Tenantname.onmicrosoft.com"
•$OutputPath = "Logs folder path – i.e., C:APILogs"
•$APIResource = Endpoint URI ($Enterprise, $GCC, $GCCH, $DOD)
MIP/DLP PowerBI (PBI) Reports
So now we have the MIP/DLP logs exported via the Office 365 management API to JSON files, what can we do with them?. We can use those JSON files in various ways, such as:
Import them to your 3rd party SIEM solution for reporting and analysis.
Use 3rd JSON reading tools to export/convert to other formats for further analysis.
Use PowerBI to create reports based on the data in those files.
Here we will show you an example on how to use PowerBI Desktop tool to create MIP/DLP audit report. We have selected to create a report for DLP policy incidents in the last 24 hours within our tenant
Configuration steps
Download the PowerBI Desktop client from here then install it on your machine. Run the client once the install is complete.
Once the client is running, click on File, then Get Data, then click on Get data to get started
In the Get Data page, select JSON from the list, then click Connect
Select the JSON file(s) that you would like to create a report for, then click Open
The Power Query editor page will open. Here you can modify the JSON file results’ view and data. You can rename column headers, remove columns/rows, and expand an array data into values to name a few. For our report, this is what we have decided to do:
We have filtered the “operation” column to just show “DLPRuleMatch” and “DLPRuleUndo” operations
We have expanded all the “list” items to their original headers and values. The “list” items are the data into the complex (i.e., array) part within the audit log. Then we will select to show only the “PolicyName” and “Rules” headers.
We will also expand the “Rules” data and show the ones selected below
Then click on the close and apply to exit the query editor.
Report examples
From the visualizations section, select the visualization that you would like to use, then drag and dropfields that you would like to create a report for. Below is what we have chosen to configure for our DLP incidents reporting:
A simple report to report on DLP incidents in the last 24 hours, per workload, per DLP policy:
This report shows the number of DLP incidents, per user, per workload, per DLP policy:
The last one has more details. This shows the DLP incident severity, per DLP Policy, per user, with visual count on bars, per workload (in the tooltip):


Recent Comments