Best Practices and sizing details for Hiveserver2 Interactive and LLAP daemons
This article is contributed. See the original author and article here.
Introduction:
This document provides information about overall working of LLAP daemons and performance considerations. In general, performance tuning is an ongoing act and there is no silver bullet to solve all your performance issues. Performance improvements should be done in two stages, performance analysis and performance tuning. In the performance analysis step, goal is to find the bottlenecks and areas to focus; and the second step is do incremental tuning for the bottlenecks identified.
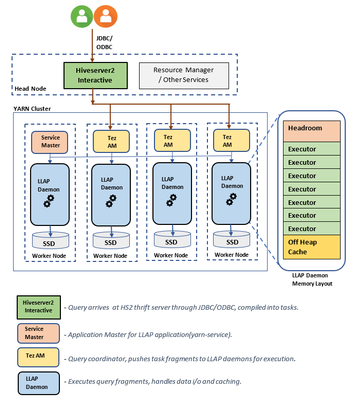
LLAP Architecture/Components:
LLAP execution and sizing configurations:
The following are some of the configurations that can be adjusted based on your workload for improved performance. Please refer to Azure HDInsight LLAP sizing guide for detailed information here.
- Use dedicated YARN queue for LLAP daemons, this ensures the priority scheduling and resource management for other applications.
Total Memory available for LLAP queue per worker node can be calculated as follows:
This value depends on the total amount of memory available for all YARN containers on a node(yarn.nodemanager.resource.memory-mb) and the percentage of capacity configured for llap queue (yarn.scheduler.capacity.root.llap.capacity).
Total memory for LLAP queue on worker node = Total memory available for all YARN containers on a node x Percentage of capacity for llap queue.
Please note: If your workload is read-only operations, then setting it as high as 90% of the capacity should work. However, if your workload is mix of update/delete/merge operations using managed tables, it’s recommended to give 85% of the capacity for llap queue. The remaining 15% capacity can be used by other tasks such as compaction etc. to allocate containers from the default queue. That way tasks in the default queue won’t deprive YARN of resources.
For E32 v3 worker, this value is (200 GB x 0.85) = 170 GB.
- Configure number of concurrent queries same to the for the peak usage scenario to avoid manual intervention because Autoscale events don’t change the Hive configuration Maximum Total Concurrent Queries in Ambari. This means that the Hive Server 2 Interactive Service can handle only the given number of concurrent queries at any point of time even if the Interactive Query daemons count are scaled up and down based on load and schedule.
Note (Limitation wrt AutoScaling):
In case of autoscale-enabled Interactive Query clusters, an autoscale up/down event also scales up/down the number of Interactive Query daemons to the number of active worker nodes. The change in the number of daemons is not persisted in the num_llap_nodes configuration in Ambari. If Hive services are restarted manually, the number of Interactive Query daemons is reset as per the configuration in Ambari.
If the Interactive Query service is manually restarted, you need to manually change the num_llap_node configuration (the number of node(s) needed to run the Hive Interactive Query daemon) under Advanced hive-interactive-env to match the current active worker node count.
- Configure yarn.scheduler.maximum-allocation-vcores.
This value indicates the maximum number of virtual CPU cores for every container request at the Resource Manager. Requesting a higher number of vcores than this value won’t take effect. It’s a global property of the YARN scheduler. For LLAP daemon container, this value can be set to 75% of total available vcores. The remaining 25% should be reserved for Node Manager, Data Node, and other services running on the worker nodes.
For E32 v3 VMs and 75% of total 32 vcores can be used by LLAP daemon container, the recommended value is 24.
- Configure LLAP daemon size:
LLAP daemon container size = (Total memory for LLAP queue on a workernode) – (Tez AM memory per node) – (Service Master container size)
There is only one Service Master (Application Master for LLAP service) on the cluster spawned on one of the worker nodes. For calculation purpose, we consider one service master per worker node.
For E32 v3 worker node, HDI 4.0 - the recommended value is (170 GB - 4 GB - 1 GB)) = 165 GB
- Number of executors per LLAP daemon:
This value depends on the number of vcores, the amount of memory used per executor, and the amount of total memory available for LLAP daemon container. The number of executors can be oversubscribed to 120% of available vcores per worker node.
For E32 v3, the recommended value for num of executors is (32 vcores x 120%) ~= 38 on each worker node considering 3GB per executor.
- Configure hive.llap.io.threadpool.size to value same as number of executors.
Recommendation is to monitor heap usage at peak workloads and increase the number of executors making sure that Number of executors times heap usage per executor does not exceed total llap daemon heap size.
For example, let’s assume that the LLAP daemon is configured for 20 executors and 80 GB of heap size, but your max heap space usage is 60GB. Then the average use per executor is 3 GB (60 GB divided by 20 executors). In such cases, your configured heap is underutilized, and you still have a 20GB room (80 GB – 60 GB). You can increase number of executors by 6 (20 GB/3GB ~= 6) from 20 to 26. This provides increased task parallelism and may result into higher throughput.
A thumb rule would be, for each LLAP daemon,
(Number of executors x Heap size per executor (Tez container size)) <= (total heap size for LLAP daemon)
You can get the information for heap space usage and executor’s usage from Grafana dashboards for each individual daemon as well as the average for all daemons. Pick the max value for calculations.
Increasing number of executors beyond the above-mentioned thumb rule may provide you better performance at a times but can also result into occasional failures and instability. Please refer to HDInsight Hive/LLAP sizing guide for details.
- Configuration: hive.llap.daemon.yarn.container.mb:
LLAP daemon runs as a YARN container on each worker node. The total memory size for the LLAP daemon container depends on the following factors. LLAP daemon container memory consists of the following components :
- Head room
- Heap memory used by executors (Xmx)
- In-memory cache per daemon (its off-heap memory size, not applicable when SSD cache is enabled)
- In-memory cache metadata size (applicable only when SSD cache is enabled)
Headroom size: This size indicates a portion of off-heap memory used for Java VM overhead (metaspace, threads stack, GC, data structures, etc.). Generally, this overhead is about 6% of the heap size (Xmx). To be on the safer side, this value can be calculated as 6% of total LLAP daemon memory size.
For E32 v3, the recommended value is ceil(170 GB x 0.06) ~= 10 GB.
Heap size(Xmx:( It is amount of heap memory available for all executors. Total Heap size = Number of executors x 3 GB
For E32 v3, this value is 38 x 3 GB = 114 GB
LLAP cache size: LLAP supports both in-memory (RAM) and SSD cache. The cache size calculation would differ when SSD cache is enabled. Setting hive.llap.io.allocator.mmap = true will enable SSD caching. When SSD cache is enabled, some portion of the RAM memory will be used to store the metadata (headers, index, etc) for the cached data on SSD. The metadata is expected to be approximately 8% of SSD cache size and it is stored in off-heap memory.
SSD Cache in-memory metadata size = LLAP daemon container size – (Head room + Heap size)
For E32 v3, with HDI 4.0, SSD cache in-memory metadata size = 170 GB - (4 GB + 114 GB) = 52 GB
When SSD cache is disabled, the in-memory cache is amount of memory that is left after taking out Headroom size and Heap size from the LLAP daemon container size.
In-memory(off-heap) cache size = LLAP daemon container size – (Head room + Heap size)
Recommendation is to monitor the LLAP cache uses by checking Grafana dashboards or running sample workload queries via beeline and checking execution summary. LLAP is optimized for interactive queries, if you are running ETL workloads that refer to data only once would not benefit from caching. In such cases, you can disable caching by setting “hive.llap.io.enabled=false” at session level.
- Adjusting Map Join memory:
This configuration determines the threshold for MapJoin selection by Hive optimizer that considers over subscription of memory from other executors to have more room for in-memory hash tables to allow more map join conversions. Considering 3 GB per executor, this size can be oversubscribed to 3 GB, but some heap memory may also be used for sort buffers, shuffle buffers, etc. by the other operations.
For E32 v3, with 3 GB memory per executor, it's recommended to set this value to 2048 MB.
- The values for num_llap_nodes, num_llap_nodes_for_llap_daemons are recommended to be set as same as the number of LLAP worker nodes.
- Depending the volume of data being queried and result, tune tez.grouping.max.size and tez.grouping.min.size. Decrease for better latency or Increase for more throughput.
Data Storage Format:
Data storage format plays a critical role in Hive/LLAP performance.
- It is recommended to use ORC data storage format for taking advantage of efficient compression, fast reads. ORC gives the best performance overall.
- Avoid using Text-based storage formats for large production systems. If you have data generated in Text formats (CSV, JSON, etc.) , you can create a Hive external hive table, and then convert it to ORC format for regular querying and analysis. (For example: CREATE TABLE orc_table STORED AS ORC AS SELECT * FROM text_table)
Both ORC and Parquet provide a highly efficient way to store Hive data in a columnar format. LLAP implementation natively supports ORC and Parquet where LLAP does not have to perform additional encoding/decoding steps. Also, it supports efficient vectorized operations on the data stored in these formats.
Hive/LLAP optimizer and execution engine can make use of metadata/indexes that are stored alongside data in ORC or Parquet format. Some of the queries can directly be served from metadata/indexes without requiring scanning through the whole data.
In the case of text formats (CSV, JSON, etc.), LLAP would require additional steps to encode/decode data before it is stored in the cache and used in vectorized operations. This overhead may contribute to delays in processing the data.
Depending on your environment, you can further tune your ORC storage formats to optimize Hive/LLAP performance by using bloom filters, configuring compression type, stripe size, using partitions, and buckets.
Hiveserver2 Interactive High Availability
Hiveserver2 Interactive (HSI) supports high availability (HA) in the form of an Active/Passive standby configuration. Only one HSI can be in Active mode, whilst one or more additional HSI instances are in passive standby mode and ready to takeover on Active HSI failure.
To connect to the active leader HSI instance, clients use dynamic service discovery. For example:
jdbc:hive2://<zookeeper_quorum>;serviceDiscoveryMode=zooKeeperHA;zooKeeperNamespace=hiveserver2-interactive
It is important to note that zooKeeperHA service discovery mode is distinct from zooKeeper discovery mode used with traditional Hiveserver2.
With zooKeeperHA, the Hive connection will iterate through the list of HSI instances registered in ZooKeeper and identify the elected leader. The node information (hostname:port) for the leader is returned to the client, allowing it to connect to the Active HSI instance.
If the Active HSI loses its leadership (for example, a long GC pause resulting in session/connection timeout or network split) leadership is revoked.
Before implementing HSI HA you should confirm that all JDBC and ODBC drivers used within your organization include support for zooKeeperHA service discovery.
LLAP Resource Monitoring and Recommendations
- Hive Interactive UI:
Currently, Hive Interactive UI does not work for ESP LLAP clusters. The following workaround can be applied to make it work.
Step-1: Add the below configs in Ambari:
hive.server2.webui.use.spnego -> true
hive.server2.webui.spnego.principal -> HTTP/_HOST@domain.com e.g. HTTP/_HOST@SECUREHADOOPRC.ONMICROSOFT.COM for tip clusters
hive.server2.webui.spnego.keytab ->/etc/security/keytabs/spnego.service.keytab
Custom hive-site:
hive.users.in.admin.role -> Comma Separated list of users who can access UI e.g. rsadmin2 (for tip clusters) or * if we want all users to be able to access.
Step – 2: Restart Hive
All the pages work except for /logs in HS2UI - need to backport [HIVE-14737] Problem accessing /logs in a Kerberized Hive Server 2 Web UI – ASF JIRA (apache.org)
Sample Curl command to access these pages programmatically:
curl –negotiate -u : http://hn0-kevx5t.securehadooprc.onmicrosoft.com:10502/jmx
The following table details the available UI pages and useful endpoints for metric scraping etc.
http://<host>:15002 | Active sessions, open queries, and last 25 closed queries overview |
http://<host>:15002/jmx | Hiveserver2 system metrics |
http://<host>:15002/conf | Current Hiveserver2 configuration |
http://<host>:15002/peers | Overview of Hiveserver2 Interactive instances in the cluster |
http://<host>:15002/stacks | Show a stack trace of all JVM threads |
http://<host>:15002/llap.html | Status of the LLAP daemons |
Text | http://<host>:15002/conflog |
- LLAP Monitor
Each LLAP daemon has a Monitor that listens on port 15002 by default. You can use the LLAP status command or the LLAP Daemons tab on the Hiveserver2 Interactive Web UI to quickly determine where the LLAP daemons are running.
- LLAP IO Counters
Set hive.tez.exec.print.summary to true in order to report data and metadata cache hits and misses for each query you run.
- Grafana Dashboards
LLAP Executor metrics and LLAP Cache metrics Dashboard:

Make sure your execution slots are available to run the query fragments. Also, check Evicted, Killed and Rejected task requests. If more than 90% of your execution slots are occupied, then system you may have to scale-out your LLAP cluster to be able to handle increased workload.
- Sampling of workload
Run sample queries (especially long running) from your workload and find out how many resources they consume for a better understanding of the overall workload. Also, accommodate for any future additional workload.
Using beeline, you can set the following at session level and run your queries.
set hive.tez.exec.print.summary=true;
set hive.query.results.cache.enabled=false;
- Analyze query execution summary
Find out time consumed in different stages of query processing.

- Analyze LLAP Cache usage:
Usually, higher the DATA_HIT number better the performance as data can be directly read from the cache and no additional IO is required.

- Analyze LLAP Tasks execution pattern
With an active workload management plan, you will have to run your sample queries with actual user, group or app name based on your query pool mapping in your resource plan.
More time spent in SPECULATIVE_RUNNING and SPECULATIVE_QUEUED would mean that the query pool corresponding to the query needs more resource in the pool and it is using resources from the other query pools when possible. However, these speculative tasks will get evicted when other query pools need resources to serve its queries.

References:
https://docs.microsoft.com/en-us/azure/hdinsight/interactive-query/hive-llap-sizing-guide
https://docs.microsoft.com/en-us/azure/cloud-services/cloud-services-sizes-specs#dv2-series

![Left to right [The Intrazone co-hosts]: Chris McNulty, director (SharePoint/Viva – Microsoft) and Mark Kashman, senior product manager (SharePoint – Microsoft).](https://www.drware.com/wp-content/uploads/2021/04/fb_image-89.jpeg "Chris-Mark_in-studio.jpg")


Recent Comments