by Contributed | May 4, 2021 | Technology
This article is contributed. See the original author and article here.
Today we are excited to announce the initial availability of Power BI connected PivotTables in Excel for the web. As part of our journey to simplify enterprise data discovery and analysis in Excel, this new capability unlocks more ways to consume such analysis from Excel for the web, empowering more users to make critical decisions with the benefits of Excel and Power BI. For example, you can get up-to-date insights by refreshing the PivotTable, or conduct explorations by manipulating the PivotTable fields all in a browser. You can also include live Excel PivotTables connected to Power BI data directly within your Power BI solutions and apps.
Furthermore, a layer of data protection is added by respecting any existing Microsoft Information Protection labels applied to the Power BI datasets as you connect to it with PivotTables in Excel for the web.
This will work on any workbooks in OneDrive for Business, SharePoint, and Teams, as well as those uploaded to the Power BI service. Users will need access to the underlying dataset to interact with PivotTables connected to Power BI datasets (see how to share Power BI datasets). *Note: refresh and interactivity of Power BI datasets with a live connection to Analysis Services in Excel for the web is not supported.
This new feature has started rolling out across Microsoft 365 tenants, and we expect full roll out over the next few months.
Other Improvements
We are making a few other improvements to help you to be more productive with Power BI connected PivotTables.
Drag-and-Drop Aggregations
PivotTables connected to Power BI datasets will now support drag-and-drop aggregation of fields (e.g. sum, average, distinct count, etc.). This helps you to quickly get answers within Excel without needing pre-defined measures in the underlying Power BI datasets.
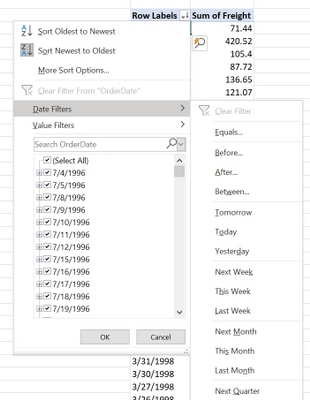
Date Fields
PivotTables connected to Power BI datasets will now support date fields, which means that date filters timelines, and date sorting will now be available.
Field list updates
In addition, we are making some small modifications to the field list, namely pre-defined measures will now be shown within the table they are stored in. We are also updating some of the icons.

We Made it Faster Too
You may have noticed that PivotTables connected to Power BI also got faster. This is due to the recent updates to the Analysis Service engine in Power BI. Learn more details here: Analysis Services Tabular improves MDX query performance in the cloud.
Support for drag-and-drop aggregations, date fields, and the field list improvements will start rolling out in Excel Windows to Office Insiders soon and will be brought to Excel for web at a later stage.
Getting Started Now
We invite you to try out these new capabilities for yourself as they become available to you in the upcoming weeks. Send us your feedback via Help > Feedback in the app.
To learn more:
Subscribe to our Excel Blog and join our Excel Community to stay connected with us and other Excel fans around the world.
by Contributed | May 4, 2021 | Technology
This article is contributed. See the original author and article here.
Azure VMware Solution is a hyperconverged vSphere cluster that leverages an all-flash VMware vSAN software-defined storage system. vSAN is a powerful software-defined storage system, offering many great features available when using Azure VMware Solution.
Like with any storage solution, there are ways to optimize the consumption of the disk. VMware vSAN enables tuning of each VMs storage policy. The granularity goes much deeper than just the VM; each disk attached to the VM can have its own storage policy.
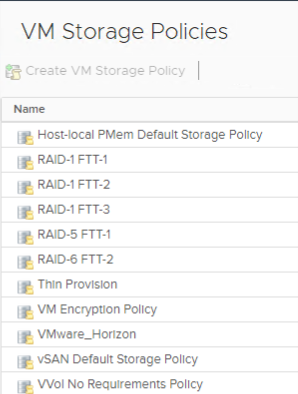
This default storage policy applied to any disk created in the Azure VMware Solution private cloud is 1 failure – RAID-1 (Mirroring). In other words, one host can fail, and no data will be lost. Twice the amount of raw disk is needed to support the consumed disk in this configuration. When a vSAN cluster is only three nodes, this is the only policy available. See this blog article to understand how to modify Azure VMware Solution disk storage policies as the cluster grows.
The typical lifecycle of an Azure VMware Solution private cloud is the initial three (3) node deployment; then, the migration of virtual machines begins from on-premises to Azure VMware Solution, or workloads grow organically. Of course, as more and more VMs begin to fill the three-node cluster, at some point, the cluster nodes need to be expanded to a 4th, 5th, 6th, etc. This ability to grow and shrink the cluster on demand is the beauty of cloud-scale, and more explicitly, running VMware in the cloud. On-premises VMware clusters so many times are overprovisioned, which presents a whole new set of challenges. No need to do that with Azure VMware Solution.
As the cluster grows, more storage policies are available. Here is a complete list of storage policies that are available for Azure VMware Solution VM disks.
If the storage policy used on the virtual machine disks continues to be the same, as the cluster grows, the vSAN cluster will quickly fill. RAID 5/6 policies give a much more efficient use of storage vs. the RAID 1 configuration.
As the Azure VMware Solution private cloud grows beyond three nodes, choose which type of storage policy is best for the VM disks. Then go back and reconfigure the storage policies on the disks of the VMs deployed when the cluster was a three-node cluster.
By doing this, you are optimizing the storage consumption of the Azure VMware Solution cluster, maximizing the investment.
The table below is from the VMware vSAN Design Guide. As you can see, it outlines the types of RAID configurations available and the number of hosts required based on the failures to tolerate needed.

by Contributed | May 4, 2021 | Technology
This article is contributed. See the original author and article here.
If network issues are an obstacle to successfully deploying and using HoloLens 2 in your organization, learn how two well-known network diagnostic tools, Fiddler and Wireshark can help you scan, diagnose, and identify problems.
Fiddler is a web debugging proxy and is used to troubleshoot HTTP(S) issues. It captures every HTTP request the computer makes and records everything associated with it. Uncovering end-user authentication issues for the HTTPS apps used in your organization drives better productivity and efficiency for your HoloLens 2 use cases.
Wireshark is a network protocol analyzer primarily used to inspect TCP/UDP traffic from and to your HoloLens 2 devices. This makes it easy to identify what traffic is crossing your network to your HoloLens 2, how much of it, how frequently, how much latency there is between certain hops, and so forth.
In this blog, we’ll go over some examples of when to use these tools, along with installing and configuring them with your HoloLens 2.
Fiddler
For example, let’s say you have an authentication issue with a custom line of business (LOB) application. After being installed on your HoloLens 2, the app can’t authenticate to the back-end server through HTTPS. To troubleshoot this, you can use Fiddler to capture and decode the HTTPS sessions, enabling discovery of network level-issues.
Configure Fiddler to capture HTTP traffic from HoloLens 2
Prerequisites:
- HoloLens 2 devices and your PC must be on the same network
- Note the IP address of your PC
Steps:
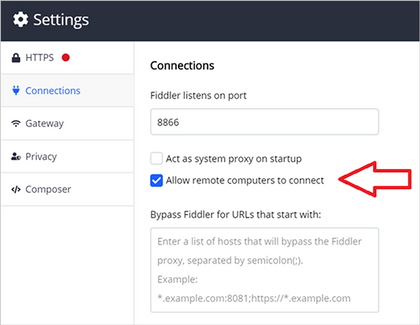
On your PC, install and start Fiddler. Configure Fiddler to allow remote computers to connect then:
- Go to Fiddler Settings and select Connections.
- Note the listening port for Fiddler (the default is 8866).
- Select Allow remote computers to connect.
- Select Save.
Selecting “Allow remote computers to connect” in Fiddler’s connections settings
On your HoloLens 2, configure Fiddler as the proxy server*:
- Open the Start menu and select Settings.
- Select Network & Internet and then Proxy on the left menu.
- Scroll down to Manual proxy setup and toggle Use a proxy server to On.
- Enter the IP address of the PC where Fiddler is installed.
- Enter the port number noted above (default is 8866).
- Select Save.
*If your HoloLens 2 devices is running Windows Holographic builds 20279.1006 and later (Insiders and the upcoming release), use the following steps to configure proxy:
- Open the Start menu and go to your Wi-Fi network’s Properties page.
- Scroll down to Proxy.
- Change to Manual Setup.
- Enter the IP address of the PC where Fiddler is installed.
- Enter the port number noted above. (default is 8866).
- Select Apply.
Decrypt HTTPS traffic from HoloLens 2
On your PC, export the Fiddler certificate.
- Go to Fiddler Settings > HTTPS and expand Advanced Settings.
- Click Export Fiddler certificate. The certificate will save to your desktop.
 Exporting the root certificate in Fiddler
- Move the certificate to the Downloads folder on your HoloLens 2.
On your HoloLens 2, import the Fiddler certificate.
- Go to Settings > Update and Security > Certificates.
- Click Install Certificate, browse to the Downloads folder and select the Fiddler certificate.
- Change Store Location to Local Machine.
- Change Certificate Store to root.
- Select Install.
- Confirm the certificate is showing in the list of certificates. If not, repeat the above steps.
Inspect HTTP(S) sessions
On your PC, Fiddler will show the HoloLens 2’s live HTTP(S) sessions. The Inspectors panel in Fiddler can show HTTP(S) request/response in different views – for example, the “Raw” view shows the raw request or response in plain text.
 The Inspectors panel in Fiddler showing the HoloLens 2 HTTP session
Wireshark
Applications like Dynamics 365 Remote Assist and VPN plug-ins use non-HTTPS traffic. If your HoloLens 2 has any issues with those types of apps, Wireshark can be used to capture and inspect the IP traffic to troubleshoot your internal OS level networking stack.
Configure Wireshark to capture network traffic from HoloLens 2
Prerequisites:
- PC must have internet access and support Internet sharing over Wi-Fi.
Steps:
On your PC:
- Install Wireshark.
- In Mobile hotspot settings, turn Share my Internet connection with other devices to On.
 Mobile hotspot settings on the Windows 10 PC
- Start Wireshark and capture traffic from the Mobile hotspot interface.
 The Capture screen in Wireshark
On your HoloLens 2, change the Wi-Fi network to the PC’s mobile hotspot. HoloLens 2 IP traffic will now show up in Wireshark.
Analyze Wireshark logs
Wireshark filters can help filtering out the packets of interests. For example, “tcp.stream eq 1” shows the second TCP stream in the log (stream index starts with 0), “ip.addr == 192.168.137.1 && tcp.port == 80” filters out the TCP packets on port 80 with source/destination IP equals 192.168.137.1.
 An example of the logs produced by Wireshark
Conclusion
After deploying HoloLens 2 to your organization, you may need to capture network traffic for troubleshooting purposes. Both Fiddler and Wireshark will work with the HoloLens 2 to identify and diagnose problems in the HTTP(S) and TCP/UDP levels.
Feedback Hub and troubleshooting tips
HoloLens 2 provides a few methods for users to provide diagnostic logs to Microsoft for investigation. You can use Feedback Hub to submit logs for generic network connectivity issues by submitting your feedback through the “Network & Internet” category. In addition the built-in Settings Troubleshooter can collect detailed network traces for more complex issues. Please refer to Collect and use diagnostic information from HoloLens devices for instructions.
Additional resources
For additional information, please see:

by Contributed | May 4, 2021 | Technology
This article is contributed. See the original author and article here.
You might not see this feature yet. Some functionality is introduced gradually to organizations that have set up the Targeted release options in Microsoft 365. |
Imagine you’re working on a project that needs a new SharePoint site to track deadlines, record progress, and serve as a central place to collaborate with your team. Perhaps you’ve been tasked with creating an onboarding portal for your organization complete with new hire checklists and key information to help them get started. Maybe you’re leading a training series where you need to store course files and post class announcements. Where do you begin when it comes to designing sites for these scenarios?
Now you have a starting point! We’ve made it even easier to begin on the right foot with site templates that are available to you in SharePoint. SharePoint site templates are flexible enough to address a variety of needs, make it easy to create and populate site content, and show you what’s possible. These complement those found in the SharePoint lookbook, which has been and continues to be an amazing source of inspiration for modern experiences you can build with out-of-the-box SharePoint components.

Through customer conversations and user research, we identified 8 scenarios to start with that benefit from having a robust SharePoint site template. SharePoint customers can take advantage of the following SharePoint site templates:
Communication site templates
- Department – Engage and connect viewers with departmental news and resources.
- Leadership connection – Build community by connecting leadership and team members.
- Learning central – Showcase learning and training opportunities.
- New employee onboarding – Streamline and refine new hire onboarding process.
Team site templates
- Event planning – Coordinate and plan event details with your team.
- Project management – Create a collaboration space for your project team.
- Training and courses – Prepare course participants for learning opportunities.
- Training and development team – Plan opportunities to help others learn and grow.
We will continue to build on these options in the future to address even more common scenarios.
How to apply a template and what to expect
SharePoint site templates will be automatically available in SharePoint tenants and can be applied by users with site owner permissions or higher. When you create a new site, you will be asked if you’d like to use a template. Select Browse templates to see Microsoft templates and templates from your organization. Or apply a template to an existing site by navigating to Settings and then select Apply a site template.
Our site templates currently offer the following features:
- Can be applied at the time of site creation or can be applied to existing sites.
- Fully customizable home pages that come with pre-populated content and web parts.
- News post templates that help users quickly and consistently publish news.
- Pre-built pages, lists, and document library folders that make it easy to build sites and inspire your own custom content.
- Each template has its own customization guidance to help site owners and editors get started.
What about my existing site designs?
If you’ve used site designs in the past, that experience has been incorporated into the site templates experience and will be referred to as site templates moving forward.
The Site designs entry point will be replaced by the Apply a site template entry point in the Site settings panel. You’ll find your organization’s existing site templates on the “From your organization” tab in the template gallery.
Additionally, as part of the new site template experience, a progress screen is displayed while the site template is being applied instead of a notification bar.
Learn more about how to create custom site templates for your organization using site scripts.
Site template FAQs
Q: What happens when I apply a template to a site that is associated with a hub site?
A: If your site is associated with a hub, the site will inherit the theme from the hub. When you apply a template, it will automatically use the theme from the template, but will update to the hub’s theme shortly after republishing.
Q: How can I undo a template I just applied?
A: There is no automatic method to undo the application of a site template. However, there is nothing that a template does that can’t be manually applied or deleted. For example, pages and navigational elements can be deleted and themes can be update.
Q: I don’t want to use a template. How can I quickly create a site?
A: There are several resources to inspire your next SharePoint site – like the SharePoint look book and Guided walkthroughs.
Q: How can I update the theme of the site template to a theme that has not been defined by my organization?
A: For themes that don’t fit into your organization’s custom or pre-defined themes, you can change the look of your site in the Settings panel to manually update the theme.
Q: What happened to Site designs in the Settings panel?
A: In previous versions of SharePoint, site templates were called site designs but will be referred to as site templates moving forward. The Site designs entry point has been replaced by the Apply a site template entry point in the Settings panel.
Q: How can I create custom site templates for my organization?
A: You can create site templates to provide reusable lists, themes, layouts, pages, or custom actions so that your users can quickly build new SharePoint sites with the features they need. Learn more about how to create custom site templates for your organization.
Q: How can I learn more about how to customize site templates created by my organization?
A: Site templates provided by your organization will appear in the From your organization tab when selecting a template type. Customization instructions will vary depending on the site template design. Review customization resources below to learn more about site personalization options.
Learn more
Apply and customize SharePoint site templates
SharePoint site design and site script overview
SharePoint Roadmap Pitstop April 2021 (microsoft.com)
by Contributed | May 4, 2021 | Technology
This article is contributed. See the original author and article here.
Many IT executives are concerned about the security of Operational Technology (OT). This concern is valid based on my experience, but sometimes the approaches to alleviating this anxiety creates a divide between the IT and OT sides of the ‘house’. This blog will attempt to address this divide with practical suggestions about how to get the best results from a thoughtful approach. It will also address methods to accomplish useful but non-intrusive monitoring in the OT environment. It will provide specific technical examples to guide you. If this tickles your interest, read further.
Passive network monitoring is one of the most effective and least intrusive tools to gain visibility into OT networks. Installed properly it provides information on inventory, network topology, protocols in use, endpoint types, switches and routers, etc. Much of this information is not generally well documented and is only vaguely known by enterprise security teams. It lives below OT edge firewalls and is carefully guarded by the engineers who are responsible to make sure their factories continue to operate reliably. As most security experts know, it is impossible to protect equipment you don’t know you have.
There is a natural push-pull between enterprise security teams who are tasked with overall business protection and operational engineers who are more focused on production. It is common for operational engineers to express concern that a network monitoring tool will affect the reliability of the OT equipment. While they may be honestly concerned about cyber security, they fear repercussions if reliability is affected. If corporate policy mandates monitoring, the security team is usually instructed to install their monitoring equipment as far away from the production equipment as possible. This usually results in an installation at or near the enterprise edge firewall. The most common argument is that anything bad will come from the internet which is on the other side of that firewall. This is usually NOT the best location for OT network monitoring and the assumption relating to the source of threats is not accurate either. However, based on the urgency of schedules, this location is often accepted as better than nothing. It is important to understand that the AD4IoT sensor is completely passive. It only listens to copies of network traffic and as such is not a threat to operational technology.
I would like to suggest a more reasoned approach, which admittedly takes more time and possibly resources, but results in a win-win for both groups if implemented well. OT networks are often complicated by a variety of interconnected systems as shown in the next diagram. The red sections of this diagram show the ideal locations for connections to the AD4IoT. It is important to start implementation with a diagram of the OT system. Diagrams of this sort are often provided as proposal documentation when Industrial Control Systems are purchased. They may often be found in on control house walls, or in the OT engineer’s office. Because these systems continue to evolve, and are often upgraded in piecemeal fashion, these drawings are seldom up to date. However, they still provide a reasonable starting point for understanding the best placement for sensors. The point is to accurately and completely document the inventory of control equipment and the network architecture of the system. If a sensor is only installed in the outgoing DMZ, much of this inventory information will not be available. Information identifying the types and versions of Purdue level 0 to 2 devices will not be available. To determine this information, the actual downloads to these devices must be seen by the AD4IoT sensor.

This is an example of an ICS diagram with the recommended locations of sensors (in red).
How can we identify if we are located at the best location?
A sample traffic taken too high in the network is analyzed below using the sensor.
In these screen shots, the sensor is too high in the network, too close to the enterprise firewall. Note that no devices in the Process Control Level 0/1 are shown. The monitoring in this network shows the workstations and their interactions with database server, engineering, HMIs, and AD, some exiting traffic, but no PLC control traffic.
 In the inventory, no firmware or model information is identified because the traffic to the PLCs is not being seen at this location in the network.
 Another similar instance is where the majority of the traffic is broadcast or multicast. While some industrial control systems use this method for information transfer, the indications here are that the sensor is not seeing much of the control traffic. Only one PLC is shown in the Process Control area and most devices are sending multicast traffic. The switches are seen, the HMIs and database servers but not much control traffic as shown in the inventory view below.


A properly configured system will look like this. Notice the OT Protocols; Profinet DCP, Profinet Real-Time, Siemens S7 and S7 Plus. Notice the balance between Supervisory and Process Control. The sensor is seeing the traffic between the engineering workstation and the PLCs when they are downloaded as evidenced by the presence of firmware versions and PLC model numbers in the inventory.


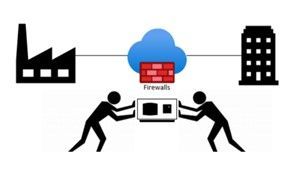
Why not just monitor the enterprise edge?
I would like to address the reason for monitoring networks in the ICS in addition to monitoring at the enterprise edge. Many people assume that this is adequate since they see this as the source of all threats. I will use the sample ICS network shown above to discuss some potential access points for malware or data compromise, see below.

With your security ‘blue team’ hat on, think about these scenarios identified by numbers in blue ovals on the diagram:
- The ICS (or DCS) may be maintained by an external contractor, possibly the system integrator in the case of PLC systems, or generally the Original Equipment Maker (OEM), for DCS equipment. Sometimes these people are authorized to utilize laptops with specialized OEM software to perform upgrades, troubleshoot problems, install new hardware or do routine system maintenance. Even if they are not permitted to utilize their laptops, they may install software, OS and firmware upgrades, and other activities utilizing programs they bring in on USB or other devices.
- Many large organizations have network engineers who manage all or most network devices, including but not necessarily limited to switches, routers, firewalls, and the like. Smaller organizations may contract networking engineers. This being a rather specialized function, these folks usually operate somewhat independently of the normal operations personnel. Exceptions would be when the ICS or DCS supplier either utilizes unmanaged devices or provides the management function as a part of their service. Switch management and required firmware upgrades in addition to reasonable hardening is not normally on the ‘radar screen’ for many system upgrades. The adage, ‘if it ain’t broke, don’t fix it’ is commonly the norm.
- Variable Frequency Drives (VFDs) are generally maintained by the supplier. Problem-solving, firmware upgrades, and system modifications are accomplished through contracts or purchase orders with the equipment provider. These changes once again introduce uncontrolled laptops into the OT environment where these devices may be networked to the ICS.
- Very expensive process analyzers and industrial robots may be leased from the manufacturers. This equipment often comes with a required data connection to the manufacturer for usage monitoring and troubleshooting purposes. These connections should be and often are firewalled but may allow incoming traffic for firmware updates and other related activities.
- Most large organizations have physical security operations handled by separate internal organizations or through an externally contracted firm. It is common to see security cameras that are used for both ICS and security functions. Sometimes, the operator can even view the perimeter cameras or other cameras on his/her operator screens.
- It is also common to see voice communication equipment sharing switches or infrastructure devices with OT networks. While these are generally on different VLANs, errors can connect these devices with OT equipment.
- Additionally, there may be data links to Uninterruptible Power Systems (UPSs), again usually maintained by the OEM.
- Plant historian packages often have links to share plant data, inventory, and other information with the enterprise.
- Sometimes contracts are established for the maintenance of corporate printers. Since most of these devices have unpatched apache web servers, maintenance could introduce issues carried over from enterprise equipment.
- Operators have even been known to utilize USB ports on HMI devices to charge their phones thereby unknowingly placing the HMIs on a cellular network.
- Cleaning contracts, maintenance of support systems such as HVAC and fire protection generally allow access to controlled areas where physical access to ICS equipment could be leveraged by unscrupulous parties.
And the list can go on… with every industrial facility having different variations on this theme. As any security-minded individual can readily see, the opportunities for compromise, malware infection, and data exfiltration in any large industrial campus are numerous.
Conclusions
Coordination with operational engineers is the starting point to a win-win engagement. The benefits are apparent to both enterprise and operations personnel. With correct sensor placement, a complete inventory with full device information, firmware versions and model numbers can be derived. This is a benefit to both parties. Additionally, the actual network flows can be confirmed, unexpected paths can be identified and potential vulnerabilities can be found and corrected.
Monitoring Industrial Control Systems at the enterprise edge, while important, is by no means adequate. Malware introduced, even if prevented from beaconing home by enterprise edge firewall rules, can still damage operational equipment and affect production or operational safety. Data can be modified, control system programs could be changed to perform dangerous actions, company secrets could be stolen, and system backups corrupted.


Recent Comments