This article is contributed. See the original author and article here.
Over the past year, the shift to remote and hybrid work has meant our customers have navigated a digital transformation in the span of a few weeks or even days. This new work environment can be disorienting for employees while they navigate a blended environment of work and home and challenging for employers to support participation in a positive company culture across a distributed workforce. Maintaining a positive company culture while reducing risk has become both more critical, and more challenging to ensure a positive, safe culture where engaged employees can thrive.
With the rapid transformation to remote and hybrid work environments, the number of communications sent over digital communication platforms has grown exponentially. In fact, our recent Work Trend Index showed that between February 2020 and February 2021, the average Microsoft Teams user sent 45 percent more chats per week and 42 percent more chats per person after hours, with chats per week still on the rise.
While organizations seek out emerging technology to empower employees to do their best work in this environment, they also need to manage risk in communications to protect company assets and flag sharing of concerning content such as adult imagery or threatening language. Communication Compliance helps organizations detect these types of code of conduct violations as well as regulatory compliance requirements within company communications, with as little disruption possible to the business.
Today, we are excited to announce new capabilities that further enrich the solution’s integration with Microsoft Teams, intelligence, visibility, and reporting capabilities, while continuing our commitment to end-user privacy. For all the new features highlighted below, we have built strong safeguards and controls into the solution by default, such as pseudonymization, rules-based access control, admin explicit opt-in of users, and audit trails.
Deeper Microsoft Teams integration
As Microsoft Teams continues to elevate as a collaboration and teamwork platform, organizations need to respond to communicate risks effectively and quickly. To meet this need, we have made several Microsoft Teams investments to further integrate Communication Compliance capabilities. In this release, Communication Compliance will now provide policy investigators with additional Teams conversation context so that they can better assess whether a communication presents a potential violation. With this feature, policy reviewers will no longer have to search for additional context elsewhere and instead will see the messages before and after the one that matched the policy condition. Additionally, Communication Compliance can help organizations detect regulatory compliance and code of conduct violations in Adaptive Card content generated through apps in Teams.
Globalization and expanded visibility
To expand the ability to detect policy violations in communications beyond English, Communication Compliance now enables customers to detect potential compliance issues in French, Spanish, German, Portuguese, Italian, Japanese, and Chinese. And by leveraging Microsoft Translate, message content in a policy violation will be automatically translated to the policy reviewer’s preferred language when the message is in another language.
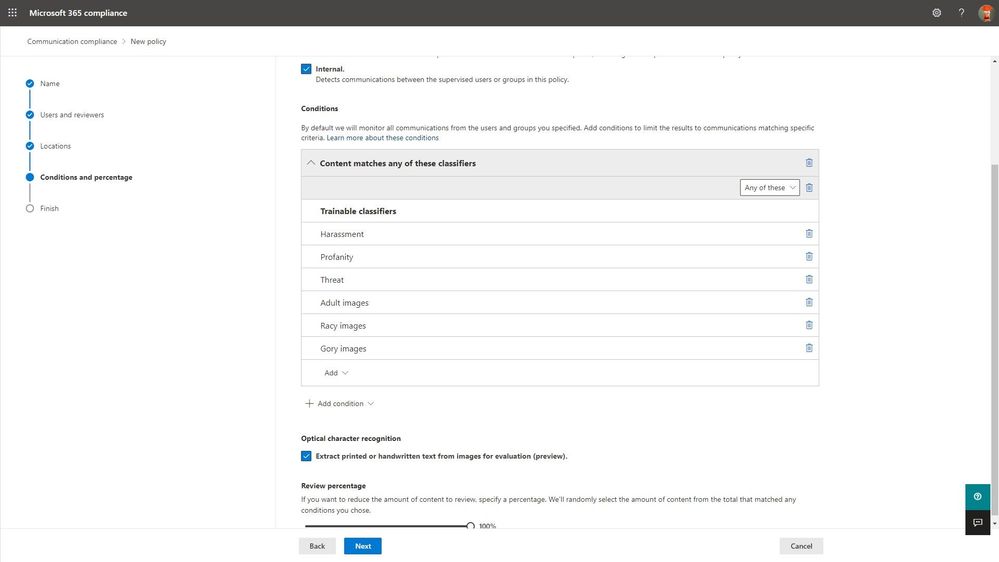
Additionally, we are introducing the ability for customers to detect compliance violations in images by extracting printed or handwritten text using Azure’s Computer Vision Optical Character Recognition (OCR). With OCR,text extracted from images or PDF will then be evaluated against the customer’s policy conditions (such as keywords matches for threatening language), further reducing an organization’s policy violation risk.
[Selection of optical character recognition to extract printed or handwritten text from images]
New communication risk detection templates and enhanced intelligence
Many of our customers have compliance requirements to ensure there is no sharing of information that could lead to a conflict of interest between different departments or groups of employees. For example, in the financial services industry, various regulations require organizations to build information safeguards so that there is no sharing of findings, output, or research across sales and trading departments. To detect potential conflicts of interest, we introduced a new template in Communication Compliance that customers can leverage to identify compliance issues in communications between two groups of users within their organization that could potentially lead to a conflict of interest.
[Policy setup for conflicts of interest template]
And in 2020, conversations around diversity, equity, and inclusion took center stage. We at Microsoft denounce injustice, racism, and discrimination. To detect and triage explicit discriminatory messages, we have enhanced our existing offensive language template to enable customers to detect potentially discriminating comments,supporting our customers in building more inclusive workplaces.
Advanced reporting and storage capabilities
We have enhanced the solution’s reporting capabilities with the introduction of the Sensitive information type flagging report, which provides customers with a breakdown of how many hits each sensitive information type receives by location.
With remote and hybrid work came an increased volume of digital messages, which has put customers at risk of exhausting their policy mailbox quota. To address this challenge, Communication Compliance shows and alerts customers when their storage consumption is reaching capacity. And from there, customers can now pause a policy from further evaluations of communications or clone the policy to continue detecting the policy scenario with renewed capacity.
Tune in to our podcast: Uncovering Hidden Risks
We have partnered with some of the top experts and thought leaders in the insider risk space who have a deep understanding of the challenges organizations face and the people, processes, and technology being used to address insider risks. Tune in to our podcast series Uncovering Hidden Risks, where we deep dive on topics like signal indicators, machine learning, and sentiment analysis.
Get Started
These new features in Communication Compliance have already rolled out or will start rolling out to customer’s tenants in the coming weeks. Communication Compliance is part of a broader set of Insider Risk Management solutions that help organizations mitigate insider risks and policy violations in Microsoft 365 E5. The solution is also generally available across government clouds, supported in GCC, GCC-High, and DoD tenants.
Learn more about what’s new with Communication Compliance and how to get started and configure policies in your tenant in this supporting documentation. We look forward to hearing your feedback.
Thank you,
@Liz Willets, Product Marketing Manager, Microsoft 365 Security and Compliance Marketing
@Christophe Fiessinger, Principal Program Manager, Microsoft 365 Security and Compliance Engineering
This article is contributed. See the original author and article here.
One very important aspect of managing one’s applications is that of monitoring and alerting. The Azure product group is acutely aware of this need, of course, and have built an advanced monitoring and alerting system right inside the portal, under the “Alerts” area. As part of this, you can configure various rules to keep track of your resources. These rules key to various elements (“conditions”), which you would choose from based on your understanding of the app and what are its key function parameters. There are about 60 conditions available, like certain HTTP errors, or CPU time. For example, one of the fundamental ways you could keep an eye on your app would be to set an alert on http server errors, and run it for a certain while without “major” alerting (as in, don’t email the entire world about every error just yet) to establish your baseline, as any app would have a certain amount of errors occasionally. Let’s say you run this for 2 weeks and see on average of 3 errors per day…you would then set the alert threshold to something higher, thus avoiding waking up everyone at 2am just because one user clicked the wrong button.
After configuring the conditions and thresholds that are appropriate for your application, you would decide what to do with it. Azure can send an alert to an email address, or to SMS, or perform a push-notification to the Azure app on your phone, or to make a phone-call (voice). You could add as many targets as you wish, though most people create some kind of corporate alias or group, which people can join or be added to get the notifications. You can see more info and a helpful video about configuring Service Now to interact with our alerting on the Azure blog.
However, really keeping track of your application is much more complicated, because the very notion of “up” vs “down” is different for every app. For example, if the application displays a form for the user to fill-out, then just testing if the form loads correctly doesn’t really give you much, and a truer test would be to see what happens when the form is submitted. If the application uses some kind of authentication, then testing the authentication process is an important goal, but not always possible, because it would typically require creating some kind of test account and that could create a security risk. One way to clear some of these obstacles is to create specific test pages, which perform “backend” operations, such as running a database query and displaying the result. Creating such a page and checking if it loads successfully and/or delivers the expected content is a good way to test the app.
Another aspect of testing is the one of performance. An application can be “up”, but the time it takes to process a transaction can suddenly go from 8 seconds to 50 seconds. That kind of change is way below normal time-outs, but certainly above the patience threshold of many human beings, so tracking it is an important way to know things might be going awry.
But things can get a lot more complicated, because as I noted, “up” and “down” can mean many things. For example, what if your application normally has about 100 transactions per minute, but suddenly, that number jumps to 1600? That’s not “down”, but such a growth could mean that the code is going into some kind of loop due to a bug or design issue, and that could be both a bad user experience, as well as cause undue strain on your resources, and even cause a spike in costs. Also, it could mean that some malicious party is doing some kind of footprinting on your app to find vulnerabilities, or performing a denial-of-service attack against the app. All of these are things you probably want to be aware of even if the app feels perfectly normal to all your users.
Another thing to consider is that for users, there could be nuanced notions of what’s “down”. For example, your form could be loading, but it could be missing some image or CSS files, causing the appearance to suffer. This kind of thing doesn’t mean the app is down, but it can look very ugly, and if your users are customers, it could make the company look bad.
Yet another thing to consider is alert levels. If your app is dead, you certainly want all-hands on deck, but if it’s performance is down by 20%, you might want a more limited circulation of just system admins or a developer or two. You might want that specific alert level to be off during the night, and set various thresholds (for example, 20% drop, just send an email to be read during the next business day, but a 40% drop warrants a phone call). The more complex the app and development process, the more elaborate your alerting decision tree and flowchart would be. Another aspect of this is the alert interval. Most monitoring options run at very short intervals, like once every 5 minutes, or even less, but people don’t typically respond that fast, and code-fixed can take time to develop and deploy. You certainly don’t want your CEO to receive a phone call every 60 seconds for 5 hours while your people are trying to fix it, right? Similarly, if the alerting system generates a high volume of alerts, many people tend to set email filters, so they don’t wake up in the morning to 540 new emails. Those kind of filters could lead to the issue not being seen, and so the alerting is too loud to be useful. A better design would be to have alerting trigger a certain number of alerts, but then quiet them down before they become unmanageable.
In closing, alerting is an engineering effort that in many cases can be almost as complex as designing the application itself, and so a good idea for any organization is to start planning this from day-1, alongside the applications’ design and coding. Integrating this into the app early is more likely to lead to a reliable and stable monitoring, and thus a more reliable and stable application.
This article is contributed. See the original author and article here.
We frequently hear from customers that they are concerned whether their users are getting the best possible performance and experience with Microsoft 365, which is often determined by the quality of connectivity that their users have and how Microsoft 365 connections are handled by the networks and network solutions between the client and Microsoft. Customers ask how they can measure and see the quality of network connectivity for their Microsoft 365 users and get insights how to optimize it further. That’s why we are excited to announce the General Availability of Microsoft 365 Admin Center Connectivity and the Microsoft 365 network connectivity test tool!
Using existing network connectivity tests in Microsoft 365 can provide network assessments and insights. They are aggregated to represent the network connectivity of a work location in use by an Microsoft 365 customer. This can be very valuable in identifying potential network connectivity improvements that would improve performance and provide a better user experience for Microsoft 365 users.
Microsoft 365 admin center network connectivity
Overview tab for Microsoft 365 admin center network connectivity
After configuration, the page for network connectivity in the Microsoft 365 admin center shows office locations where network connectivity is evaluated. Each location shows relative number of users connecting from the office and indicates the impact to user experience from network connectivity at that location. We show you a map of global performance, tenant-wide network assessment scores and location-specific network assessment scores for offices and remote workers in a city. You can view the network insights for each location to take action or research further. You can also drill down to each location for the detailed list of network connectivity tests and insights.
Summary of an office location in Microsoft 365 admin center network connectivity
Microsoft 365 network connectivity test tool
Summary result for Microsoft 365 network connectivity test tool
The Microsoft 365 network connectivity test tool allows for similar network tests to be run on demand and results to be viewed immediately. It The connectivity test tool allows users at remote locations to run networking tests in their web browser and the downloadable executable. It identifies common network design issues that violate Microsoft 365 network connectivity principles. The tool can be run anonymously or by signing in to a Microsoft 365 account to share results your administrator and other stakeholders.
Details results tab for Microsoft 365 network connectivity test tool
Actionable network insights supporting improved user experience
Microsoft describes guidance for securely optimizing Microsoft 365 network connectivity in Microsoft 365 network connectivity principles. The goal of the two tools is to help test for how closely that guidance is followed and provide recommendations for getting better performance and user experience.
Insight: Backhauled network egress – this is shown for a location when the users are more than 500 miles away from the network egress. It is recommended that users have local network egress so that connections can be made to the closest Microsoft network point of presence.
Insight: Network intermediary device – this is shown for a location when the users are connecting to Microsoft 365 through a proxy server or similar packet interception device. It is recommended that these be bypassed for critical Microsoft 365 network connections.
Insight: Better performance detected for customers near you – this is shown for a location where a number of other Microsoft 365 customers in the same geographic area have significantly better performance. More investigation would be required, but this indicates that the local telecommunications infrastructure is capable of providing a better Microsoft 365 user experience than your users are getting.
Insight: Low download speed from SharePoint front door – this indicates that the download speed for OneDrive for Business or SharePoint users is very poor in this location. Further investigation may be required to identify the cause, but often bandwidth can be increased to improve user experience.
Finally, it’s worth noting that all these tests and insights are generated in strict compliance with Microsoft security and privacy practices. Security and privacy sensitive customers will appreciate that those tests do not collect user or device identifiable information and thus can’t be attributed back to a specific person.
To learn more about Microsoft 365 admin center network connectivity, click here.
To learn more about the Microsoft 365 network connectivity test tool, click here.
Continue the conversation by joining us in theMicrosoft 365 Tech Community!Whether you have product questions or just want to stay informed with the latest updates on new releases, tools, and blogs, Microsoft 365 Tech Community is your go-to resource to stay connected!
Formerly, only SQL Managed Instance supported the creation of those Azure AD object types on behalf of an Azure AD Application (using service principal). Support for this functionality in Azure SQL Database is now generally available.
This functionality is useful for automated processes where Azure AD objects are created and maintained in Azure SQL Database without human interaction by Azure AD applications. Since service principals could be an Azure AD admin for SQL DB as part of a group or an individual user, automated Azure AD object creation in SQL DB can be executed. This allows for a full automation of a database user creation. This functionality is also supported for Azure AD system-assigned managed identity and user-assigned managed identity that can be created as users in SQL Database on behalf of service principals (see the article, What are managed identities for Azure resources?).
Prerequisites
To enable this feature, the following steps are required:
1) Assign a server identity (a system managed identity) during SQL logical server creation or after the server is created.
See the PowerShell example below:
To create a server identity during the Azure SQL logical server creation, execute the following command:
New-AzSqlServer -ResourceGroupName <resource group> -Location <Location name> -ServerName <Server name> -ServerVersion “12.0” -SqlAdministratorCredentials (Get-Credential) -AssignIdentity (See the New-AzSqlServer command for more details)
For existing Azure SQL logical servers, execute the following command:
Set-AzSqlServer -ResourceGroupName <resource group> -ServerName <Server name> -AssignIdentity (See the Set-AzSqlServer command for more details) To check if a server identity is assigned to the Azure SQL logical server, execute the following command: Get-AzSqlServer -ResourceGroupName <resource group> – ServerName <Server name> (See the Get-AzSqlServer command for more details)
Once steps 1 and 2 are completed, an Azure AD application with the right permissions can create an Azure AD object (user/group or service principal) in Azure SQL DB. For more information, see the step-by-step tutorial doc (see Tutorial: Create Azure AD users using Azure AD applications ).
Example
Using SMI (System-assigned Managed Identity) set up as an Azure AD admin for SQL DB, create an Azure AD application as a SQL DB user.
Preparation
Enable steps 1 and 2 indicated above for the Azure SQL logical server
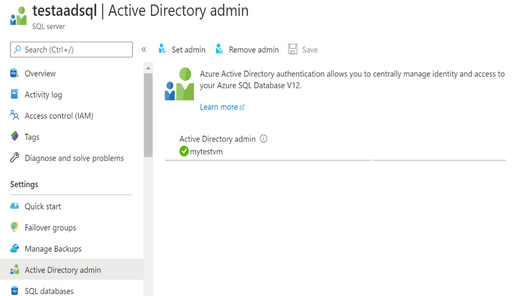
In the example below, the server name is ‘testaadsql’
The user database created under this serve is ‘testdb’
Alternatively, the SMI could be also be represented as a regular Azure AD user created in the database ‘testdb’ with dbo permissions allowing to create other Azure AD users ( see an example in Tutorial: Create Azure AD users using Azure AD applications )
To check that the user ‘myapp’ was created in the database ‘testdb’ you can execute the T-SQL command select*fromsys.database_principals.
PowerShell Script
# PS script creating a SQL user myapp from an Azure AD application on behalf of SMI “mytestvm” # that is also set as Azure AD admin for SQ DB # Execute this script from the Azure VM with SMI name ‘mytestvm’ # Azure AD application – display name ‘myapp’ # This is the user name that is created in SQL DB ‘testdb’ in the server ‘testaadsql’
# Metadata service endpoint for SMI, accessible only from within the VM:
# Specify server name and database name # For the server name, the server identity must be assigned and “Directory Readers” # permission granted to the identity
This article is contributed. See the original author and article here.
As we continue our journey to provide world class threat protection for our customers, we announce general availability of our cloud-native breadth threat protection capabilities, deliver better integration with Microsoft’s threat protection portfolio and expand our threat protection for multi-cloud scenarios.
At RSA this year we are happy to announce general availability for our cloud breadth threat protection solutions: Azure Defender for DNS and Azure Defender for Resource Manager. By detecting suspicious management operations and DNS queries, these cloud-native agentless solutions are helping organizations protect all their cloud resources connected to the Azure DNS & Azure management layer from attacks. Together these new solutions provide breadth protection for your entire Azure environment, which is complementary to our existing Azure Defender in-depth protection for popular Azure workloads.
We are also announcing general availability of built-in and custom reports in Security Center: you can leverage built-in reports created as Azure Workbooks for tasks like tracking your Secure Score over time, vulnerability management, and monitoring missing system updates. In addition, you can create your own custom reports on top of Security Center data using Azure Workbooks or pick up workbook templates created by our community, share those across your organization and leverage to relay security status and insights across the organization. Learn more in Create rich, interactive reports of Security Center data.
At RSA, we are also introducing new capabilities to create a seamless experience between Azure Defender and Azure Sentinel. The enhanced Azure Defender connector, makes it easier to connect to Azure Sentinel by allowing to turn on Azure Defender for some of the subscriptions or for the entire organization from within the connector. We are also combining alerts from Azure Defender with the new raw log connectors for Azure resources in Azure Sentinel. This allows security teams to investigate Azure Defender alerts using raw logs in Azure Sentinel. We also added new recommendations in Azure Security Center to help deploy these log connectors at scale for an entire organization.
Today’s hybrid work environment spans multi-platform, multi-cloud, and on-premises. According to Gartner 2/3 of customers are multi-cloud. We recently extended the multi-cloud support in Azure Defender to include not just servers and SQL but also Kubernetes – and all using Azure Arc. Azure Security Center remains the only security portal from a cloud vendor with multi-cloud support including AWS and GCP.
As always – don’t forget to enable Azure Defender for your cloud services and especially for virtual machines, storage, and SQL databases. Make sure you are actively working to improve your to improve your security posture and please continue to reach out with feedback.
![[Policy setup for conflicts of interest template]](https://www.drware.com/wp-content/uploads/2021/05/fb_image-98.jpeg "conflicts of interest.jpg") [Policy setup for conflicts of interest template]
[Policy setup for conflicts of interest template]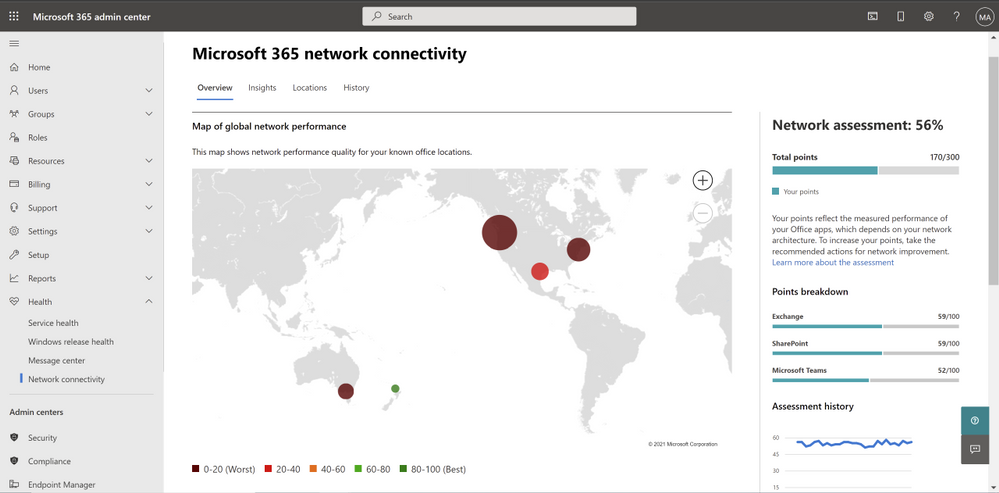


Recent Comments