by Contributed | May 17, 2021 | Technology
This article is contributed. See the original author and article here.
Our Microsoft Mechanics series on Microsoft Viva kicks into high gear this week with our first module deep dive on Viva Topics. I’ve joined Jeremy Chapman, our Microsoft Mechanics host, to give you a quick overview of the module and the foundational technologies that deliver the experience. We also cover the critical role of knowledge managers and the granular admin controls that determine how information is identified, curated, and discovered.
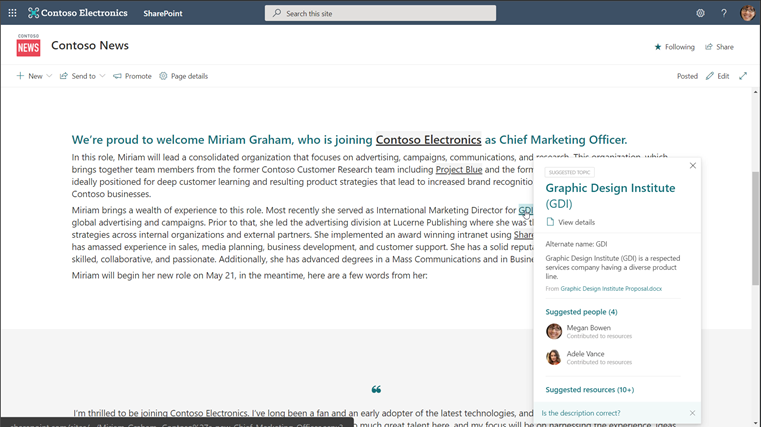
Viva Topics overview. Viva Topics is a system that transforms information into knowledge and actively delivers it to you in the context of your work. The module works with two basic information “currencies,” actual data and information and expert colleagues, and then surfaces them as combined knowledge in the apps you’re already using. You’ll see these experiences in SharePoint Online, Microsoft Search, and Search in Word and PowerPoint now, and we continue to work to bring this to more apps. The result is topic pages and topic cards for things you might consider “tribal knowledge”: acronyms, terms, or project names. Topic pages look a lot like wiki entries. They include the people, files, and sites relevant to the topic, as well as related topics and a comments section—basically, a starting point to the insider knowledge someone needs to more fully understand that topic.
Topic cards are quick summaries of the associated topic page. These appear when users hover over topic page words or phrases and include a link to the associated page itself.
The magic of Viva Topics is that it suggests and gathers all this content for you, leveraging powerful AI, like natural language understanding and entity recognition, and Microsoft Graph to surface the right knowledge to users.
Any information protection and compliance controls you have configured in Microsoft 365 are respected in Viva Topics. The module only shows users the topic pages, topic cards, and resources they are permitted to access, which means they don’t need to spend time requesting (and waiting) for approvals and can’t access knowledge that is inappropriate for their role.
Knowledge managers. While AI provides the initial topic page suggestions and resources, domain knowledge managers help ensure that knowledge is accurate and appropriate. You’ll need to determine the knowledge managers for your organization, but we suggest choosing experts close to the content instead of just assigning the role to IT. Knowledge managers are care how the knowledge in their domain is shared and are ultimately responsible for promoting and engaging their community to contribute to suggested topic pages and their content. They can edit the topic description and add or remove people, files, sites, and related topics as they see fit.

Users. Users can contribute to Viva Topics as well. Users with “topic contributor” permissions can edit topic pages and create new ones manually, while all users can provide feedback on a page’s comments section if the comments are enabled. Users who are authoring and publishing SharePoint pages can also enhance their pages with topics by inserting topic highlights in the content they are creating. These highlights then appear as topic cards to other users.
IT admins. Getting the right knowledge to the right people starts with IT. If you’re an existing Microsoft 365 customer, adding Viva Topics to your tenant is easy. In the Microsoft 365 admin center, navigate to Billing and type “Viva” into the search box. Then, select Details under Viva Topics > Start free trial > Try now > Continue. The one-month trial can help you determine if Viva Topics is right for your organization without a financial commitment upfront.
Signing up for the trial only adds Viva Topics to your tenant; you’ll need to configure the module to make it live for users. There are four simple configuration pages that will determine how Viva Topics functions within your organization: topic discovery, topic visibility, topic permissions, and topic center. To get to these, go to the Microsoft 365 admin center, select Setup, scroll down to the Files and content section, select Connect people to knowledge > Get started.

Once configuration is complete, you can review your selections and select Activate to formally launch Viva Topics for your organization. It might take a couple days for the AI to start suggesting topic pages, so hang tight. In the meantime, try manually creating a couple pages yourself, which you can start doing immediately.

The Microsoft Mechanics video on Viva Topics has even more technical details on the module, so scroll back to the top and check it out. This is Part Two of our Microsoft Mechanics video series about Microsoft Viva. Keep visiting this site or aka.ms/VivaMechanics for the rest of the series. If you’d like more information on Viva in the meantime, head over to aka.ms/Viva.
As always, we want to hear from you! If you have any suggestions, questions, or comments, please visit us on our Microsoft Viva Tech Community page. We will also be hosting our first Microsoft Viva Ask Microsoft Anything (AMA) event on June 23, 2021. There will be more information on that event soon.
Learn more:
by Contributed | May 17, 2021 | Technology
This article is contributed. See the original author and article here.
Azure Resource Graph is an extremely powerful extension to Azure Resource Management that provides efficient resource exploration at scale. It supports both Azure Lighthouse as well as cross subscription querying. It also provides the ability to do complex filtering and grouping. It can do this because it uses a subset of the Kusto Query Language.
Access
To use Azure Resource Graph successfully, you’ll need read access to any subscription and resource(s) that you wish to query. If you do not have read access to a resource or subscription they will not appear in your resulting data sets.
Queries can be run against the Azure Resource Graph API, with PowerShell, or in the Azure portal. This post will use the Azure portal for its examples.
Resource Types
There are a number of tables you can query in Azure Resource Graph. The most common table is the “resources” table. This is where all resources in your Azure subscriptions will live. With few exceptions everything in Azure is a resource. Notably Azure Sentinel and Azure Security Center are not resources, they are solutions that sit on top of a Log Analytics workspace.
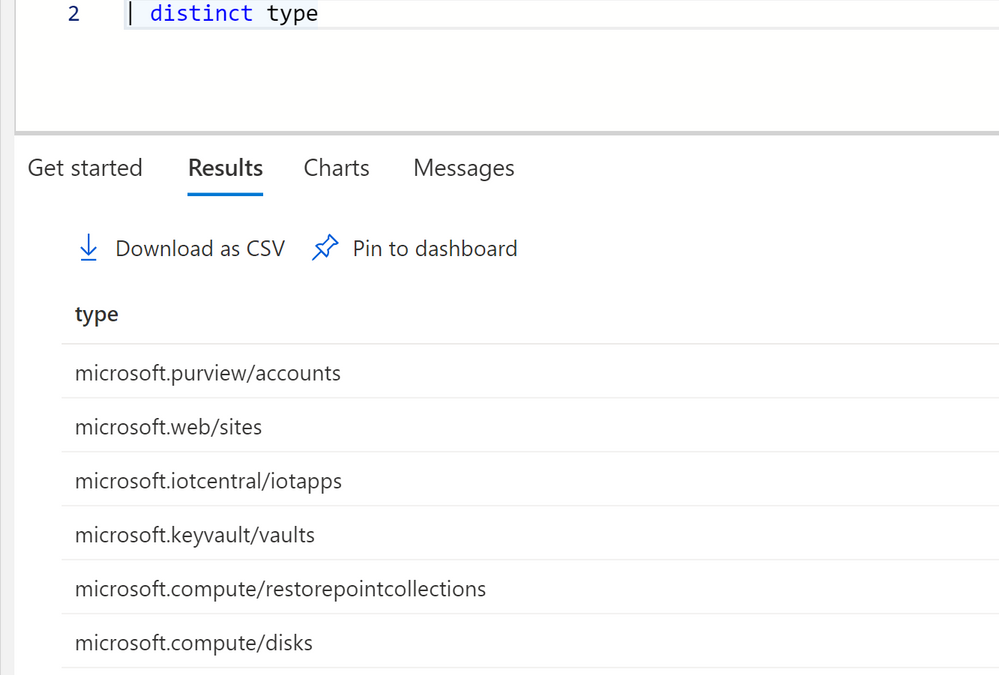
To get a idea of all the different types of resources in your subscriptions you can run the following query.
resources
| distinct type

You can get a count of all resources by using summarize.
resources
| summarize count() by type

To query a specific resource type, like virtual machines, you can use a where clause with type.
resources
| where type =~ 'microsoft.compute/virtualmachines'

One thing to note on resource types, sometimes types do not match their current name in Azure. For instance Log Analytics resource type is “OperationalInsights/workspaces.” This is because Azure resources are renamed over time but their type cannot necessarily be renamed in Azure.
You can turn on formatted results to see a proper translation of resource types to their current Azure names.

Dynamic Types
Dynamic types in Kusto are fields that have multiple values or properties under it. In Azure Resource Graph there are multiple fields, and most commonly the properties field that have multiple values and even nested JSON underneath it. These values have a ton of useful information about your Azure resources in them. But you’ll need to know how to access the information. There are several ways to access information depending on how the information is formatted.
One of the fields that has useful information nested inside it is the Sku field, some resources have the sku type and tier of the Azure service in this field, while others have it under properties.

Whenever you see curly braces in Azure Resource Graph that means that there are multiple values in that field.
To access information underneath it we can use dot notation.
resources
| where type =~ 'microsoft.containerservice/managedclusters'
| extend Sku = sku.name
| project id, Sku

You can click on see details on the right hand side to see all the fields and if they have any nested values. In this case we’re looking at VM properties and its hardware profile size. We can get this information again with dot notation.
We can use dot notation to extract our VMs hardware profile size.
resources
| where type =~ 'microsoft.compute/virtualmachines'
| extend Size = properties.hardwareProfile.vmSize
| project id, Size

Advanced Dynamic Types
Dot notation works really well for a number of properties. We can go as many levels deep as we want with dot notation, until we run into brackets inside our nested field. See here on the network interface, the nic’s ID is inside brackets. This is because we can have more than one nic to one VM.

While technically dot notation would still work by using [0] in reference to the object in an array, its not dynamic. Meaning if we don’t necessarily know if we have 2 objects or 20 in the array. We’ll want to use mv-expand for these types of data.
resources
| where type =~ 'microsoft.compute/virtualmachines'
| extend Size = properties.hardwareProfile.vmSize
| mv-expand NicID = properties.networkProfile.networkInterfaces
| project id, Size, NicID

Notice we now have curly braces around our NicID, we can now use dot notation if we want to make this information its own field.
resources
| where type =~ 'microsoft.compute/virtualmachines'
| extend Size = properties.hardwareProfile.vmSize
| mv-expand NicID = properties.networkProfile.networkInterfaces
| project id, Size, NicID = NicID.id

Practical Examples
Now that we know some of the ins and outs, lets apply that knowledge to practical examples you can use in your environment.
Summary count of VMs by Size
Resources
| where type == "microsoft.compute/virtualmachines"
| summarize Count=count() by vmSize=tostring(properties.hardwareProfile.vmSize)

Summary count of VMs by their current state
Resources
| where type == "microsoft.compute/virtualmachines"
| extend vmState = tostring(properties.extended.instanceView.powerState.displayStatus)
| extend vmState = iif(isempty(vmState), "VM State Unknown", (vmState))
| summarize count() by vmState

Because almost everything in Azure is an Azure resource, VMs have a VM object, as well as disk and NIC objects, each of which are separate Azure resources. One VM can have multiple disks and NICs. If we want to display VM’s with their corresponding NICs and Disks we have to use Joins as well as our dot notation and mv-expand to get pertinent information.
resources
| where type == "microsoft.compute/virtualmachines"
| extend osDiskId= tolower(properties.storageProfile.osDisk.managedDisk.id)
    | join(
        resources
        | where type =~ 'microsoft.compute/disks'
        | where properties !has 'Unattached'
        | where properties has 'osType'
        | project OS = tostring(properties.osType), osSku = tostring(sku.name), osDiskSizeGB = toint(properties.diskSizeGB), osDiskId=tolower(id))
	on osDiskId
| extend nics=array_length(properties.networkProfile.networkInterfaces)
| mv-expand nic=properties.networkProfile.networkInterfaces
| where nics == 1 or nic.properties.primary =~ 'true' or isempty(nic)
| extend vmId = id, vmName = name, vmSize=tolower(properties.hardwareProfile.vmSize), nicId = tostring(nic.id)
    | join kind=leftouter (
        resources
        | where type =~ 'microsoft.network/networkinterfaces'
        | extend ipConfigsCount=array_length(properties.ipConfigurations)
        | mv-expand ipconfig=properties.ipConfigurations
        | where ipConfigsCount == 1 or ipconfig.properties.primary =~ 'true'
        | project nicId = id, privateIP= tostring(ipconfig.properties.privateIPAddress), publicIpId = tolower(ipconfig.properties.publicIPAddress.id), subscriptionId)
    on nicId
| project id, resourceGroup, OS, osSku, osDiskSizeGB, vmSize, privateIP, publicIpId, nicId, properties
Notes about this query: 1, we want to use tolower() which simultaneously makes the value a string, it makes it all lower case as well. This is useful when doing joins as KQL cannot join dynamic types, and will not see the resource IDs as the same if one if camel case and one is lowercase, as KQL is case sensitive. 2, we use left outer joins because a VM can have a public IP but it can also not have a public IP.

I have included many examples for different resource types on my github repo.
Summary
Azure Resource Graph is extremely powerful for exploring your resources, creating your own inventory dashboard, and more. Many new tables have been added since Azure Resource Graph’s inception. Including the ability to query Azure Monitor Alerts, security scores from Azure Security Center and more.


Recent Comments