by Contributed | May 24, 2021 | Technology
This article is contributed. See the original author and article here.
Learn. Connect. Code. That’s Microsoft Build!
But if your role is less “developer” and more “IT Pro”, you’ll be pleased to know you can catch a glimpse of some of our Modern Infrastructure team participating in Microsoft Build, May 25-27 2021. Click on the title to find out the session date and time in your local timezone, and add it to your schedule builder if you’ve signed in.
Not registered yet? Head over to the event page and click Register Now: https://mybuild.microsoft.com/home
If you can’t make a session, you’ll get access to view the recording later, if one is made available.
Ask the Expert: Microsoft Certifications – Orin Thomas
Get your Microsoft Certification questions answered by our panel of experts. We’ll cover available Microsoft Certification exams, how to keep your skills and certifications current, and tips and tricks on how to best leverage your certification.
Hybrid is here to stay – Pierre Roman
Cloud adoption is growing, but the cloud is more than just public cloud. Convergence with on-premise is a reality for most environments, and now with Azure Arc improvements this opens up new opportunities and this Table Topic is the place to talk about them. Unmute yourself, turn your camera on – No presentations here! Be prepared for chat and a fun interactive discussion! This session will not be recorded.
Mark Russinovich on Azure innovation and more! – Rick Claus
Join Rick and Mark in a conversation discussing Azure innovation, cloud native programming models, and other exciting technology.
You’ll also find Rick hosting Microsoft Build in the late night USA/daytime Europe time slot on the main screen player, Orin making a special guest appearance on an upcoming Hello World episode on Learn TV, and some of the team may pop up as chat moderators in your sessions!
Enjoy Microsoft Build this week and let us know – what caught your eye for IT Pros at this event?

by Contributed | May 24, 2021 | Technology
This article is contributed. See the original author and article here.
Guest Blog by Ken Birman, N. Rama Rao Professor of Computer Science, Cornell University

At Cornell University, we have a long history in the area of “cloud computing” – dating back to before the subject even had that name!
I’m Ken Birman, and I’ve been involved in distributed computing and scalability from the early days. Back in the 1990’s, I created the first widely impactful software for fault-tolerant, scalable, consistent computing and data management, and my work was used very broadly. Even now, if you fly into Europe there is a good chance that the air traffic control system guiding your plane uses an architecture (and software) I created. For a decade my software ran the New York Stock Exchange and Swiss Stock Exchange without a single unmanaged fault – the code was designed to self-heal – and quite a few companies (including Microsoft) use my technology in their data-center management layers.
My students did well too: Ranveer Chandra is Microsoft’s Chief Scientist for Azure Global (and also the lead researcher for networking, and for IoT computing on smart farms). Werner Vogels is CTO at Amazon, and Dahlia Malkhi leads in the development of Facebook’s Diem digital currency.
So, it seemed natural to create a graduate course on cloud computing, to educate the next generation of developers, entrepreneurs, and leaders. When planning CS5412, “Topics in Cloud Computing”, I knew that hands-on experience would be key, and was fortunate to be offered tremendous support by Microsoft’s academic liaison group, along with Azure computing resources for our class projects. At the same time, I wanted to give the students a focus and concrete scenarios, which led me to partner with Cornell’s ANSC 3510, a course focused on technology in dairy farming. Working with Professor Julio Giordano, who created that course, we’ve created a unique structure in which two completely different classes are able to team up (using Microsoft Teams, of course!) to jointly create projects that demonstrate the power of cutting edge IoT infrastructures backed by Azure cloud ML and AI.

A few examples will help set the context (all the student groups define individualized projects, so these are really two of many). When cows enter a dairy to be milked, a procession of as many as 500 animals will move from outside in the field into the milking area of the barn through a series of side-by-side corridors. By installing cameras, we can photograph the animals as they pass through. With cloud computing tools, my students are able to identify the animal (RFID tags should make this easy, but in fact they often fall off or are difficult to ping in crowded settings), assess the health of each animal, decide if the cow needs to be routed into the “cow wash” before milking etc. One project looks at this specific question, hosting the solution on Azure IoT Edge.

A second project focused on building a highly flexible dairy dashboard for the farmer, tracking a variety of milk quality, quantity and safety properties while also providing an integrated perspective on the herd as a whole, dairy product price trends, and even allowing the farmer to zoom in and look at health statistics for individual animals. Automated notifications alert the farmer if a cow is close to calving or needs to see a vet for some other reason. Yet a third project looks at integrating data from diverse sources, such as weather predictions, farm-soil moisture levels and imaging to predict risk factors such as outbreaks of pathogens. A farmer warned of trouble three weeks from now might have time to bring the crop in a little early, before the pathogen gains a toehold.

What I find exciting about these projects is that they bring my cloud computing students into real-world settings. In teams of two or three, students from my cloud computing class partner with Professor Giordano’s students to understand the kinds of data available and to appreciate the proper way to approach technical questions seen on dairy farms. They work together to map these questions to ML, decide how to train the models, and even collaborate to design dashboards that visualize the outcomes of the analysis. Meanwhile, Professor Giordano’s animal science students, who come to these partnerships with a lot of knowledge about modern dairies and modern AI, learn about the challenges of putting those tools to work to create useful new technology, and are exposed to the power (and limitations) of the Azure cloud. As a side-effect, by working with Microsoft Teams, the groups also become comfortable with cutting-edge collaboration technology.
My approach in CS5412 has been to design to the course around three central goals. First, I do want my students to appreciate the relevant computer science foundations: topics such as state machine replication (Paxos), leader election, and fault-tolerant consensus. Second, it is important for them to learn to view the cloud as a platform with powerful, inherently scalable services such as CosmosDB, the Azure Blob Store and Azure Data Lake at their disposal, along with powerful computing frameworks like the Azure Intelligence Platform and Cognitive Search. These in turn center on fundamental practical questions, such as understanding data and computation sharding for scalability, and appreciating the roles of the IoT Hub and its integration with Azure Functions.
Last is the practical goal of becoming proficient with the actual tools: Any student who “survives” my course emerges as a capable cloud programmer with a valuable skill set coupled to an understand of how the Azure documentation and prebuilt “recipes” can lead to customizable code frameworks ideally fitted to their needs.
It has taken us many years to evolve CS5412 to the current state, but today I feel as if my students really learn the right material, that the partnership with Animal Sciences is operating smoothly and bringing really high value to the table, and that the course is simply working very well. My textbook, written in 2010, probably needs a thorough revision at this point, but on the other hand, modern students don’t really read textbooks! What they do read is online material, especially coupled with “how-to” videos and even hands-on opportunities, and on this, Microsoft has excelled.
The documentation available is outstanding, but beyond that, Microsoft has participated in Cornell’s Digital Agriculture Hackathons (the CIDA Hackathon), and my students find this to be a fantastic resource. During a February weekend students come together to learn how cloud computing can solve problems in agriculture, looking at technical but also social and economic/business perspectives, with hands-on instruction by Microsoft experts.
CS5412 has become a real treasure here at Cornell, and is helping position our students to hit the ground running as they enter the workforce. We couldn’t have done it without Microsoft Azure and Microsoft Teams, and are tremendously grateful for the partnership opportunity!
by Contributed | May 24, 2021 | Technology
This article is contributed. See the original author and article here.
Accelerated computing. Microsoft HPC continues to invest to deliver the broadest range of Accelerated and high-performance computing (HPC) capabilities in the public cloud. From InfiniBand-enabled Virtual Machine families for artificial intelligence and HPC, to Hyperscale services like Cray supercomputing, Azure enables customers to deliver the full spectrum of AI and machine learning applications.
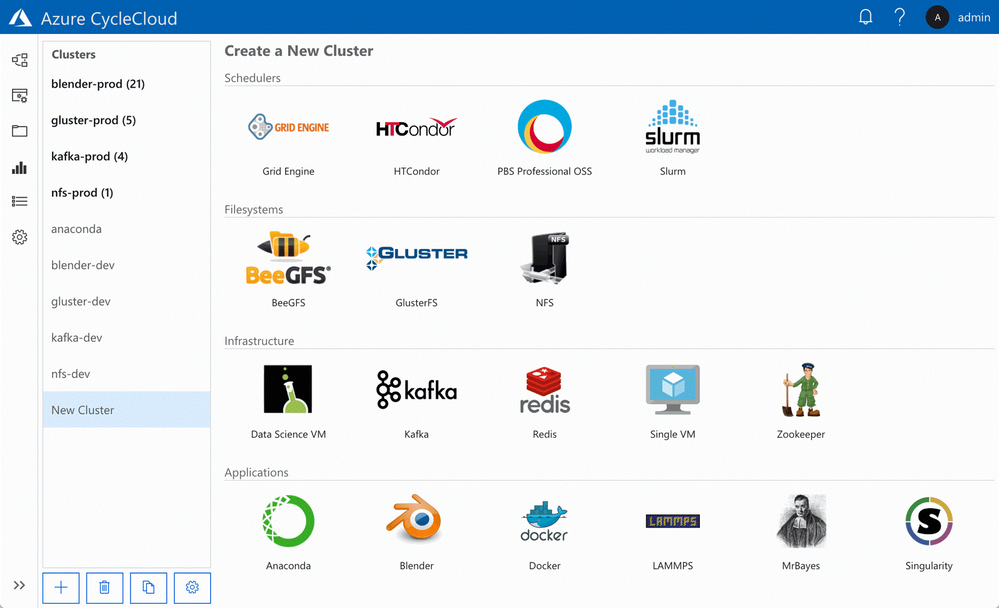
Azure CycleCloud – the simplest way to execute HPC on Azure
Azure CycleCloud, a tool for creating, managing, operating, and optimizing HPC clusters of any scale in Azure. With Azure CycleCloud, we are making it even easier for everyone to deploy, use, and optimize HPC burst, hybrid, or cloud-only clusters. For users running traditional HPC clusters, using schedulers including SLURM, PBS Pro, Grid Engine, LSF, HPC Pack, or HTCondor, this will be the easiest way to get clusters up and running in the cloud, and manage the compute/data workflows, user access, and costs for their HPC workloads over time.
With a few clicks, HPC IT administrators can deploy high-performance clusters of compute, storage, filesystem, and application capability in Azure. Azure CycleCloud’s role-based policies and governance features make it easy for their organizations to deliver the hybrid compute power where needed while avoiding runaway costs. Users can rely on Azure CycleCloud to orchestrate their job and data workflows across these clusters.
NVIDIA GPU Cloud with Azure
As GPUs provide outstanding performance for AI and HPC, Microsoft Azure provides a variety of virtual machines enabled with NVIDIA GPUs. Starting today, Azure users and cloud developers have a new way to accelerate their AI and HPC workflows with powerful GPU-optimized software that takes full advantage of supported NVIDIA GPUs on Azure.
Containers from the NVIDIA GPU Cloud (NGC) container registry are now supported. The NGC container registry includes NVIDIA tuned, tested, and certified containers for deep learning software such as Microsoft Cognitive Toolkit, TensorFlow, PyTorch, and NVIDIA TensorRT. Through extensive integration and testing, NVIDIA creates an optimal software stack for each framework – including required operating system patches, NVIDIA deep learning libraries, and the NVIDIA CUDA Toolkit – to allow the containers to take full advantage of NVIDIA GPUs. The deep learning containers from NGC are refreshed monthly with the latest software and component updates.
NGC also provides fully tested, GPU-accelerated applications and visualization tools for HPC, such as NAMD, GROMACS, LAMMPS, ParaView, and VMD. These containers simplify deployment and get you up and running quickly with the latest features.
To make it easy to use NGC containers with Azure, a new image called NVIDIA GPU Cloud Image for Deep Learning and HPC is available on Azure Marketplace. This image provides a pre-configured environment for using containers from NGC on Azure. Containers from NGC on Azure NCv2, NCv3, and ND virtual machines can also be run with Azure Batch AI by following these GitHub instructions.To access NGC containers from this image, simply signup for a free account and then pull the containers into your Azure instance.
Resources on Microsoft Learn

by Contributed | May 24, 2021 | Technology
This article is contributed. See the original author and article here.
Goran Vuksic
Goran works as a Technical manager for Stratiteq Sweden, he is Microsoft AI MVP, he has 15 years of work experience in IT and wide knowledge about various technologies and programming languages. He worked on various projects for notable clients and projects he worked on have been featured many times on web sites like Forbes, The Next Web, NVIDIA Developer, TechCrunch, Macworld and others. In the last few years, he attended several hackathons and other competitions on which his skills and work were recognized and awarded. Goran is tech enthusiast, he writes technical blog posts and he likes to share his wide knowledge on different workshops and talks. You can connect with Goran on LinkedIn and follow him on Twitter.
Introduction
Azure Percept is an easy-to-use platform for creating edge AI solutions. Azure Percept Development Kit comes with an intelligent camera Azure Percept Vision. Services like Azure Cognitive Services, Azure Machine Learning, Azure Live Video Analytics, and many other works out of the box with Azure Percept. With the development kit you can set up proof of concepts in minutes, and integrate it with Azure AI and Azure IoT services. Overview of Azure Percept Development Kit can be found here, and on same link you can also find links how to set up your device.

This post will show you how to create a simple project with Azure Percept Development Kit. I will use Tweety and Sylvester LEGO minifigures from Looney Tunes special edition. Idea is to train an AI model to be able to recognise Tweety and Sylvester, and find them amongst other LEGO minifigures. With a model that is able to tell where Tweety and Sylvester are we could keep Tweety safe, gor obvious reasons that Sylvester is always hungry and he should not be anywhere close to Tweety.
Azure Percept Studio
Azure Percept Studio makes it really easy to work with your Azure Percept, and it is the single launch point for creating edge AI models and solutions you want to develop.

Interface will guide you in an intuitive way no matter if you are new to AI models and want to create a prototype, try out some sample applications or try out more advanced tools.

In left menu you can click on option “Devices” and overview of your Percept devices will appear. For each device you can see status is it connected, and you can click on it to view details. We will use second tab “Vision” for this project where you can capture images for your project, view device stream and deploy a custom model to the device.

Training the model
We want to create a custom model that will be able to recognise Tweety and Sylvester. You can open Custom Vision in a new tab, log in and create a new project. Give a name to your project, create a resource, select “Object detection” and “General” domain. Custom Vision project domains are explained here in more detail.

Images can also be added to the project from Azure Percept Studio, with option we have seen recently. If you are using that option you will be able to take pictures with Azure Percept Vision camera. You can also add and use any image that you prepared earlier.

Once images are added, you need to tag them marking the objects your model will recognise. In this example I create two tags named “Sylvester” and “Tweety”. Minimum number of images you should add to train the model is 15, but for an AI model to actually be able to recognise objects like this you should add much more images.

After you tagged the images select “Train” to train the model and you can choose option “Quick training”. In minute or two your model will be ready and you can go back to the Azure Percept Studio.
Testing the model
In Azure Percept Studio click option “Deploy a Custom Vision project” and select the model you just trained. You can also select specific model iteration if you trained the model several times.

Once the model is deployed, you can click “View your device stream” to see live camera feed and test the model. Notification will appear in a few seconds when your stream is ready and you can open it in a separate tab.

Testing a model with a live stream is a great way to see how it actually performs, you can add different objects, position the camera in different angles and get a real idea of the performance. If your model does not have high enough accuracy or it false detects other objects, you can take more pictures, add them to Custom Vision, re-train the model and test new iteration to see how it works.
Summary
Through this article you have learned about Azure Percept Studio, how to train your Custom Vision model, how to deploy it to the Azure Percept device and test it via live stream. Now that you learned more about Azure you can claim your Azure Heroes Learner badge by scanning QR code on the following link (please note there are only 50 badges available).
Resources
Microsoft Learn Modules on Custom Vision AI
Explore computer vision in Microsoft Azure – Learn | Microsoft Docs
Analyze images with the Computer Vision service – Learn | Microsoft Docs
Classify images with the Custom Vision service – Learn | Microsoft Docs
Detect objects in images with the Custom Vision service – Learn | Microsoft Docs
by Contributed | May 23, 2021 | Technology
This article is contributed. See the original author and article here.
Introduction
Azure Data Explorer (ADX) is commonly used to store and analyze event logs of business processes. These logs are generated everywhere – applications emit events capturing user actions, IoT devices send sensors data, cloud services generate monitoring logs etc. Once the data is stored in ADX, it can be analyzed for insights. Kusto Query Language (KQL) has extensive set of operators and functions for various types of analysis, including relational operators (filtering, joining, aggregations etc.), time series analysis (anomaly detection, forecasting etc.), advanced plugins (root cause analysis, user analytics) and even extensibility to embed external Python/R packages. Today we are delighted to introduce the scan operator, adding native process mining and temporal analytics to ADX!
Process Mining
Process mining is a new emerging domain, dealing with analysis of events logs to discover the underlying process models, validate, and potentially improve them. In that context, an event contains at least process instance id, timestamp, and action. A process instance id (a.k.a. case id) might be identifier(s) of the specific user, device, session, or any other native partitioning of the events log. A process model describes a sequence of actions, commonly with time constraints, to achieve specific task. Some examples for process models:
- Users login to a shopping web site, browse products, add to cart, check out, pay and logout.
- A patient is admitted at a clinic, tested for pulse and blood pressure by the triage team, checked by the specialist, diagnosed, and dismissed.
- A washing machine cycle: starting, weighing the laundry, filling water, heating, washing, rinsing, spinning, and finishing.
There are 3 classes of process mining techniques:
- Discovery – automatically extract process model(s) out of the raw event logs.
- Conformance checking – comparing existing process model with actual event log, detect and analyze discrepancies.
- Performance mining – enhance the existing process to improve performance – reduce time between steps, improve retention etc.
The ‘scan’ operator
The scan operator is arguably the most advanced analytics operator in ADX. It extends ADX native analytics to include process mining, user analytics, recursive calculations and more. The user defines a process model in KQL, then feeds in a huge events log table. ADX scans it and extracts the instances (each one is an events sequence) conforming to that process model, filtering those deviating from it. The model definition syntax lets the user define sequential states and forward transition rules from the first to the last state. These states and rules are translated to a set of simple state machines that define the scan logic. Let’s review a few examples to understand the syntax, as well as its power and versatility for a wide range of scenarios.
Searching for ‘rallies’ of top stocks
Here we analyze historical prices of top tech stocks from 2019 till today. This period was interesting, from start of 2020 till today the market is impacted by the Covid-19 pandemic, still the overall trend of these stocks is positive. In the query below we look for longest sequences of increasing price per each stock. The following query is built by these steps:
- Pre-processing:
- For each stock order the prices by time and calculate the daily change.
- Extracting sequences using the ‘scan’ operator:
- A sequence starts when the price increases.
- The sequence continues as long as the price increases or doesn’t change.
- The sequence ends when the price decreases.
- Post-processing:
- For each sequence delete the last event, as it contains the price decrease.
- Summarize the length and delta per sequence.
- For each stock extract the sequence with the biggest percentage increase.
TopStocksCleaned
| where Date >= datetime(2019-01-01) and Ticker in('AAPL', 'AMZN', 'GOOG', 'MSFT')
| partition by Ticker
(
    order by Date asc
    | extend pDate=prev(Date), pAdjClose=prev(AdjClose)
    | extend delta = AdjClose - pAdjClose
    | scan with_match_id=m_id declare(down:bool=false, step:string) with
    (
        //  if state of s1 is empty we require price increase, else continue as long as price doesn't decrease
        step s1: delta >= 0 and (delta > 0 or isnotnull(s1.delta)) => step = 's1';
        //   exit the 'rally' when price decrease, also forcing a single match
        step s2: delta < 0 and s2.down == false => down = true, step = 's2';
    )
)
| where step == 's1'   //  select only records with price increase
| summarize (start_date, start_AdjClose, start_delta)=arg_min(pDate, pAdjClose, delta), end_date=max(Date), trading_days=count(), total_delta=sum(delta) by Ticker, m_id
| extend delta_pct = total_delta*100.0/start_AdjClose
| summarize arg_max(delta_pct, *) by Ticker
| project Ticker, start_date, end_date, trading_days, delta_pct, start_AdjClose, total_delta
| order by delta_pct
Ticker
|
start_date
|
end_date
|
trading_days
|
delta_pct
|
start_AdjClose
|
total_delta
|
AAPL
|
2020-07-29
|
2020-08-07
|
7
|
20.752
|
93.75
|
19.455
|
AMZN
|
2020-04-13
|
2020-04-21
|
6
|
18.461
|
2040
|
376.610
|
MSFT
|
2020-02-28
|
2020-03-03
|
2
|
14.034
|
152.410
|
21.389
|
GOOG
|
2021-01-28
|
2021-02-03
|
4
|
12.422
|
1843.939
|
229.060
|
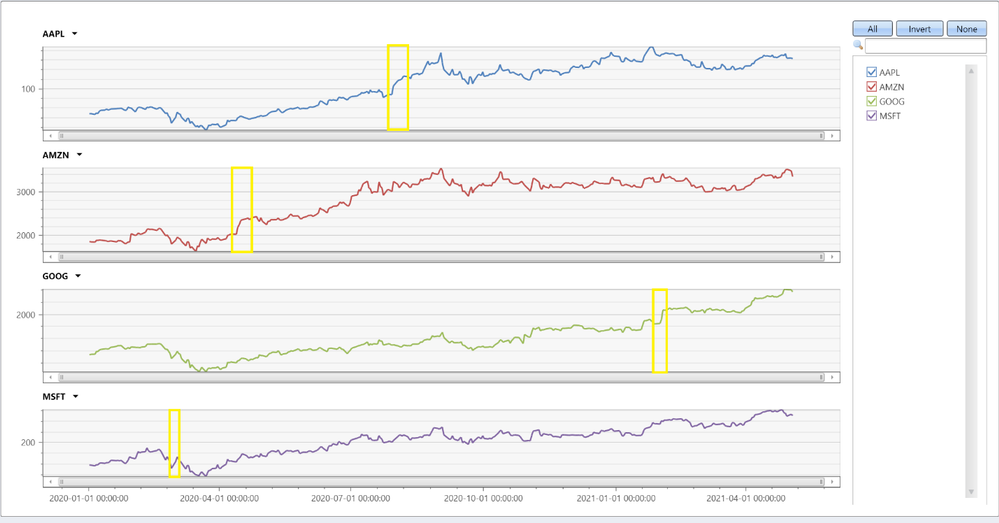
We can see that Apple had the longest and biggest rally, 7 consecutive trading days with almost 20% increase! Let’s chart all stocks:
TopStocksCleaned
| where Date >= datetime(2020-01-01) and Ticker in('AAPL', 'AMZN', 'GOOG', 'MSFT')
| project Ticker, Date, AdjClose
| evaluate pivot(Ticker, any(AdjClose))
| render timechart with(ysplit=panels)
We can nicely see the biggest increases, yellow highlighted.
Analyzing users’ mitigations for failing KQL queries
In this example we analyze sequences of users’ queries following a failed one, trying to extract interesting insights. The following query is quite complex, its steps are:
- Pre-processing:
- For each user order the queries by time.
- Filter consecutive queries with less than a second gap – these are likely automated queries.
- Extracting sequences using the ‘scan’ operator:
- Start a sequence by a query that was not completed successfully.
- Continue the sequence until successful query or time out.
- Each step updates the sequence length and the number of retries (of exactly the same query).
- Post-processing:
- Aggregate sequences by user and retries only flag.
- Final aggregation by sequences length, final state and retries flag.
let Kusteam = toscalar((KustoAll | summarize make_list(Email)));
let etime = datetime(2021-05-20);
let stime = etime - 14d;
let max_gap = 5m;           //  max time gap between user's consecutive queries to be grouped in the same sequence
let min_gap = 1s;           //  min time gap between user's consecutive queries, ignoring automated queries
//
QueryCompletion_v2
| where User in(Kusteam)
| where Timestamp between (stime..etime)
| partition hint.strategy=native by User (
    order by Timestamp asc
    | extend nTimestamp = next(Timestamp)
    | where nTimestamp - Timestamp >= min_gap   //  filter automated queries
    | scan with_match_id=m_id declare(step:string='empty', timeout:boolean=false, retries:long=0, SequenceLen:long=0) with
    (
        step s1: State != 'Completed' => step = 'not completed', SequenceLen = s1.SequenceLen + 1, retries = s1.retries + iff(s1.Text == Text, 1, 0);
        step s2: s2.step == 'empty' and (State == 'Completed' or Timestamp - s1.Timestamp >= max_gap) =>
                 step = 'end', timeout = Timestamp - s1.Timestamp >= max_gap, SequenceLen = s1.SequenceLen + 1, retries = s1.retries + iff(s1.Text == Text, 1, 0);
    )
)
| where not(timeout) // these records are not related to the past sequence
| extend RetriesOnly = (retries == SequenceLen - 1), FinalState = State
| summarize arg_max(SequenceLen, FinalState) by User, m_id, RetriesOnly
| summarize SequenceNum = count() by SequenceLen, FinalState, RetriesOnly
| where SequenceLen > 1 and FinalState != 'Cancelled'
| order by FinalState asc, SequenceLen asc, RetriesOnly asc
Results:
SequenceLen
|
FinalState
|
RetriesOnly
|
SequenceNum
|
2
|
Completed
|
False
|
306
|
2
|
Completed
|
True
|
20
|
3
|
Completed
|
False
|
66
|
3
|
Completed
|
True
|
2
|
4
|
Completed
|
False
|
25
|
4
|
Completed
|
True
|
1
|
5
|
Completed
|
False
|
11
|
6
|
Completed
|
False
|
4
|
2
|
Failed
|
False
|
8
|
2
|
Failed
|
True
|
20
|
3
|
Failed
|
False
|
2
|
3
|
Failed
|
True
|
7
|
4
|
Failed
|
False
|
2
|
4
|
Failed
|
True
|
1
|
5
|
Failed
|
False
|
2
|
5
|
Failed
|
True
|
32
|
6
|
Failed
|
False
|
13
|
7
|
Failed
|
False
|
3
|
11
|
Failed
|
False
|
1
|
Let’s first look on sequences of 2 events, i.e. a failed query followed by a successful one or a time out. These sequences account for 354/526=67% of all sequences. We can see that 326/526=62% of the failures were resolved by a single follow-up query. Out of these, 306/326=94% queries completed successfully after modifying the query, while only 20/326=6% completed just by retrying the same query. Looking on sequences of 3 events, additional 68/526=12.9% of the failed queries were resolved, but retrying the same query twice is much less effective: only 2/68=2.9% succeeded. The last thing to note is that as the sequences become longer, the chance of successful completion decreases, only a few sequences of 6 queries end successfully, longer ones just continued to fail, until the users abandoned them.
Summary
In this short blog we have seen only 2 examples of ‘scan’, however the scope and power of this operator is far beyond these specific use cases. This operator is very effective for various scenarios, from simple fill forward table columns or calculating cumulative sums, through analyzing events preceding some failure for root cause analysis, and up to funnel analysis, rectifying obstacles in UX workflows, improving performance and beyond. Have a look at scan doc, where you can learn how to use it and review more interesting examples. Note that the scan operator is new, currently in preview, still you are very welcome to try it and share your feedback with us!

Recent Comments