by Contributed | Jun 1, 2021 | Technology
This article is contributed. See the original author and article here.
Labeled data is critical to training supervised learning models. Higher volumes and more accurate labeled data contribute to more accurate models but labeling data has traditionally been time-intensive and error-prone.
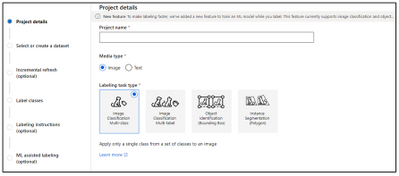
With Data Labeling in Azure Machine Learning, you now have a central place to create, manage, and monitor labeling projects. You can now manage data labeling projects seamlessly from within the studio web experience to generate and manage tasks reducing the back-and-forth of labelling data offline. With AML Data Labeling, you can load and label data and be ready to train in minutes.
To increase productivity and decrease costs for a given task, the Assisted Machine Learning labeling feature allows you to leverage automatic machine learning models to accelerate labeling by clustering like objectives and automatically prelabeling data when the underlying model has reached high confidence. This feature is available for image classification (multi-class or multi-label) and Object detection tasks, in Enterprise edition workspaces.
Data Labeling in Azure Machine learning now includes below capabilities:
Image Classification Multi-Class
This project type helps you to categorize an image when you want to apply only a single class from a set of classes to an image.

Image Classification Multi-label
This project type allows you to categorize an image when you want to apply one or more labels from a set of classes to an image. For instance, a photo of a dog might be labeled with both dog and land.

Object Identification (Bounding Box)
Use this project type when you want to assign a class and a bounding box to each object within an image. If your project is of type “Object Identification (Bounding Boxes),” you’ll specify one or more bounding boxes in the image and apply a tag to each box. Images can have multiple bounding boxes, each with a single tag.

Instance Segmentation (Polygon)
Use this project type when you want to assign a class and a polygon to each object within an image. If your project is of type “Instance Segmentation (Polygons),” you’ll specify one or more polygons in the image and apply a tag to each object . Images can have multiple polygons, each with a single tag.

Assisted machine learning
The machine assisted labeling lets you trigger automatic machine learning models to accelerate the labeling task. At the beginning of your labeling project, the images are shuffled into a random order to reduce potential bias. However, any biases that are present in the dataset will be reflected in the trained model. For example, if 80% of your images are of a single class, then approximately 80% of the data used to train the model will be of that class. This training does not include active learning.
Enabling ML assisted labeling consists of two phases:
The exact number of labeled images necessary to start assisted labeling is not a fixed number. This can vary significantly from one labeling project to another. ML Assisted Labeling uses a technique called Transfer Learning, and the pre-labeling will be triggered when sufficient confidence is achieved which varies based on the dataset.
Since the final labels still rely on input from the labeler, this technology is sometimes called human in the loop labeling.
Clustering
After a certain number of labels are submitted manually, the machine learning model for image classification starts to group together similar images. These similar images are presented to the labelers on the same screen to speed up manual tagging. Clustering is especially useful when the labeler is viewing a grid of 4, 6, or 9 images.
The clustering phase does not appear for object detection models.
Prelabeling
After enough image labels are submitted, a classification model is used to predict image tags. Or an object detection model is used to predict bounding boxes. The labeler now sees pages that contain predicted labels already present on each image. For object detection, predicted boxes are also shown. Accuracy will vary depending images, labels, the domain, and other factors. With Pre-Labeling, you can review the predictions before committing the labels.
Once a machine learning model has been trained on your manually labeled data, the model is evaluated on a test set of manually labeled images to determine its accuracy at a variety of different confidence thresholds. This evaluation process is used to determine a confidence threshold above which the model is accurate enough to show pre-labels. The model is then evaluated against unlabeled data. Images with predictions more confident than this threshold are used for pre-labeling.
Resources
Learn more about the Azure Machine Learning service.
Get started with a free trial of the Azure Machine Learning service.
by Contributed | Jun 1, 2021 | Technology
This article is contributed. See the original author and article here.
New Features:
- Import Project desktop to Project for the web: This feature is rolling out now! Import your .mpp files to Project for the web through Project home.
- Collaboration Corner Presence: See who else is viewing your project in real time when you’re editing a project on Project for the web.
- Filtering on the Board & Timeline views: Find your tasks quickly in Board and Timeline by filtering by keyword or assignee. This is rolling out now and should be available to all users by the middle of June.
- Scheduling modes: Project Admins can now change the default scheduling mode of your projects. Users in Named environments can change the scheduling mode of specific projects to match their scheduling needs.
- Project Language Settings: Set your Project language directly by opening Settings and clicking on Change your language.
Upcoming Features:
- Dropdown types in Custom Fields: Add custom fields with drop down options so you can control the information added to those custom fields on your tasks.
- Rollup Custom Fields: Add summary, average, max, or minimum calculations to your numeric custom fields. See the rollup value of all your subtasks in your summary task field.
Licensing Updates
In Project Plan 1, Project for the web has had some recent updates to its licensing. You can learn more about the licensing updates in our blog post here.
Microsoft Project Trivia!
Last Month:
- Question: Users with Project Plan 3 or 5 can create roadmaps including all their project information. What year did Roadmap in Microsoft Project first become available to users?
- Answer: Microsoft Project released Roadmap in 2018. It has been almost three years since this product has been available to users; what is your favorite part of Roadmap?
This Month:
- Question: In project management, milestones often represent significant events that happen during the project process. How can you create milestones in Project for the web?
by Contributed | Jun 1, 2021 | Technology
This article is contributed. See the original author and article here.
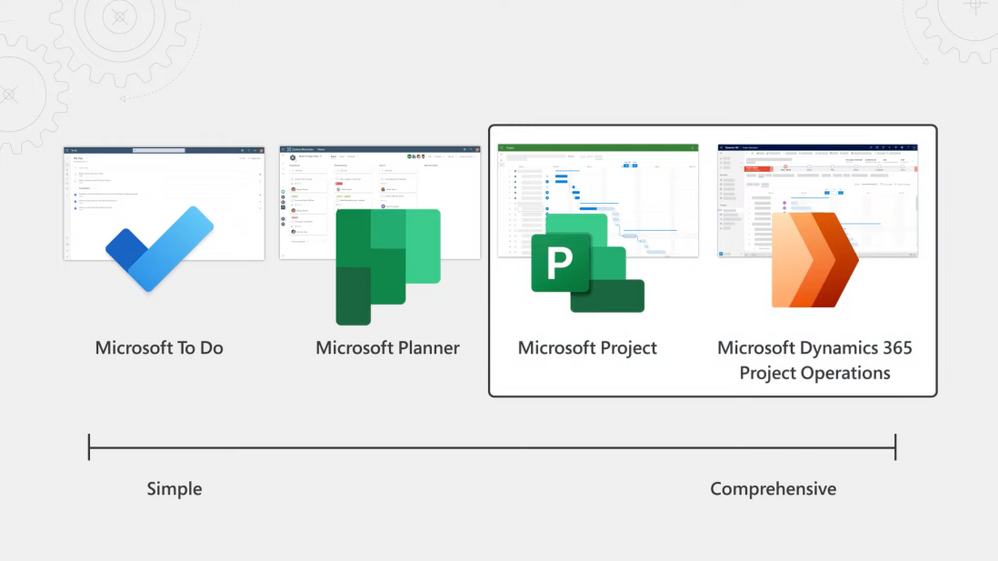
Take a look at new project management options from Microsoft, and how they meet your project needs. From integrated experiences with Microsoft Teams using Project for the web, all the way to Project Operations in Dynamics 365 to support the delivery of project-based services with seamless integration into your ERP system, and manage all phases of your projects.
We’ve set out to take our mature project management engine with Microsoft Project, and make project management more accessible to everyone in your organization. George Bullock, joins host Jeremy Chapman, to share project management options for sophisticated projects.
Project for the web
Now use it within the context of Microsoft Teams. Easy to create and manage projects — see completed tasks, track progress, and modify details. Contacts are in Teams, natively, right in your directory service.
Dynamics 365 Project Operations
Project for the web capabilities are embedded within, so core project planning and resource management is the same. Expanded set of capabilities across sales management and project accounting. Easily manage your entire project life cycle, from planning to billing and finance.
QUICK LINKS:
02:32 — Project for the web in Teams
04:30 — How to manage a more sophisticated project
06:06 — Project Operations in Dynamics 365
08:46 — Billing capabilities
09:33 — Finance capabilities
09:59 — Set up: Project for the web
10:47 — Set up: Project Operations
11:27 — Wrap up
Link References:
For more on how to set up Project for the web, go to https://aka.ms/ProjectMechanics
Request a trial for Dynamics 365 Project Operations at https://aka.ms/ProjectOperationsTrial
Get a Project trial at aka.ms/TryProjectNow
Unfamiliar with Microsoft Mechanics?
We are Microsoft’s official video series for IT. You can watch and share valuable content and demos of current and upcoming tech from the people who build it at Microsoft.
Keep getting this insider knowledge, join us on social:
Video Transcript:
– Up next, we look at project management options from Microsoft and how they meet your project needs, from integrated experiences with Microsoft Teams using Project for the web all the way to Dynamics 365’s Project Operations to support the delivery of project-based services with seamless integration into your ERP system to manage all phases of your projects from bidding to billing. So, George, it’s great to have you on.
– Well, thanks for having me.
– And thanks so much for joining us from home today. So one of the most popular topics for Microsoft Mechanics has always been around project management. So Microsoft has this really long history of building tools that span from task management and planning, formal project management, and even business operations. And today though, we wanted to focus more on that sophisticated end of the spectrum. So what’s new there?
– Well, we’ve really focused on making it easier for everyone to manage their work. And if you think about it, most of us are involved in projects every day. They can range from single initiatives that you may be collaborating on with your team, such as this video, actually. Or they can span an entire portfolio of interrelated initiatives and business processes across your organization. And also, there are project-based services that might be a primary driver for your business, especially if you’re in a business like consulting, where you’re managing everything from sales to running the project, as well as post-project billing and analytics.
– Right, and really the more accountability and dependencies involved, the more rigor that you need to be able to follow those projects through.
– Yeah, that’s exactly right. And we’ve set out to take our mature project management engine with Microsoft Project, and make the whole discipline of project management way more accessible to everyone in your organization. For example, Project for the web has been around for a couple of years now and can be used as your go-to tool if project management is your whole job focus. The good news is as an everyday user, you can also now use it within the context of Microsoft Teams. Project for the web and its rich scheduling and task management capabilities are also embedded in Dynamics 365 Project Operations. And by the way, this is the evolution of Dynamics 365 Project Service Automation. It gives you an expanded set of capabilities across sales management and project accounting for Project Operations and starts with sales and quotes, and goes through to planning and running the project and all the way to things like expenses, invoices, and analytics.
– Right, and there’s also good news for IT that it’s built on top of the Power Platform. So you’ve had to deploy things like project servers in the past, all that pain’s going to go away and we’re covering both ends of the spectrum there then for work management. But can you give us a look of all the new tools?
– Sure. I’ll start with Project for the web in Microsoft Teams to show you how easy it is to create and manage projects. The first thing I’m going to do here is hit the plus sign to add a tab and I’ll add project. And you see now when I click into project I can either add an existing project to my team, or I can create a new one. I’ll go ahead and create a new one and give it a name, Marketing Plan, and click Save. And now this project is being attached to our channel and everyone on the team will be able to see it with access to the project. From here, we can start adding tasks. So I’ll add a few for email campaign, audience profile and storyboard. And from here I can also create a work breakdown structure. And in this case tasks 2 and 3, we’ll make those subtasks to our email campaign. And now I can begin assigning people; I’ll assign Adele for now.
– Right, and this is really a big deal because in the past, you’d have to manage another contact list of people that were defined as project resources, and now they’re just there natively in your directory service.
– That’s right, it’s a huge time saver for sure. Also the cool thing is if there’s someone that needs to be on this project that’s in our tenant, but not yet a member of this actual team, I can search for them. So here I’ll search for Brian Johnson and add him to the project. And I can also choose to add him to the team in Microsoft Teams, so he has the full experience including associated chat and files. And so now I have everyone in and I can lay out the project schedule. And you’ll notice there’s a Duration column here by default. So I’ll assign each task the number of days required. I’ll add start and finish date columns, and you can see the project uses today’s date as the default start date. Then behind the scenes, the scheduling engine will automatically calculate the finish date for each task. And now from here, I can add additional fields, including custom fields. And as I add a column, I can choose the data type. In this case I’ll choose Yes/No, and I’ll give this field the name Legal Review and hit Create. And now I can assign yes or no to each of my tasks. And that’s how easy it is to set up your project.
– Okay, but I have to say that was a pretty simple project, but can you show us what a more sophisticated project then might look like?
– Yeah, absolutely. Here I have a project for Cafe Grande 2000, and this one’s further along. So you can easily see completed tasks with green check marks and strikethrough texts. The tasks that are behind schedule are highlighted in red and tasks due tomorrow are highlighted in beige. So I’ll mark a few of these tasks complete. Now, if you look at this one here for Identify online opportunities, you can see that it has a dependency on defined launch goals, and I can easily modify all the details of this task from here. So now I’ll close this out. And of course, one of the most visual ways to track progress and view dependencies is through the timeline. And this is a great view that shows all the project tasks, how they’re related to each other, and when they’ll be completed. If I want, I can modify each task on the timeline by sliding them to the left or right, and I can shorten or extend their duration as well. Now, if I click into any of these tasks on the left, it gives me the details behind them, as you can see with this one. So let’s close this out and go to another useful view that we have here, which is the Board view. And this lets you categorize tasks by buckets. And it’s really easy to drag tasks between buckets. So I’ll drag a few of these tasks over into their corresponding buckets. Now we get a better idea in this case of the phases each task belongs to.
– So this is going to look pretty familiar, I think, to a lot of people in project management. Even you have no prior experience, it’s going to be easy to onboard, and the different views are going to give you options then for tracking their progress. This is great for managing everyday products, but you also mentioned before how we go beyond this with Project Operations in Dynamics 365, especially if you’re selling and running project-based services, but what does that experience then look like?
– Yeah, let me show you that. And the first thing you’ll notice is that because Project for the web capabilities are embedded within Dynamics 365 Project Operations, the core project planning and resource management is the same as Project for the web. But Project Operations goes far beyond this. It comes with a suite of capabilities that can help project leads, account managers, and project accountants more easily manage the project life cycle. So starting with deal management, Project Operations has robust estimation capabilities. As you can see here, the team for this project uses generic resources, so project managers can create accurate estimates. Account managers can then take these estimates and link them directly to project quotes, helping them create far more accurate quotes for their customers. Clicking on the Sales tab now, we can easily find the link quote. Now in the Profitability Analysis tab, account managers can even use these estimates to identify the potential gross margin for the project.
– Okay, so then once you’re ready to move forward with the project, how does Project Operations help you then assign the resources to carry out all of your planning?
– Well, project leads can now use the Schedule Board to easily see who is active on other projects, and if people with the needed skillsets have available time to staff the new project. So in this view, project leads can search by role, skillset, location, and a number of other valuable filters. And for this new project, they’ll need a site foreman who has a lot of project management experience. So after searching, we can see that Peter has plenty of free time to devote to this new project in the upcoming months. Then once you’ve selected your team and the project is kicked off, you have workflows in place to simplify time and expense management. In Time Entries, project team members can quickly add their time sheets by importing their hours from their current project or by simply manually adding them in. And for Expenses, we have two options. First, team members can submit their expenses using this simple experience here. If you want more advanced capabilities like OCR for receipt capture, we have an option for that as well to save time when submitting these expenses. Project Operations also integrates ERP capabilities for things like material sourcing. So here, for example, this project team is working to refurbish and rebrand a number of cafes. They’ve identified that they need to equip these cafes with all new equipment, like new coffee machines with material usage. So I’ll go ahead and add our A100 model in this case. And they can easily make sure the expense is accounted for and eventually invoiced to the customer.
– Okay, and I know that it can also be a challenge once you move into the billing aspects of a project, so what billing capabilities then come with Project Operations?
– Yeah, so we’ve just introduced a new feature, actually, that lets project leads define whether certain tasks of a project should be complimentary or not chargeable to the customer, like a proof of concept or pre-sales activities, while the remaining tasks may require a fixed fee or time and materials billing. So for this project, we can change just the planning activities to be complimentary. And project leads can even bill multiple organizations for different sets of tasks under the same project. Now switching to the Tracking tab, project leads can use this table you see to easily track the project from both an effort and a cost standpoint, and this helps make sure the project remains under budget.
– From a project accounting perspective, are there some additional finance capabilities here as well?
– Yeah, there are. Project Operations helps accounting teams manage all the financial aspects of a project, from project costing, to invoicing and revenue recognition. With Project Statements, for example, project accountants can monitor the latest project financials and make sure the project’s on the right track. As you can see here with profit and loss and also in this tab looking at consumption.
– Okay, so this is a really great set of integrated project management capabilities across Project for the web and Project Operations, but what do they take then to get set up?
– Let’s start with Project for the web and what I showed in Teams. So once your users are licensed, it’s really easy to set up. Because first, under the covers, we’re using Microsoft Dataverse, which provides a scalable and secure managed data layer as part of the Power Platform. And we provisioned this with a default environment as part of your enterprise Microsoft 365 subscription, so no architecture or servers to manage. Now, optionally, if you want additional compliance and control, or you want to scope usage across different departments, you can set up named environments and deploy Project for the web into those. For more on how to do that setup, you can go to aka.ms/ProjectMechanics.
– Okay, so what about Project Operations, what deployment options then do you have there?
– Well, depending on what you have now, there are a few paths you can take. First, we have a simple Lite deployment option. And then we have Project Operations for resource and non-stocked materials scenarios for when you don’t carry an inventory of materials or resources. And finally, we have Project Operations for stocked and production order scenarios. To help you determine which deployment is best in your case, we’ve created a deployment questionnaire with five questions. Once you’ve answered the questions, it’ll recommend a deployment option for you. And from there, the Begin Setup button will direct you right to the Lifecycle Services to enable it.
– Thanks so much, George, for walking us through all the options for detailed project management, whether you’re working in Teams or across multiple divisions inside your organization, but how can people then learn more?
– The great news is you can try both solutions for yourself. I recommend requesting a trial for Dynamics 365 Project Operations. You can do that at aka.ms/ProjectOperationsTrial. And for Project for the web, you can visit aka.ms/TryProjectNow.
– Awesome stuff, and of course, keep watching Microsoft Mechanics for the latest tech updates. Subscribe if you haven’t already, and we’ll see you next time.
by Contributed | Jun 1, 2021 | Technology
This article is contributed. See the original author and article here.
One of the important goals of Azure Security Center is to help you understand your current security situation. Azure Security Center continuously assesses your resources for security issues and flags a resource as healthy or unhealthy accordingly providing you recommendations.
Automation is not new in Azure Security Center, it reduces overhead and can improve your security by ensuring the process steps are done quickly, consistently and according to your predefined requirements. Azure Resource Graph and Azure Security Center’s REST APIs gives you great capability to achieve this goal. We recently added two new time indicator fields to both Microsoft.security/assessments REST API provider and Azure Resource Graph to help you have more visibility into when was a resource first identified as unhealthy/healthy (firstEvaluationDate) and when the resource status changed to healthy/unhealthy (statusChangeDate) with the help of which, you can create automations around Cloud Security Posture Management (CSPM). Learn more about these fields here. The time-indicator fields makes it even more easy for you to automate and build your own playbooks for e.g., an automation my dear friend created recently to notify about new stale resources.
Today I want to introduce you to another automation that uses Time Indicators (firstEvaluationDate and statusChangeDate) to show the average time it needs for your resource owners to remediate a particular security control or recommendation.
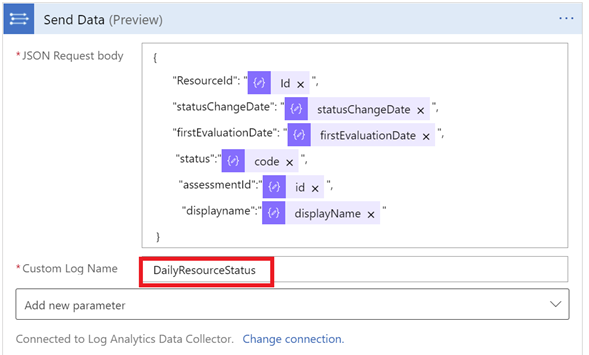
This playbook is configured to run every 24hrs to pull the assessment information from the API and exports the assessments identified by Azure security center to a custom log of the Log Analytics workspace
 Example Custom log created in the Log analytics workspace
Since the Log Analytics workspace has the historical data now, the logic app starts by iterating all the healthy assessments of the resources and if the assessment status is found to be “healthy”, it queries the history to check if that resource was ever “unhealthy” and logs the previousStatus date.
 previousStatus calculation example
The difference of these dates will be written to an array to calculate the average in the next loop.
The Logic App is using ticks, to calculate the specific timestamp inorder to get the average time. One of the challenges using the built-in date/time functions in Logic App, addToTime() or addSeconds(), is it can only handle as precise as seconds, while ticks provide ten million times more accurate values, which we lose a certain level of precision.
 Use of Ticks to calculate timestamp
The output of the HealthyArray variable will be passed to an Aggregation loop to calculate the average time for all those resources whose previousState was unhealthy.
This value is passed to a to a custom log of the Log Analytics workspace which represents the average time taken to remediate the resources to better RCA for changes.
 Example Custom log created in the Log analytics workspace representing average time
The playbook will also calculate the total number of unhealthy resources in the 24hrs period and the top ‘five’ security controls that are unhealthy in your environment and will then compose a new HTML email body and send it to the address(es) that you determine when deploying the automation to your environment.
 Example email generated from the automation
Note:
Make sure to manually trigger the playbook once you’ve met all prerequisites. Since this Playbook creates a custom log in the Log Analytics Workspace, for the first few runs the logicapp will error out until there’s data in the workspace for it to pull. Once the custom table gets populated in the workspace, you’ll start receiving the results.
What are you waiting for? Go ahead and deploy this automation from our Azure Security Center Github repository using the provided ARM template and let us know your feedback.
Now that we have given you a good head start on how to use these fields, show us your creativity using the time indicators and don’t forget to let us know how these new fields (firstEvaluationDate and statusChangeDate) are helpful for you.
Acknowledgements:
Thanks to for @Miri Landau, @Ronny Keshet for envisioning this wonderful automation idea.
by Contributed | Jun 1, 2021 | Technology
This article is contributed. See the original author and article here.
It’s been a while since we last talked about the events captured by Microsoft Defender for Identity. We last published a blog in August last year and so we thought it would be a good opportunity to give you an update with the latest events you can use to hunt for threats on your domain controllers using advanced hunting in Microsoft 365 Defender.
As a general rule of thumb, all Defender for Identity activities that are available in Microsoft 365 Defender advanced hunting fit into one of four data sets:
- IdentityInfo
- IdentityLogonEvents
- IdentityQueryEvents
- IdentityDirectoryEvents
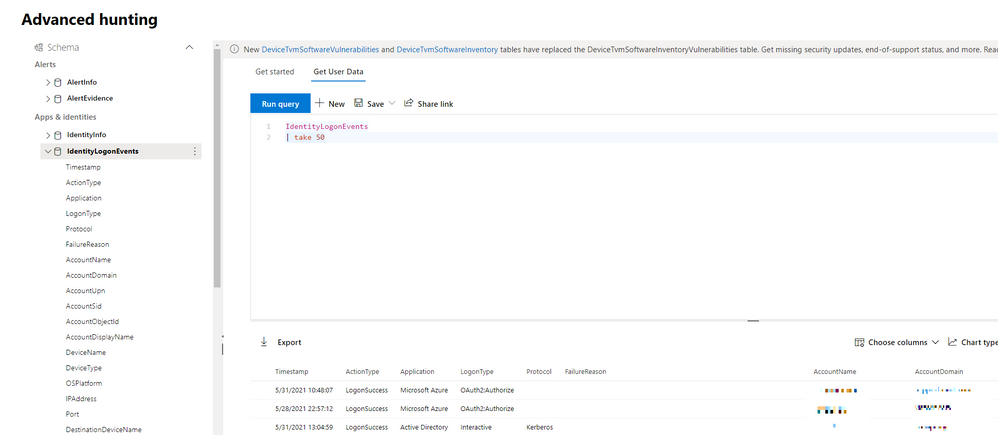
(Figure 1 – The advanced hunting console available as part of Microsoft 365 Defender)
Learn about accounts in your organization using IdentityInfo
Every effective threat hunting style investigation starts with understanding what users we are protecting, and this is what we are presented with using the IdentityInfo table. Although this data set is not exclusive to Defender for Identity, it does provide comprehensive details for the accounts being utilized in the environment. Using information made available from this data set, you can easily correlate different account attributes such as cloud / on-premises SID, UPN, and object ID.
This table also provides rich account information from Active Directory such as personal details (name, surname, city, country), professional information (job title, department, email address), and other AD attributes (domain, display name).
//Find out what users are disabled.
IdentityInfo
| where IsAccountEnabled == “0”
| summarize arg_max(AccountName,*) by AccountUpn
Correlating information between Defender for Identity and Defender for Endpoint
With Defender for Identity installed in your organization, your on-premises Active Directory identities are protected against advanced threats, and you also have visibility into various logon events. These authentication activities, along with those being captured by Azure AD feeds into IdentityLogonEvents data set, where you can hunt over authentication activities easily.
Defender for Identity activities are covering authentications over Kerberos, LDAP, and NTLM. Each authentication activity provides details such as the account information, the device the authentication activity was performing on, network information (such as the IP and port number), and more.
Harnessing this data, you can easily hunt over abnormal logons during non-working hours, learn more about logon routine in the network, and correlate data with Microsoft Defender for Endpoint.
// Enrich logon events with network activities happening on the device at the same time
IdentityLogonEvents
| where Timestamp > ago(7d)
| project LogonTime = Timestamp, DeviceName, AccountName, Application, LogonType
| join kind=inner (
DeviceNetworkEvents
| where Timestamp > ago(7d)
| project NetworkConnectionTime = Timestamp, DeviceName, AccountName = InitiatingProcessAccountName, InitiatingProcessFileName, InitiatingProcessCommandLine
) on DeviceName, AccountName
| where LogonTime - NetworkConnectionTime between (-2m .. 2m)
Queries targeting Active Directory objects
With IdentityQueryEvents, you can quickly find out what queries are targeting the domain controller. Queries can happen over the network either naturally by different services or legitimate activities in the network but can often be used by an attacker to perform reconnaissance activities on different objects like users, groups, devices or domains – seeking out those with certain attributes or privileges.
In certain attack vectors, like AS-REP Roasting that we covered in an earlier blog post, the reconnaissance portion often involves the attacker performing enumeration techniques to find users that have the pre-authentication attribute turned on. This can be found easily with a similar query:
// Enrich logon events with network activities happening on the device at the same time

IdentityLogonEvents
| where Timestamp > ago(7d)
| project LogonTime = Timestamp, DeviceName, AccountName, Application, LogonType
| join kind=inner (
DeviceNetworkEvents
| where Timestamp > ago(7d)
| project NetworkConnectionTime = Timestamp, DeviceName, AccountName = InitiatingProcessAccountName, InitiatingProcessFileName, InitiatingProcessCommandLine
) on DeviceName, AccountName
| where LogonTime - NetworkConnectionTime between (-2m .. 2m)
Track Active Directory changes
Finally, we have the IdentityDirectoryEvents table. In general, this table captures three categories of events on your domain controller:
- Remote code execution.
- Changes to attributes of Active Directory objects, including groups, users, and devices.
- Other activities performed against the directory, such as replication or SMB session enumeration.
Also, starting with Defender for Identity version 2.148, if you configure and collect event ID 4662, Defender for Identity will report which user made the Update Sequence Number (USN) change to various Active Directory object properties. For example, if an account password is changed and event 4662 is enabled, the event will record who changed the password. As a result, this information can be found using advanced hunting.
Here is a sample query you can use:
// Track service creation activities on domain controllers
IdentityDirectoryEvents
| where ActionType == "Service creation"
| extend ServiceName = AdditionalFields["ServiceName"]
| extend ServiceCommand = AdditionalFields["ServiceCommand"]
| project Timestamp, ActionType, Protocol, DC = TargetDeviceName, ServiceName, ServiceCommand, AccountDisplayName, AccountSid, AdditionalFields
| limit 100
As always, please let us know what you think and how we can enhance this capability further. Let us know what you use advanced hunting for in the comments too!
To learn more about advanced hunting in Microsoft 365 Defender and these new enhancements, go to the following links:

Recent Comments