Building a Cloud Native Lab at Home
This article is contributed. See the original author and article here.
Everyone loves a good home lab setup. The cloud is great, but buying and installing hardware in the comfort of your own home is something one can get addicted to :)
Don’t get me wrong – there are things I put straight into the cloud without even considering self-hosting. Even though I have been an Exchange Admin in a previous life I use Office 365, and I certainly trust OneDrive and Azure File Storage more than the maintenance of my own RAID/NAS. But running 30 virtual machines ain’t free and even if there is a cost to buying hardware it might come up cheaper over time.
The challenge is that these days you want things to be as cloud native as they can. So, you don’t want to install virtual machines where you install a web server that you subsequently have to configure. And even though you can install Docker on both Windows and Linux servers you want something more sophisticated than individual containers.
You want something like Kubernetes with all the fixings. No, Kubernetes is not the perfect option that you always want to use, but it’s certainly something you should have hands-on experience with these days. (I’m approaching this lab from the developer perspective. Running VMs has been a solved problem for years.) Sure, there’s options like Service Fabric as well since we’re dealing with the Microsoft tech stack, but I’m not diving into that right now.
If you set up an Ubuntu VM you can get going with Microk8s in minutes, but why stop there?
Microsoft announced Azure Stack HCI AKS a few months back, and it just went GA. (That’s hyper-converged servers that can plug into Azure and then you optionally put Azure Kubernetes Service on top.)
More info:
https://docs.microsoft.com/en-us/azure-stack/aks-hci/
I felt that not all my questions were easily answered in the docs. Do you need two nodes? What does it cost? How much hardware at a minimum?
Well, it’s not like the docs are bad, but they do kind of drive you towards a more enterprisey setup. The bigger problem is that all the info you need is spread across a number of sections in the docs and that’s why I wanted a more complete set of instructions (while not diving into all the technical details). So, inspired by what I could find on docs.microsoft.com and http://aka.ms/azurearcjumpstart as well as an amount of testing and validation on my own I put together a little guide for building this at home.
If you want a “proper” cluster you need at least two nodes (with the witness going in the cloud) , and you’ll want 2 NVMe drives + 8 SSDs for Storage Spaces Direct. (Well, you probably want all NVMe if money is no concern.) You’ll probably want minimum 64 gigs of RAM in each box as well.
Azure Stack HCI doesn’t have an up-front cost, but it will set you back 10$ a month pr core at the current pricing. So, it adds up if you’re on a budget. And that does not include the licenses for any Windows VMs you run on the cluster. You can trial it for free for 60 days so there’s no risk testing it though. It works nicely, but at the moment I don’t feel it’s quite worth it now as many of the features are still “Coming Soon”. Since there are new versions in preview this might change in the future, so this is not a permanent evaluation on my part.
Wait a moment, I first said “Azure Stack HCI AKS” and then “Azure Stack HCI” without the AKS term. Was that a spelling error? No. The AKS part is an additional installation after you get the HCI part working. (Which means that HCI doesn’t mean you must run Kubernetes. You can still do VMs in parallell.) Azure Stack HCI is an operating system you install yourself so you can install software on top of that. It shares a lot of the code base with Windows Server, but with some tweaks to become a cloud-connected evergreen OS.
You can however skip the cluster part and go single node, and for the sake of it I tested the latest build of Windows Server 2022 Preview instead of this purpose-built OS. This works like a charm.
For hardware I went with an HPE Microserver Gen 10 Plus with 32GB RAM and even if I stuffed in two SSDs I tested on a single HDD just to be sure. Storage Spaces and/or RAID is a recommendation, but not a hard prerequisite. (I can confirm the Microserver unofficially supports 64GB RAM as well, but it’s slightly expensive and tricky to chase down known good RAM sticks.) You can certainly make it work on different bits of hardware too – a configuration like this doesn’t have to break your bank account in any way. (I like the size of the Microserver as well as iLO, built in quad port NIC even if it is just gigabit, etc.)
Righty, I managed to install an operating system – now what? If you want a UI for management you’re driven towards Windows Admin Center (WAC) in general these days:
https://docs.microsoft.com/en-us/windows-server/manage/windows-admin-center/overview
Azure Stack HCI has the Server Core UI whereas with Windows Server 2022 you can still go full desktop mode.
Note: This isn’t an intro to Kubernetes as such; it’s about getting a specific wrapping of Kubernetes going. If you’re a k8s veteran there are parts you can skim through, and if you’re new to container orchestration you might want to research things in other places as well along the way. I try to hit a middle ground here.
There’s an AKS plugin for WAC that in theory will let you set it up through a wizard. I’m saying “theory” because I’m seeing inconsistency – sometimes I get an unhelpful CredSSP or WinRM error thrown in the face, and sometimes it works. And I’m not liking that. However, it is a great way to install the Powershell cmdlets and have a quick look if things in general are ok. (Screenshot from a two-node setup.)
 Windows Admin Center AKS Prereqs
There’s a quick start for using the Windows Admin Center (WAC) to set things up here:
https://docs.microsoft.com/en-us/azure-stack/aks-hci/setup
And for PowerShell here (you can install everything without involving WAC):
https://docs.microsoft.com/en-us/azure-stack/aks-hci/kubernetes-walkthrough-powershell
Step 2 & 3 (in PowerShell) is where things can get a little confusing. I did not feel the parameters where sufficiently explained. An example of what I basically went with follows. (I have a slightly different IP addressing scheme, but same same in the bigger picture).
Assuming you have a 192.168.0.0/24 subnet, and have already created a virtual switch on the server named “LAN”. Let’s say you use 192.168.0.2 – 192.168.0.99 (default gateway on .1) as your DHCP scope you’ll want to carve out a static space separately for AKS.
You will want a range for the nodes, and you will want a range for any load balancers you provision in the cluster. (Adjust to account for your specifics.)
$vnet = New-AksHciNetworkSetting -name aksvnet -vSwitchName "LAN" -macPoolName aksMacPool -k8sNodeIpPoolStart "192.168.0.101" -k8sNodeIpPoolEnd "192.168.0.110" -vipPoolStart "192.168.0.111" -vipPoolEnd "192.168.0.120" -ipAddressPrefix "192.168.0.0/24" -gateway "192.168.0.1" -dnsServers "192.168.0.1"

Set-AksHciConfig -vnet $vnet -imageDir C:ClusterStorageVolume01Images -cloudConfigLocation C:ClusterStorageVolume01Config -cloudservicecidr "192.168.0.100/24"

Set-AksHciRegistration -subscriptionId "guid" -resourceGroupName "rg-AKS"

Install-AksHci -Verbose
It might take a little while to provision, but with a bit of luck it will go through. Don’t worry about the Azure registration – this does not incur a cost, but is used for Azure Arc. (Azure Arc is a service for managing on-prem services from Azure and is not specific to AKS.)
After installation of the host cluster you might want to run the Update-AksHci cmdlet in case you didn’t get the newest release on the first go. (I have experienced this.)
This takes care of setting up the AKS host, but not the actual nodes for running workloads so you will want to create that next. I went with Linux nodes, but you can create Windows nodes as well if you like. This actually mirrors AKS hosted in Azure, but things have been abstracted away slightly there so you might not think much about this. (Which is OK.)
If you have a 32GB RAM server the New-AksHciCluster cmdlet without parameters will probably fail since you don’t have enough memory. And when scaling things down you’ll also want to account for upgrades – when upgrading the cluster a new instance of each virtual machine is spun up in parallel requiring you to have enough headroom for this. This should work:
New-AksHciCluster -Name aks01 -loadBalancerVmSize "Standard_A2_v2" -controlplaneVmSize "Standard_A2_v2" -linuxNodeVmSize "Standard_A2_v2"
(I attempted using “Standard_K8S_v1” for the worker node, but the memory peaked almost immediately resulting in a loop of creating new nodes that were also underpowered and never getting to a fully working state with the workloads described here.)
If you have 64GB or more you shouldn’t have to tweak this.
You can upgrade your workload cluster to a newer Kubernetes version independently of the host version. There are limits though – to run the newest versions of Kubernetes on the nodes you may have to upgrade the host to a newer version as well in some cases. Both clusters can be connected to Azure with Arc, but the workload cluster is the most important one here.
Connect the cluster you just created to Azure like this:
Connect-AzAccount
Enable-AksHciArcConnection -name aks01
At this point you should be good to verify things by putting some containers inside the cluster if you like.
I have a very simple frontend & backend setup here:
https://github.com/ahelland/HelloFoo
Since the images are on Docker hub you only need the /k8s/HelloFoo.yaml if you don’t feel like playing with the code or build your own images.
I wouldn’t call it fancy by any means, but it consists of two “microservices” you can test with a Kestrel-based image (dotnet run), Docker and Kubernetes.
While still on the server you can download kubectl as you will need that to proceed:
curl https://dl.k8s.io/release/v1.21.0/bin/windows/amd64/kubectl.exe -Outfile kubectl.exe
You also need credentials to access the cluster:
Get-AksHciCredential -name aks01
Apply with .kubectl.exe apply -f HelloFoo.yaml
Then you can run kubectl get -svc -A to give you the IP address (from the load balancer range you provided)
If you just want a plain cloud native setup you’re done now. (You can of course install kubectl on your desktop if you prefer.)
However I kinda like testing out “day 2” use cases as well.
GitOps and Flux is getting more popular as the option for installing configuration and services.
This is also slightly lacking in the docs. It’s actually quite simple (using the same repo):
Find the cluster through Azure Arc in the Azure Portal and go to the GitOps blade and “Add configuration”
 GitOps/Flux
For adding a public GitHub repo (like mine) it looks like this, but it’s also possible to add private repos. Note the use of the git-path parameter to point to the right folder (containing yaml):
 GitOps/Flux
For more background:
https://docs.microsoft.com/en-us/azure/azure-arc/kubernetes/use-gitops-with-helm
Once you have this working (you should probably have separate repos for config and apps) you can just go at it in your editor of choice and check in the results to do a roll-out. For an automated bootstrap scenario you can perform the setup with PowerShell as well. Which basically means – a script does all the work of setting up the Kubernetes cluster and then Git kicks in to deploy the essentials.
Since we’re at it we will of course need monitoring and tracing abilities too. Azure Monitor is decent, but it does have a cost so if you’re on a budget either skip it or keep an eye on it so it doesn’t run up a huge bill.
The combo of Prometheus and Grafana is a well known solution for Kubernetes, and that’s fairly easy to implement. Follow the instructions here:
https://docs.microsoft.com/en-us/azure-stack/aks-hci/monitor-logging
First enable Prometheus:
Install-AksHciMonitoring -Name aks01 -storageSizeGB 100 -retentionTimeHours 240
To load the config for Grafana:
kubectl apply -f https://raw.githubusercontent.com/microsoft/AKS-HCI-Apps/main/Monitoring/data-source.yaml

kubectl apply -f https://raw.githubusercontent.com/microsoft/AKS-HCI-Apps/main/Monitoring/dashboards.yaml
Then install Grafana (which will use the data source and the dashbord from the previous two yaml files). (Note that this requires the installation of Helm – https://helm.sh/docs/intro/install/ downloading the zip and extracting should work on Windows Server.)
helm repo add grafana https://grafana.github.io/helm-charts

helm repo update

helm install grafana grafana/grafana --version 6.11.0 --set nodeSelector."kubernetes.io/os"=linux --set sidecar.dashboards.enabled=true --set sidecar.datasources.enabled=true -n monitoring
Retrieve the Grafana secret (and have it ready for logging in to the dashboard afterwards):
kubectl get secret --namespace monitoring grafana -o jsonpath="{.data.admin-password}" | base64 --decode ; echo
(Note that the base64 option doesn’t work on Windows, so you would need to do that decode separately.)
 Grafana displaying Prometheus metrics
There’s one more thing we want to do in the monitoring and diagnostics department, but a small digression first.
For a small lab at home it’s not necessary to be super strict with security and policies inside the cluster, but if you want to practice production the term “service mesh” will come up. I’m not going to do a comparison of those, but Istio, Linkerd and Consul are popular choices that Microsoft provides instructions for as well:
https://docs.microsoft.com/en-us/azure/aks/servicemesh-osm-about
For more info on meshes you can also check out https://meshery.io
I wanted to test “Open Service Mesh” as that is available as an add-on for AKS. I found these instructions clearer:
Since I didn’t want to bother with making sure I had the right version of Azure Cli installed locally I just did it in Azure Cloud Shell :) (Point being that you don’t need to be on-prem to perform this step.)
There is a snag at the time of writing this. The instructions point to version 0.8.4, but I wanted to use 0.9.0 (newer) which required me to use this cmdlet:
az k8s-extension create --cluster-name aks01 --resource-group ARC-AKS-01 --cluster-type connectedClusters --extension-type Microsoft.openservicemesh --scope cluster --release-train staging --name osm --version 0.9.0
Since I’m using OSM I will also follow the MS instructions for installing the bookstore app:
Note that you should not use the instructions for Grafana and Prometheus from this page – these instructions are for “cloud AKS” not “on-prem AKS”. (Prometheus will fail to run due to permissions issues.)
You can however use the yaml from this page to install a popular tracing tool called Jaeger. Copy the yaml on the page and save to a file while adding the namespace on top:
apiVersion: v1
kind: Namespace
metadata:
  name: jaeger
  labels:
    name: jaeger
---
And apply:
kubectl apply -f jaeger.yaml
Another quick note about the instructions here. It is referred to a configmap for the settings – this is not used in 0.9.0 any more so to read the config you will need to run the following command:
kubectl get meshconfig osm-mesh-config -n arc-osm-system -o yaml
We need to make two small adjustments (enable tracing and change the address for Jaeger) to this meshconfig which can be done by patching the meshconfig:
kubectl patch meshconfig osm-mesh-config -n arc-osm-system -p '{"spec":{"observability":{"tracing":{"enable":true,"address": "jaeger.jaeger.svc.cluster.local","port":9411,"endpoint":"/api/v2/spans"}}}}' --type=merge
On Windows you will probably see an error about invalid json so you have to do an extra step:
$jsonpatch = '{"spec":{"observability":{"tracing":{"enable":true,"address": "jaeger.jaeger.svc.cluster.local","port":9411,"endpoint":"/api/v2/spans"}}}}' | ConvertTo-Json

kubectl patch meshconfig osm-mesh-config -n arc-osm-system -p $jsonpatch --type=merge
More info:
https://docs.openservicemesh.io/docs/concepts_features/osm_mesh_config/
 Jaeger
For testing you can port-forward to the pods and this makes sense for the bookstore apps, but it’s probably better to set up load balancers for this when you want it more permanent so create a file like this to expose Grafana, Jaeger and Prometheus:
apiVersion: v1
kind: Service
metadata:
  namespace: monitoring
  name: grafana
  labels:
    app.kubernetes.io/instance: grafana
    app.kubernetes.io/managed-by: Helm
    app.kubernetes.io/name: grafana
    app.kubernetes.io/version: 7.5.5
    helm.sh/chart: grafana-6.11.0
spec:
  externalTrafficPolicy: Cluster
  ports:
  - port: 80
    protocol: TCP
    targetPort: 3000
  selector:
    app.kubernetes.io/instance: grafana
    app.kubernetes.io/name: grafana
  sessionAffinity: None
  type: LoadBalancer
---
apiVersion: v1
kind: Service
metadata:
  namespace: jaeger
  name: jaeger
spec:
  externalTrafficPolicy: Cluster
  ports:
  - port: 80
    protocol: TCP
    targetPort: 16686
  selector:
    app: jaeger
  sessionAffinity: None
  type: LoadBalancer
---
apiVersion: v1
kind: Service
metadata:
  namespace: monitoring
  name: prometheus
spec:
  externalTrafficPolicy: Cluster
  ports:
  - port: 80
    protocol: TCP
    targetPort: 9090
  selector:
    app: prometheus
  sessionAffinity: None
  type: LoadBalancer
It would actually be even better to set up ingresses and DNS names, etc. but for the purpose of getting your lab up and running in a basic form this is out of scope.
Sure, I skipped some parts you might want to look into here:
- The docs refer to Prometheus scraping metrics from OSM, which you kind of want, but I left that out for now.
- The service mesh is set to permissive which means you don’t get all that mesh goodness.
- I have not touched upon network policies or plugins.
- Since I didn’t do ingress and didn’t do DNS it follows that https isn’t part of the picture either.
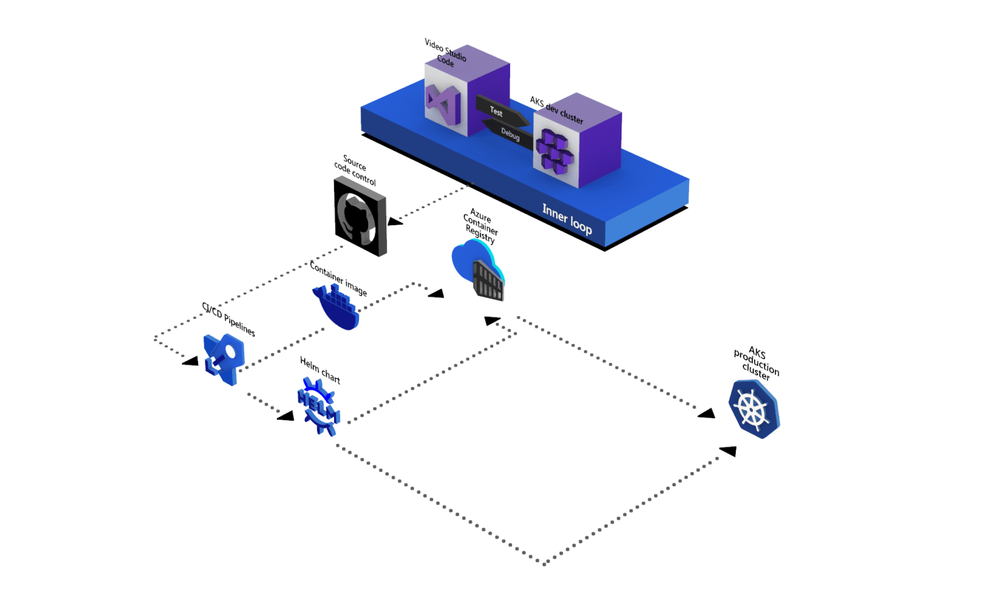
- While GitOps is part of the CI/CD story we have not explored a setup with pipelines and repos so you might want to tinker with GitHub Actions to automate these pieces.
I will be exploring these features as well (don’t know if I’ll put out some instructions on that or not), and I encourage you to do the same. With the risk of repeating myself – this is intended to get an AKS cluster going so it can be used for a basic cloud native setup. What you make of it is up to you :)
And the disclaimer – I know that this works and seems to be an acceptable way to use the software at the time of writing, but I cannot predict if Microsoft will change anything on the technical or licensing side of things.


Recent Comments