by Contributed | Dec 15, 2021 | Technology
This article is contributed. See the original author and article here.
At-scale data processing systems typically store a single table in storage as multiple files. In the Azure Purview data catalog, this concept is represented by using resource sets; a resource set is a single object in the catalog that represents many assets in storage.
For example, suppose your Spark cluster has persisted a DataFrame into an Azure Data Lake Storage (ADLS) Gen2 data source. In Spark, the table looks like a single logical resource, but on the disk there are likely thousands of Parquet files, each of which represents a partition of the total DataFrame’s contents.
IoT data and web log data have the same challenge. Imagine you have a sensor that outputs log files several times per second. It won’t take long until you have hundreds of thousands of log files from that single sensor. In Azure Purview, resource sets allow for these partitions to be handled as a single data asset, allowing for easy consumption and preventing oversaturation of the data catalog.
How Azure Purview detects resource sets
Azure Purview supports resource sets in Azure Blob Storage, ADLS Gen1, ADLS Gen2, Azure Files, and Amazon S3.
Azure Purview automatically detects resource sets when scanning. This feature looks at all the data that’s ingested via scanning and compares it to a set of defined patterns.
For example, suppose you scan a data source whose URL is https://myaccount.blob.core.windows.net/mycontainer/machinesets/23/foo.parquet. Azure Purview looks at the path segments and determines if they match any built-in patterns. It has built-in patterns for GUIDs, numbers, date formats, localization codes (for example, en-us), and so on. In this case, the number pattern matches 23. Azure Purview assumes this file is part of a resource set named https://myaccount.blob.core.windows.net/mycontainer/machinesets/{N}/foo.parquet.
Or, for a URL such as https://myaccount.blob.core.windows.net/mycontainer/weblogs/en_au/23.json, Azure Purview matches both the localization pattern and the number pattern, producing a resource set named https://myaccount.blob.core.windows.net/mycontainer/weblogs/{LOC}/{N}.json.
Using this strategy, Azure Purview would map the following resources to the same resource set, https://myaccount.blob.core.windows.net/mycontainer/weblogs/{LOC}/{N}.json:
Note: Azure Purview intentionally doesn’t try to classify document file types such as Microsoft Word, Microsoft Excel, and PDFs as resource sets.
Advanced resource sets
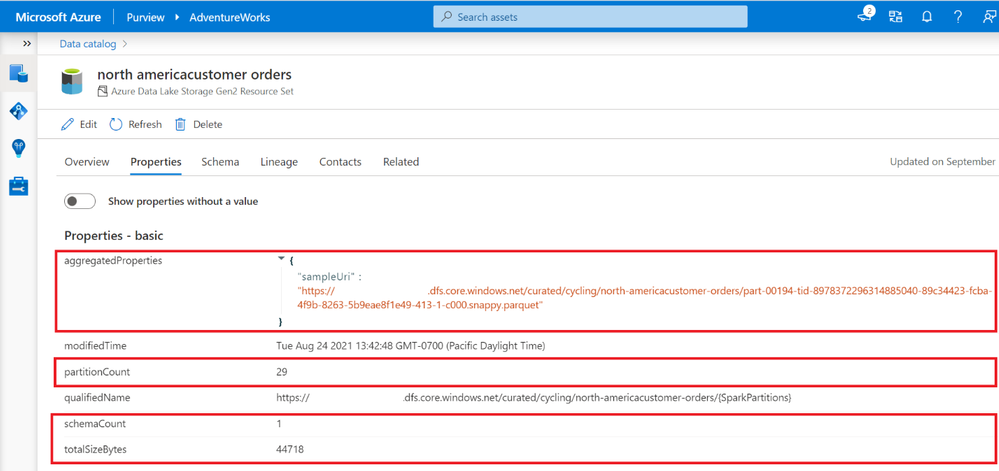
Azure Purview can customize and further enrich your resource set assets through the Advanced Resource Sets capability. When advanced resource sets are enabled, Azure Purview runs extra aggregations to compute the following information about resource set assets:
- Up-to-date schema and classifications to accurately reflect schema drift from changing metadata.
- Sample file paths of assets that comprise the resource set.
- A partition count that shows how many files make up the resource set.
- A schema count that shows how many unique schemas were found. This value is either a number between 1 and 5, or for values greater than 5, 5+.
- A list of partition types when more than a single partition type is included in the resource set. For example, an IoT sensor might output both XML and JSON files, although both are logically part of the same resource set.
- The total size of all files that comprise the resource set.
These properties can be found on the asset details page of the resource set.
Enabling advanced resource sets also allows for the creation of resource set pattern rules that customize how Azure Purview groups resource sets during scanning.
Enabling advanced resource sets
The advanced resource sets feature is off by default in all new Azure Purview instances. Advanced resource sets can be enabled from Account information in the management hub.

After enabling advanced resource sets, the additional enrichments will occur on all newly ingested assets. The Azure Purview team recommends waiting an hour before scanning in new data lake data after toggling on the feature.
Customizing resource set grouping using pattern rules
When scanning a storage account, Azure Purview uses a set of defined patterns to determine if a group of assets is a resource set. In some cases, Azure Purview’s resource set grouping might not accurately reflect your data estate. These issues can include:
- Incorrectly marking an asset as a resource set
- Putting an asset into the wrong resource set
- Incorrectly marking an asset as not being a resource set
To customize or override how Azure Purview detects which assets are grouped as resource sets and how they are displayed within the catalog, you can define pattern rules in the management center. Pattern rules are only available when the advanced resource sets feature is enabled. For step-by-step instructions and syntax, please see resource set pattern rules.

Get started today!
by Contributed | Dec 14, 2021 | Technology
This article is contributed. See the original author and article here.
Organizational charts can be an essential tool for any growing organization, especially now when new hires are trying to figure out their place in the company without actually meeting their colleagues in person. Org charts can help visualize reporting structures and quickly provide employees with information they need—such as titles, roles, and responsibilities—to move processes forward. They can also be a practical tool for planning and evaluating re-structuring efforts or identifying open positions that need to be filled.
The Microsoft Visio desktop app has long supported the creation of org charts, complete with photos and personnel information, and the ability to automatically create org structures from data sources like Excel, Exchange, and Azure Active Directory.
As of today, users with a Visio Plan 1 or Visio Plan 2 license can now create org charts in the Visio web app, too. Alternatively, they can start creating org charts from data directly in Excel using the Data Visualizer add-in and further edit those diagrams using new org chart shapes in Visio for the web.
New org chart stencils and layouts in Visio for the web
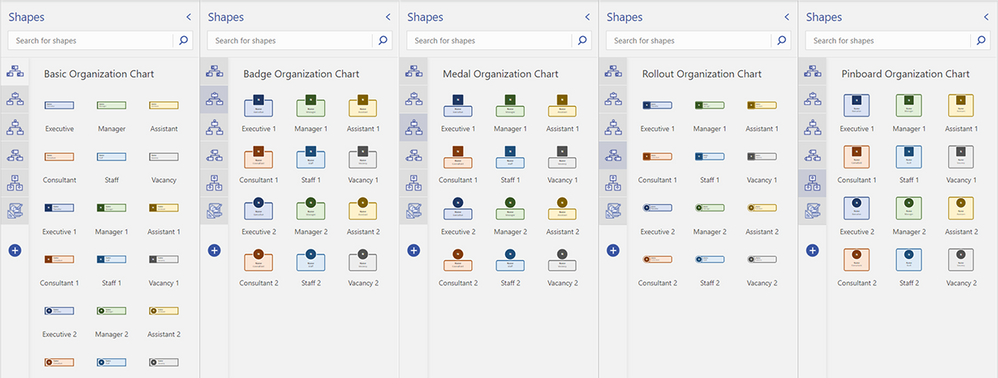
As part of this release, we’ve added five org chart stencils—Basic, Badge, Medal, Rollout, and Pinboard—with predefined, color-coded shapes that can easily be dragged onto the canvas to represent each employee or vacancy in your team, department, or organization. You can also choose from shapes that populate the initials of your employees’ names. Once you’ve added the new shapes to the canvas, you can add information, such as name, title/role, contact details, and location. Then, use connectors to show the hierarchy.
Five available org chart stencils now available—Basic, Badge, Medal, Rollout, and Pinboard—and shapes included in Visio for the web
We’ve also added eight new layout options—top to bottom, bottom to top, left to right, right to left, side-by-side, and hybrid combinations—so you can quickly visualize the hierarchy of your team, department, or organization how you want. Once your shapes are connected, select Layouts from the Organization Chart tab. Then, select your preferred layout.
 Eight org chart layout options available from the Organization Chart tab in Visio for the web
To help you get started quickly, we’ve also provided a few starter diagrams, representing various org chart scenarios, including HR management and Scrum Team structure.
 Available templates showing different organization charts in Visio for the web
To get started, visit office.com/launch/visio, select your preferred diagram template, and start visualizing your team structure. Visit our support article on how to create an organization chart in Visio to learn more.
Starting from the Visio Data Visualizer add-in in Excel
The Data Visualizer add-in is available for Excel on PC, Mac, and Excel for the web with a Microsoft 365 work or school account. You can access the add-in from the Visio Data Visualizer button in the ribbon of the Insert tab. If you are unable to find the button in the ribbon, select Get Add-ins and search for “Visio Data Visualizer” in the search box. Once the add-in has been added, you can select the Visio Data Visualizer button to quickly create a diagram from Excel data.
Select one of the five organization chart layouts available in the Data Visualizer add-in.
 Blank Excel spreadsheet showing the five org chart layout options available from the Visio Data Visualizer add-in
You can quickly replace the sample data in the Excel table with your organization’s data—including Employee ID, Name, Manager ID, Title, and Role Type—for each person you want to include in your org chart, then select Refresh.
 Data table and org chart in an Excel spreadsheet
If you have a subscription to Visio, you can further edit the diagram by changing the theme, modifying the layout, and adding and formatting the text. To further edit the org chart in Visio for the web, select either Edit in the diagram area or the ellipses (…) > Open in web.
After opening your diagram in Visio for the web, you will see the Basic Organization Chart stencil and shapes pinned to the Shapes pane. You can update your diagram using these basic shapes or also search for new shapes by typing a keyword in the search box and selecting the magnifying glass. Drag the shape you want from the stencil onto the canvas or pin the stencil to the Shapes pane for easy access.
 Organization chart in Visio for the web
When you’re done, hit the Share button in the upper right corner to invite your colleagues to collaborate on your diagram and provide feedback.
Please note: Any changes made in Visio for the web—beyond adding and formatting text, changing the theme, or changing the diagram’s layout—cannot be synced back to the original Excel source file. For more details on how to create an org chart based on Excel data using the Visio Data Visualizer add-in, please review our support article.
We’re excited about the future of Visio, and we look forward to hearing your feedback to make the Visio web app the diagramming tool to convey information and processes more effectively. Please tell us what you think in the comments below or send feedback via our new Feedback portal!
Continue the conversation by joining us in the Microsoft 365 Tech Community! Whether you have product questions or just want to stay informed with the latest updates on new releases, tools, and blogs, Microsoft 365 Tech Community is your go-to resource to stay connected!
by Contributed | Dec 13, 2021 | Technology
This article is contributed. See the original author and article here.
With the continued evolution and adoption of hybrid work, we know how critical a strong identity and governance control plane is for IT scalability and a seamless user experience. Today, we are excited to share new Azure Active Directory (Azure AD) capabilities and best practices that can help organizations with these needs. With these updates, organizations will now be able to allow password writeback from the cloud when using Azure AD Connect cloud sync, provision to on-premises applications, verify their SCIM provisioning endpoints, and more.
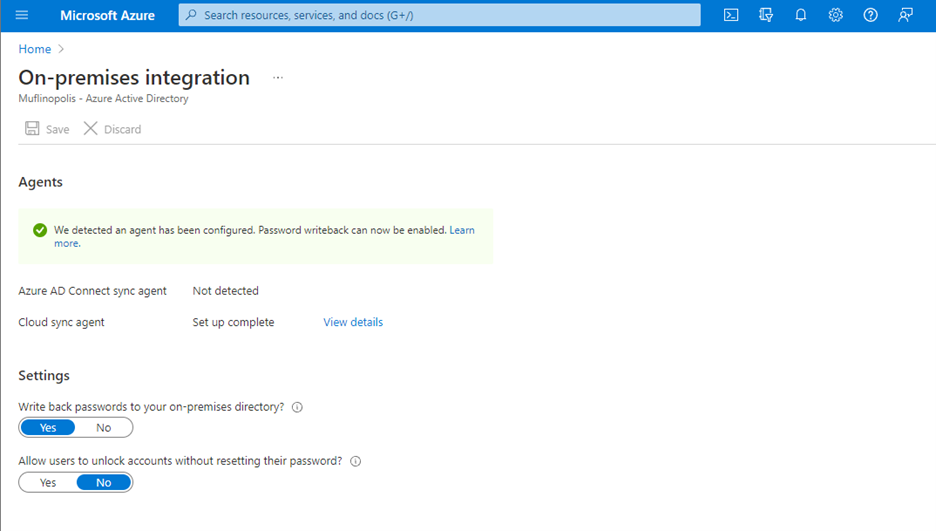
Allow users to reset their password regardless if they are on-premises or in the cloud
Password writeback allows an on-premises synched user to initiate password changes in the cloud and have the password written back to the user’s on-premises Active Directory Domain Services (AD DS) environment in real time. This enables users to seamlessly transition between cloud and on-premises applications without worrying about managing multiple passwords. No matter where the password is updated, it remains in sync across the cloud and on-premises.
Now in public preview, Azure AD Connect cloud sync password writeback includes support for users synced from disconnected environments. Organizations can sync users from multiple disconnected domains into a central Azure AD tenant and reset passwords for these users from Azure AD.
Simplify provisioning to cloud and on-premises applications
At Microsoft Ignite, we announced that an open public preview is available for Azure AD to provisioning to on-premises applications that support SCIM, SQL, and LDAP. Organizations can manage provisioning to their on-premises applications the same way they’re used to with popular SaaS applications such as monday.com, Miro, and Asana. Building on this momentum, we’ve now added the ability to provision users into third-party LDAP directories such as OpenLDAP.

Simplify building and testing your provisioning end point in compliance with the SCIM standard
A limited preview is now available of a SCIM validation tool. This enables partners and customers to validate that their end point is compatible with the Azure AD SCIM client, reducing onboarding time to the Azure AD app gallery. Once you have built your new application as per the guidelines, you can request an invite to the preview here.

Upgrade to the latest version of Azure AD Connect sync to future-proof your environment
Legacy versions of Azure AD Connect sync rely on components such as SQL2012 and ADAL that are being retired in the coming year. As such, all customers must upgrade to Azure AD Connect sync v2.0 or evaluate switching to Azure AD Connect cloud sync to ensure uninterrupted provisioning support. Azure AD Connect sync v1.x versions will be retired effective August 30, 2022.
To provide better predictability for IT planning cycles, we have also established a consistent retirement cadence for Azure AD Connect sync versions. Moving forward, we will retire each version 18 months after a new version is released.
Use date comparisons to drive provisioning logic
Attribute expression mapping enables you to control and transform data before writing to target systems. Based on your feedback, we have added new built-in date functions Now(), DateAdd() and DateDiff() to help you compare dates and define granular attribute provisioning based on date time values. You can nest and combine them with other functions in your user provisioning flow to implement scenarios such as:
- Based on user type, set user account expiry date in a SaaS application or on-premises application to “X” number of days after current provisioning time.
- Find the interval difference between current date and HR hire date and use it to determine account activation / data flow logic.
As always, we’d love to hear from you! Feel free to leave comments down below or reach out to us on aka.ms/AzureADFeedback.
Learn more about Microsoft identity:

by Contributed | Dec 12, 2021 | Technology
This article is contributed. See the original author and article here.
Please take this short survey (8 questions, 4 mins) ADX short survey to help us shape ADX data exploration experiences.
by Contributed | Dec 11, 2021 | Technology
This article is contributed. See the original author and article here.
Before implementing data extraction from SAP systems please always verify your licensing agreement. |
Over the last five episodes, we’ve built quite a complex Synapse Pipeline that allows extracting SAP data using OData protocol. Starting from a single activity in the pipeline, the solution grew, and it now allows to process multiple services on a single execution. We’ve implemented client-side caching to optimize the extraction runtime and eliminate short dumps at SAP. But that’s definitely not the end of the journey!
Today we will continue to optimize the performance of the data extraction. Just because the Sales Order OData service exposes 40 or 50 properties, it doesn’t mean you need all of them. One of the first things I always mention to customers, with who I have a pleasure working, is to carefully analyze the use case and identify the data they actually need. The less you copy from the SAP system, the process is faster, cheaper and causes fewer troubles for SAP application servers. If you require data only for a single company code, or just a few customers – do not extract everything just because you can. Focus on what you need and filter out any unnecessary information.
Fortunately, OData services provide capabilities to limit the amount of extracted data. You can filter out unnecessary data based on the property value, and you can only extract data from selected columns containing meaningful data.
Today I’ll show you how to implement two query parameters: $filter and $select to reduce the amount of data to extract. Knowing how to use them in the pipeline is essential for the next episode when I explain how to process only new and changed data from the OData service.
ODATA FILTERING AND SELECTION
To filter extracted data based on the field content, you can use the $filter query parameter. Using logical operators, you can build selection rules, for example, to extract only data for a single company code or a sold-to party. Such a query could look like this:
/API_SALES_ORDER_SRV/A_SalesOrder?$filter=SoldToParty eq 'AZ001'
The above query will only return records where the field SoldToParty equals AZ001. You can expand it with logical operators ‘and’ and ‘or’ to build complex selection rules. Below I’m using the ‘or’ operator to display data for two Sold-To Parties:
/API_SALES_ORDER_SRV/A_SalesOrder/?$filter=SoldToParty eq 'AZ001' or SoldToParty eq 'AZ002'
You can mix and match fields we’re interested in. Let’s say we would like to see orders for customers AZ001 and AZ002 but only where the total net amount of the order is lower than 10000. Again, it’s quite simple to write a query to filter out data we’re not interested in:
/API_SALES_ORDER_SRV/A_SalesOrder?$filter=(SoldToParty eq 'AZ001' or SoldToParty eq 'AZ002') and TotalNetAmount le 10000.00
Let’s be honest, filtering data out is simple. Now, using the same logic, you can select only specific fields. This time, instead of the $filter query parameter, we will use the $select one. To get data only from SalesOrder, SoldToParty and TotalNetAmount fields, you can use the following query:
/API_SALES_ORDER_SRV/A_SalesOrder?$select=SalesOrder,SoldToParty,TotalNetAmount
There is nothing stopping you from mixing $select and $filter parameters in a single query. Let’s combine both above examples:
/API_SALES_ORDER_SRV/A_SalesOrder?$select=SalesOrder,SoldToParty,TotalNetAmount&$filter=(SoldToParty eq 'AZ001' or SoldToParty eq 'AZ002') and TotalNetAmount le 10000.00
By applying the above logic, the OData response time reduced from 105 seconds to only 15 seconds, and its size decreased by 97 per cent. That, of course, has a direct impact on the overall performance of the extraction process.
FILTERING AND SELECTION IN THE PIPELINE
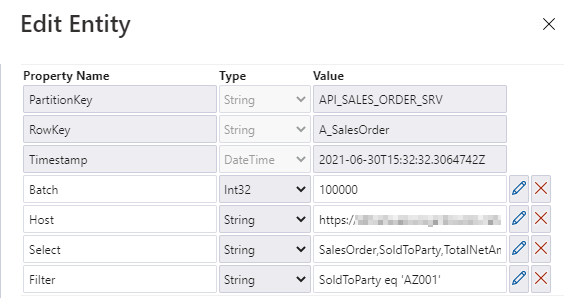
The filtering and selection options should be based on the entity level of the OData service. Each entity has a unique set of fields, and we may want to provide different filtering and selection rules. We will store the values for query parameters in the metadata store. Open it in the Storage Explorer and add two properties: filter and select.
I’m pretty sure that based on the previous episodes of the blog series, you could already implement the logic in the pipeline without my help. But there are two challenges we should be mindful of. Firstly, we should not assume that $filter and $select parameters will always contain a value. If you want to extract the whole entity, you can leave those fields empty, and we should not pass them to the SAP system. In addition, as we are using the client-side caching to chunk the requests into smaller pieces, we need to ensure that we pass the same filtering rules in the Lookup activity where we check the number of records in the OData service.
Let’s start by defining parameters in the child pipeline to pass filter and select values from the metadata table. We’ve done that already in the third episode, so you know all steps.

To correctly read the number of records, we have to consider how to combine these additional parameters with the OData URL in the Lookup activity. So far, the dataset accepts two dynamic fields: ODataURL and Entity. To pass the newly defined parameters, you have to add the Query one.

You can go back to the Lookup activity to define the expression to pass the $filter and $query values. It is very simple. I check if the Filter parameter in the metadata store contains any value. If not, then I’m passing an empty string. Otherwise, I concatenate the query parameter name with the value.
@if(empty(pipeline().parameters.Filter), '', concat('?$filter=', pipeline().parameters.Filter))

Finally, we can use the Query field in the Relative URL of the dataset. We already use that field to pass the entity name and the $count operator, so we have to slightly extend the expression.
@concat(dataset().Entity, '/$count', dataset().Query)

Changing the Copy Data activity is a bit more challenging. The Query field is already defined, but the expression we use should include the $top and $skip parameters, that we use for the client-side paging. Unlike at the Lookup activity, this time we also have to include both $select and $filter parameters and check if they contain a value. It makes the expression a bit lengthy.
@concat('$top=',pipeline().parameters.Batch, '&$skip=',string(mul(int(item()), int(pipeline().parameters.Batch))), if(empty(pipeline().parameters.Filter), '', concat('&$filter=',pipeline().parameters.Filter)), if(empty(pipeline().parameters.Select), '', concat('&$select=',pipeline().parameters.Select)))

With above changes, the pipeline uses filter and select values to extract only the data you need. It reduces the amount of processed data and improves the execution runtime.
IMPROVING MONITORING
As we develop the pipeline, the number of parameters and expressions grows. Ensuring that we haven’t made any mistakes becomes quite a difficult task. By default, the Monitoring view only gives us basic information on what the pipeline passes to the target system in the Copy Data activity. At the same time, parameters influence which data we extract. Wouldn’t it be useful to get a more detailed view?
There is a way to do it! In Azure Synapse Pipelines, you can define User Properties, which are highly customizable fields that accept custom values and expressions. We will use them to verify that our pipeline works as expected.
Open the Copy Data activity and select the User Properties tab. Add three properties we want to monitor – the OData URL, entity name, and the query passed to the SAP system. Copy expression from the Copy Data activity. It ensures the property will have the same value as is passed to the SAP system.

Once the user property is defined we start the extraction job.
MONITORING AND EXECUTION
Let’s start the extraction. I process two OData services, but I have defined Filter and Select parameters to only one of them.
Once the processing has finished, open the Monitoring area. To monitor all parameters that the metadata pipeline passes to child one, click on the [@] sign:

Now, enter the child pipeline to see the details of the Copy Data activity.

When you click on the icon in the User Properties column, you can display the defined user properties. As we use the same expressions as in the Copy Activity, we clearly see what was passed to the SAP system. In case of any problems with the data filtering, this is the first place to start the investigation.

The above parameters are very useful when you need to troubleshoot the extraction process. Mainly, it shows you the full request query that is passed to the OData service – including the $top and $skip parameters that we defined in the previous episode.
The extraction was successful, so let’s have a look at the extracted data in the lake.

There are only three columns, which we have selected using the $select parameter. Similarly, we can only see rows with SoldToParty equals AZ001 and the TotalNetAmount above 1000. It proves the filtering works fine.
I hope you enjoyed this episode. I will publish the next one in the upcoming week, and it will show you one of the ways to implement delta extraction. A topic that many of you wait for!

Recent Comments