This article is contributed. See the original author and article here.
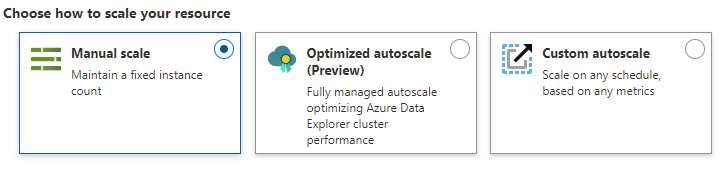
ADX offers customers 3 ways to manage their cluster’s instances count:
While in the Manual Scale/Custom Autoscale the customer should be involved in controlling the cluster size, in Optimized Autoscale, the customer enjoys better cost-optimization with minimal effort – just needs to set up lower and upper bounds for the cluster instances count and ADX will optimize its instances count between these bounds.
Until now the Optimized Autoscale was implemented using a Reactive model with smart rules on a variety of metrics, it is called “Reactive” since it acts in reaction to historical data, for example, if the CPU load was high during the last hour, it scales out.
Lately, ADX built a new Predictive Autoscale model that tackles few issues of the Reactive model to perform better. Below we explore these issues and how the Predictive model resolves them.
After scaling a cluster, a process of data reorganization (of the data shards) starts to optimize the cached data on all nodes. This process might last up to 2 hours. The cluster performance might be degraded during this time as query data might not yet be in the clusters cache, also the reorganization itself loads the CPU.
The conclusion from this is that clusters should not scale frequently. Optimally:
- Scale-out should occur 2 hours ahead of load increase – to finish the data reorganization before the load increase.
- Scale-in should occur right after the load decrease – to optimize cost.
Unfortunately, the Reactive Autoscale model acts based on data from the past, so it always acts with a delay:
- Scale-out is performed after detecting the high load with about 1 hour delay and is going to increase the load even more for 2 hours as explained. Notice that in cases of high load for short times it would not be effective at all.
- Scale-in is performed with about 3 hours delay, thus missing an opportunity to save money for the customer in these 3 hours of low load.
- Reactive Autoscale potentially have frequent scales operations, which should be avoided as explained above.
Let us look on the accumulated CPU metric of a typical cluster over 3 weeks:

We noticed that in many clusters the metric follows a seasonal pattern - might be weekly (less load on the weekend), daily (night vs daily business hours) or other seasonality’s due to recurring automatic workflows. So, we leveraged ADX Time Series Analysis capabilities, to predict the next day metrics, and schedule scale operations for the next day based on this forecast, considering the data reorganization process.
Continuing with the above example, let’s review the forecast of its CPU:

In the blue line, you can see the actual accumulated CPU, and in the orange line its forecasting. To the right, you can see that the actual CPU is flat for the future, but the prediction follows the same historical pattern.
Let us zoom in on our forecast (the orange line above appears hear in blue) for January 30th:

When we identify increase in cluster load, in the time stamp marked by the red line, we look for the maximum load in subsequent hours, which is marked by the yellow line, and schedule a scale-out operation to the number of instances that will handle this maximum-load. Doing so, we avoid consecutive scale-out operations. Also, we schedule the operations to occur 2 hours before the load-increase, as marked by the green line, so the cluster will be ready for the load increase after it has already finished the data reorganization.

When we identify decrease in cluster load, like in the red line, we avoid consecutive scale-in/scale-out operations by:
- Scheduling the scale-in operation only if we see that the low load will last long enough, as seen by the yellow arrowed segment
- Determining the target instances count of the scale-in operation by the maximum load of subsequent hours, which is marked by the orange line.
Furthermore, we avoid consecutive scale-in operations by scheduling only one scale-in operation for the consecutive hours. Note that we schedule the scale-in operation to occur right on time when the load drops, as marked by the green line (compared to the Reactive model, that acts in about 3 hours delay).
The Predictive model might not always forecast accurately (e.g. when the CPU does not have a pattern or when there is a change of the CPU pattern), so we created a general hybrid solution that integrates both the Reactive model and the Predictive model in the following way:
For each cluster:
- Every 12 hours, we forecast the metrics for the next day based on 3 weeks data.
- We add a confidence measurement to the forecast.
- Based on the forecast, we plan scale operations for the next 12 hours.
Every hour:
- For each of the clusters whose confidence is above a threshold, we run a light validation function to verify the forecast still holds.
- The clusters that have high confidence and passed the validation will be scaled by the Predictive model scheduled operations, while the rest will fall back to the Reactive model until next forecast.

Here is an example cluster manifesting the improvement when changing from the Reactive model to the Predictive model:

In the blue line, you can see the cluster CPU, and in the red line the instances count of the cluster.
- To the left of the green line, the Reactive Autoscale was active – the instances count was on average 25 machines and the scale operations are not aligned with the data because of the delayed response.
- To the right of the green line, the Predictive Autoscale is active - most of the time the cluster has 10 instances and only for predicted times of high loads it scales out to 25 instances. Note that the scale operations are aligned with the data – scale-out occurs around 2 hours before the load increase, making sure the cluster is ready for the high load ahead of time, and scale-in takes place just in time when the high load ends.
Overall, in this case the new Predictive Autoscale saved about 50% of the cluster cost while even improving the performance compared to the Reactive model.
To summarize, ADX built a new innovative Predictive Autoscale model, based on ML and Time Series Analysis, that guarantees the best performance while optimizing cluster cost. This Predictive Autoscale is currently in a private preview, to be generally available in the next few months. Meanwhile, you are welcome to contact us to join this preview and start saving $$$.
Brought to you by Dr. Ware, Microsoft Office 365 Silver Partner, Charleston SC.

Recent Comments